Primary Cells Market Size by Type (Hematopoietic, Dermatocytes, Hepatocytes, Gastrointestinal, Lung, Renal, Heart, Musculoskeletal), Origin (Human Primary Cells, Animal Primary Cells), End User (Pharma Biotech, CROs, Academia), Region - Global Forecast to 2028
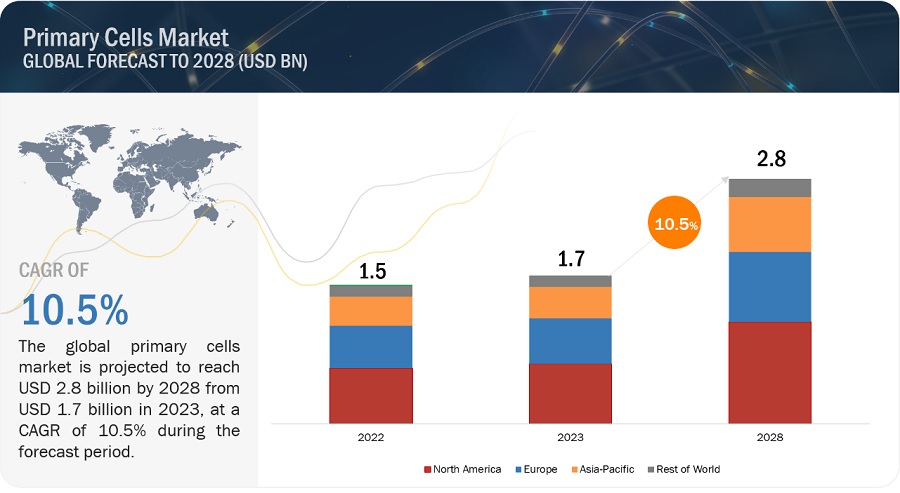
The size of global primary cells market in terms of revenue was estimated to be worth $1.7 billion in 2023 and is poised to reach $2.8 billion by 2028, growing at a CAGR of 10.5% from 2023 to 2028. The research study consists of an industry trend analysis, pricing analysis, patent analysis, conference and webinar materials, key stakeholders, and buying behaviour in the market.
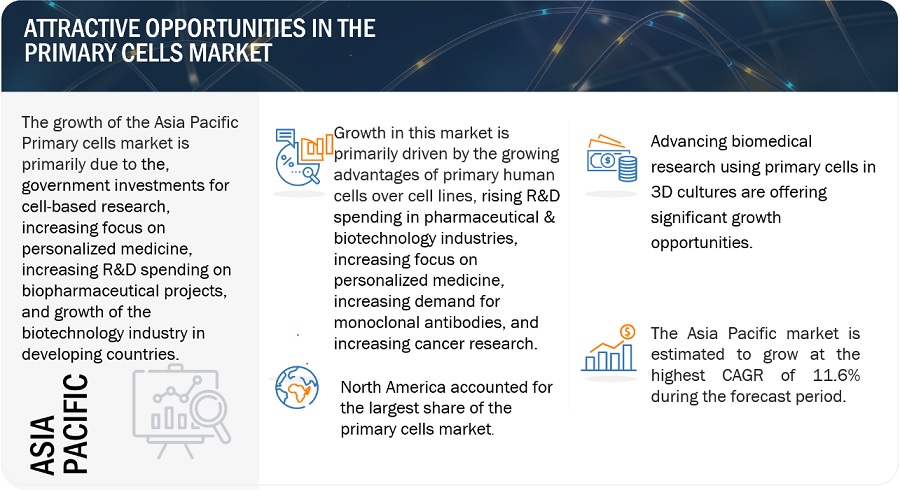
The growth of this market can be attributed to factors such as the is the growing advantages of primary human cells over cell lines, rising growth in pharmaceutical & biotechnology industries, increasing demand for monoclonal antibodies, Government investments for cell-based research, and increasing cancer research.
Attractive Opportunities in the Primary Cells Market
To know about the assumptions considered for the study, Request for Free Sample Report
Primary Cells Market Dynamics
DRIVER: Advantages of primary human cells over cell lines
Primary human cells have a wide range of advantages over in vitro cell lines; they provide reliable tissue-specific responses in a biologically relevant microenvironment. Drug responses in cell lines may not provide false responses in a cellular context. Moreover, primary human cells are cost-effective and help in reducing the expenditure on animal models required for in vivo studies. Pre-screened primary cells help in representing signaling in vivo very closely. Owing to this, pharmaceutical and biotechnology companies, as well as CROs, are increasingly shifting to primary human cells for their lead identification and optimization processes in drug discovery. Some of the key advantages of primary human cells include physiological relevance, genetic diversity, and tumor microenvironment representation, among others.
The conventional methods of toxicity and drug safety assessment involve animal testing, which is expensive, time-consuming, and low throughput. Thus, primary human cells present a preferable alternative for biochemical assays and animals because of their physiological relevance; inherent virtues; and ability to provide efficient, cost-effective, and accelerated drug discovery solutions. The use of primary cultures also tackles many ethical objections raised against animal experiments and allows for experimentation on human tissues, which is otherwise limited to in vitro studies. These advantages of human and animal primary cells are driving their adoption among end users and thereby fueling market growth.
RESTRAINT: Concerns regarding primary cell culture contamination
Contamination is a significant concern in primary cell cultures, as it can negatively impact experimental results, introduce variability, and compromise the reliability of research findings. Some of the main concerns regarding primary cell culture contamination include bacterial and fungal contamination, viral contamination, cross-contamination, and mycoplasma contamination. To minimize the risk of contamination, it is essential to follow good aseptic techniques and implement appropriate quality control measures. Implementing strict aseptic practices, performing regular monitoring, and testing, and using authenticated cells can minimize the risk of contamination in primary cell cultures, ensuring more reliable and reproducible experimental outcomes.
OPPORTUNITY: Advancing biomedical research using primary cells in 3D cultures
The use of primary cells in 3D cultures has advanced biomedical research by providing a more physiologically relevant model that better mimics the complexity and architecture of human tissues. Primary cells in 3D cultures have significantly advanced biomedical research by providing more physiologically relevant models for studying diseases, drug discovery, toxicity assessment, and personalized medicine. These models have the potential to bridge the gap between traditional cell culture and in vivo studies, leading to more accurate predictions and improved translation of research findings to clinical applications. Hence, the increasing use of primary cells with 3D cultures in various R&D activities is expected to influence the demand for primary cells in the coming years. This is expected to provide a wide range of growth opportunities for players in the market.
CHALLENGE: Sourcing and availability of primary cells
Obtaining high-quality primary cells can be a challenge due to the limited availability of specific tissue types and donor variability. Sourcing primary cells from diverse patient populations and obtaining consent for tissue donation can be logistically challenging. Additionally, the availability of certain primary cell types may be limited, making it difficult to meet the demand for specific research needs. Sourcing and availability of primary cells can be a challenge due to several factors, such as tissue acquisition, donor variability, tissue preservation, and transport, and the limited availability of specific cell types. Addressing these challenges requires collaborations between researchers, tissue banks, and regulatory bodies to ensure a streamlined process for tissue acquisition, storage, and distribution. Efforts to expand tissue repositories, establish partnerships with healthcare institutions, and promote tissue donation can help enhance the availability of primary cells. Additionally, advances in techniques for cryopreservation, tissue storage, and transport can improve the accessibility and quality of primary cells, overcoming some of the challenges associated with sourcing and availability.
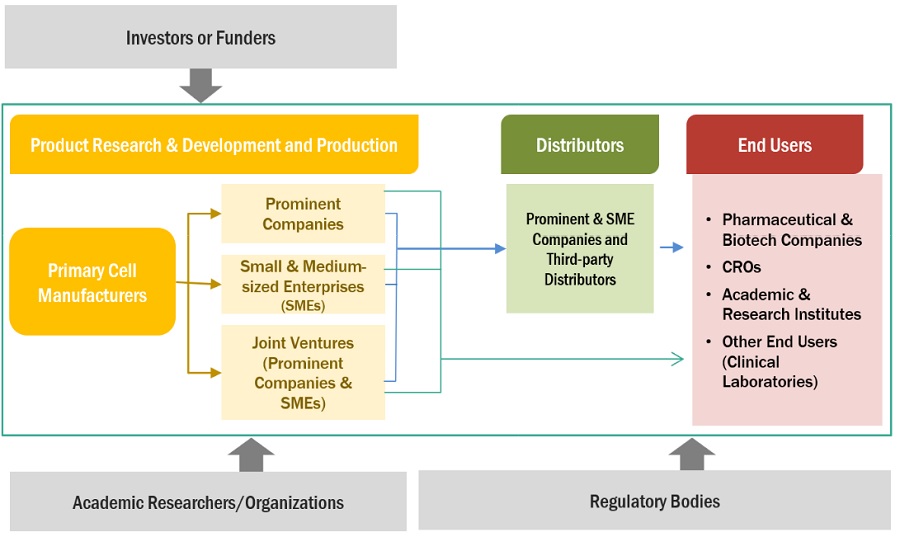
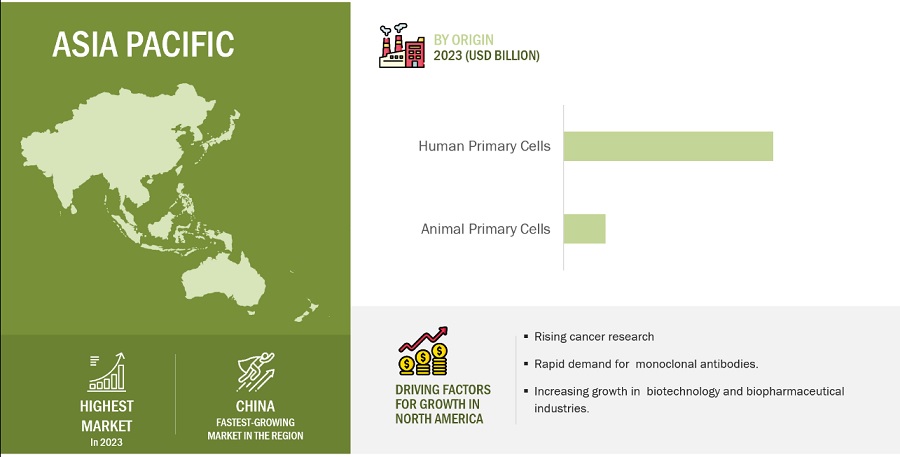
In 2022, by origin, human primary cells segment dominated the primary cells industry.
On the basis of origin, the primary cells market is divided into animal and human primary cells. In 2022, the human primary cells segment accounted for the largest share of the market. Factors responsible for the growth of the segment include the extensive use of human primary cells for studying human cancerous cell models, as well as in toxicology studies. The driving factors for the human market also include the demand for accurate disease models, advancements in research and drug discovery, the rise of regenerative medicine, safety testing requirements, the increasing burden of chronic diseases, technological innovations, ethical considerations, and collaborative initiatives within the scientific community.
Hematopoietic cells segment accounted for the largest share in the primary cells industry, by type in 2022.
On the basis of type, the primary cells market is divided into hematopoietic cells, dermatocytes, gastrointestinal cells, hepatocytes, lung cells, renal cells, heart cells, musculoskeletal cells, and other primary cells. In 2022, the hematopoietic cells segment accounted for the largest market share. Factors such as use of Hematopoietic cell transplants and to develop novel cancer therapies to treat blood cancers and other disorders of the immune system are responsible for the segment growth. Hepatocytes, due to their increasing demand in toxicological and pharmacological studies, are expected to witness the highest growth in the market.
In 2022, the pharmaceutical & biotechnology companies, and CROs segment accounted for the largest share of the global primary cells industry, by end user.
On the basis of end users, the primary cells market is segmented into pharmaceutical & biotechnology companies, and CROs, academic & research institutes, and other end users. In 2022, pharmaceutical & biotechnology companies and CROs accounted for the largest share of the market, mainly due to the high adoption of primary cells in cell-based experiments and cancer research in pharmaceutical & biotechnology companies and CROs, as well as the increasing number of R&D facilities globally.
In 2022, North America is the largest region for primary cells industry.
The global primary cells market is divided in four major regions, namely, North America, Europe, Asia Pacific, and the Rest of the World. In 2022, North America accounted for the largest share of the market, followed by Europe. Due to established clusters in North America and Europe, these regions are the preferred locations for drug discovery. Asia Pacific is expected to register the highest growth during the forecast period due to an increase in populations and a rise in the burden of diseases.
To know about the assumptions considered for the study, download the pdf brochure
Key players in the primary cells market are Thermo Fisher Scientific, Inc. (US), Merck KGaA (Germany), Lonza (Switzerland), and Corning Incorporated (US).
Scope of the Primary Cells Industry
|
Report Metric |
Details |
|
Market Revenue Size in 2023 |
$1.7 billion |
|
Projected Revenue Size by 2028 |
$2.8 billion |
|
Industry Growth Rate |
Poised to Grow at a CAGR of 10.5% |
|
Market Driver |
Advantages of primary human cells over cell lines |
|
Market Opportunity |
Advancing biomedical research using primary cells in 3D cultures |
This report categorizes the primary cells market to forecast revenue and analyze trends in each of the following submarkets:
By Origin
- Human Primary Cells
- Animal Primary Cells
By Type
- Hematopoietic Cells
- Dermatocytes
- Gastrointestinal Cells
-
Hepatocytes
- Cryopreserved Hepatocytes
- Fresh Hepatocytes
- Lung Cells
- Renal Cells
- Heart Cells
- Musculoskeletal Cells
- Other Primary Cells
By End User
- Pharmaceutical & Biotechnology Companies and CROs
- Academic & Research Institutes
- Other End Users
By Region
-
North America
- US
- Canada
-
Europe
- UK
- Germany
- France
- Italy
- Rest of Europe
-
Asia Pacific
- China
- Japan
- Rest of Asia Pacific
- Rest of the World
Recent Developments of Primary Cells Industry
- In June 2023, iXCells Biotechnologies entered into an agreement with Tebubio to enhance the distribution of the company’s products throughout Europe.
- In March 2022, Lonza launched human stem cell offerings to provide human cord blood CD34+ hematopoietic stem cells (CB-CD34+ HSCs) in large batch sizes, expanding
Frequently Asked Questions (FAQ):
What is the projected market revenue value of the global primary cells market?
The global primary cells market boasts a total revenue value of $2.8 billion by 2028.
What is the estimated growth rate (CAGR) of the global primary cells market?
The global primary cells market has an estimated compound annual growth rate (CAGR) of 10.5% and a revenue size in the region of $1.7 billion in 2023.
To speak to our analyst for a discussion on the above findings, click Speak to Analyst
This research study involved the extensive use of secondary sources, directories, and databases to identify and collect valuable information for the analysis of the global primary cells market. In-depth interviews were conducted with various primary respondents, including key industry participants, subject-matter experts (SMEs), C-level executives of key market players, and industry consultants, to obtain and verify critical qualitative and quantitative information and assess the growth prospects of the market. The global market size estimated through secondary research was then triangulated with inputs from primary research to arrive at the final market size.
Secondary Research
The secondary sources referred to for this research study include publications from government sources, such as the Department of Health and Social Care (DHSC), the International Cell Line Authentication Committee (ICLAC), National Cancer Institute (NCI), Cancer Research UK, Israel Cancer Research Fund (ICRF), Breast Cancer Research Foundation (BCRF), Centre for Cellular & Molecular Biology (CCMB), European Collection of Authenticated Cell Cultures (ECACC), Chinese Academy of Medical Sciences (CAMS), National Centre for Cell Science (NCCS), GLOBOCAN, World Health Organization (WHO), National Center for Biotechnology Information (NCBI), US Food and Drug Administration (FDA). Secondary sources also include corporate & regulatory filings, such as annual reports, SEC filings, investor presentations, and financial statements; business magazines & research journals; press releases; and trade, business, and professional associations. Secondary data was collected and analyzed to arrive at the overall size of the global primary cells market, which was validated through primary research.
Primary Research
Primary research was conducted to validate the market segmentation, identify key players, and gather insights into key industry trends and market dynamics.
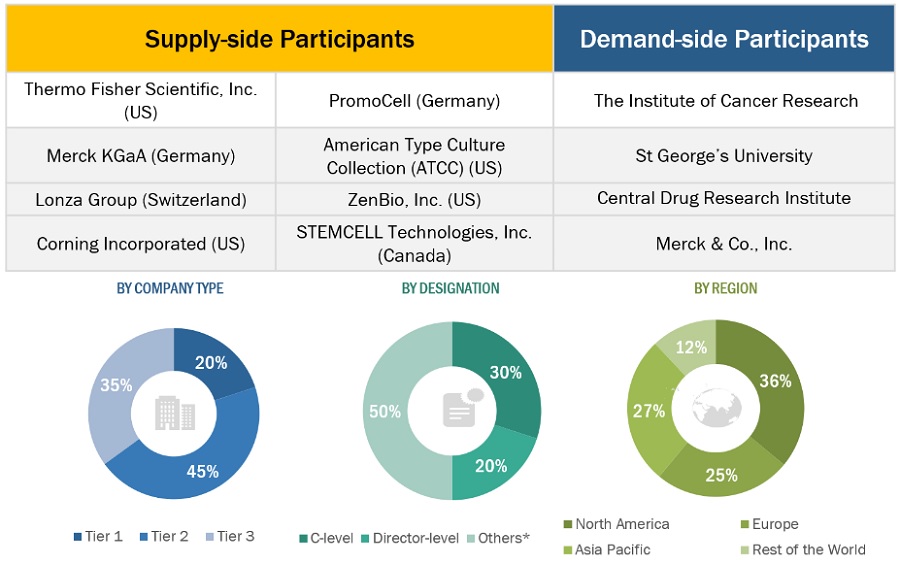
Extensive primary research was conducted after acquiring basic knowledge about the global primary cells market scenario through secondary research. Several primary interviews were conducted with market experts from the demand side, such as personnel from pharmaceutical & biopharmaceutical industries, academic & research institutes, and experts from the supply side, such as C-level & D-level executives, product managers, marketing & sales managers of key manufacturers, distributors, and channel partners. These interviews were conducted across four major regions: North America, Europe, Asia Pacific, and the Rest of the World. Approximately 70% and 30% of the primary interviews were conducted with supply-side and demand-side participants, respectively. This primary data was collected through questionnaires, e-mails, online surveys, personal interviews, and telephonic interviews.
The following is a breakdown of the primary respondents:
To know about the assumptions considered for the study, download the pdf brochure
Market Size Estimation
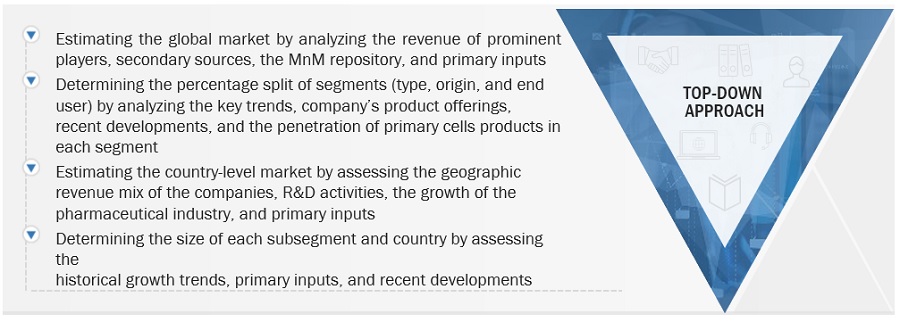
The report presents a detailed assessment of the primary cells market and qualitative inputs and insights from MarketsandMarkets. The global size of the primary cells market was estimated through multiple approaches. A detailed market estimation approach was followed to estimate and validate the value of the primary cells and other dependent submarkets. These methods were also used extensively to estimate the size of various subsegments in the market. The research methodology used to estimate the market size includes the following:
- The key players in the industry and market have been identified through extensive primary and secondary research.
- The revenues generated from the primary cells business of leading players have been determined through primary and secondary research.
- All percentage shares, splits, and breakdowns have been determined using secondary sources and verified through primary sources.
Top- Down Approach
To know about the assumptions considered for the study, Request for Free Sample Report
Bottom-up Approach
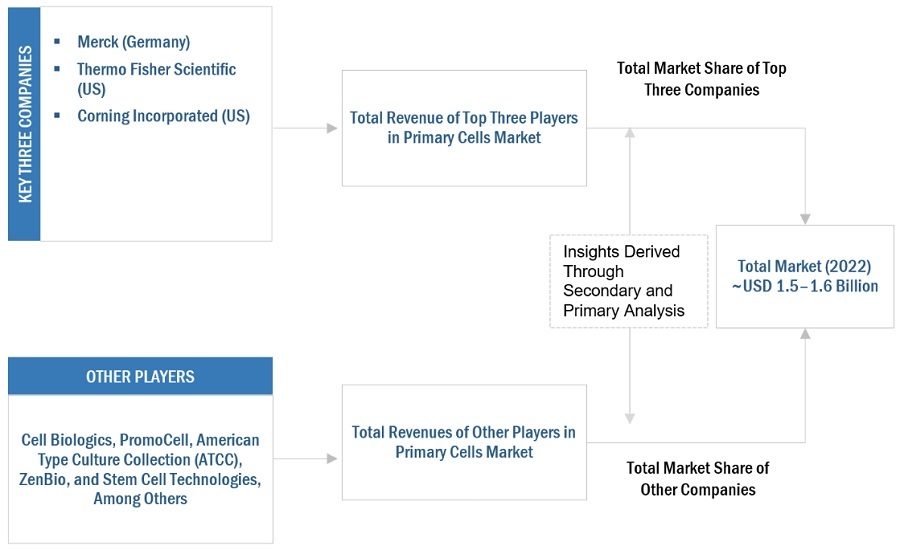
Approach: MnM Repository Analysis
For this report, the previous version of the primary cells market were considered. The global and regional market values of the primary cells market and dependent submarkets were extracted from the MnM repository and validated through secondary and primary research. The final global market size was triangulated through the average of all approaches and validated through primary interviews with industry experts.
Data Triangulation
After arriving at the market size from the market size estimation process explained above, the total market was divided into several segments and subsegments. Data triangulation and market breakdown procedures were employed, wherever applicable, to complete the overall market engineering process and arrive at the exact statistics for all segments and subsegments.
Market Definition:
Primary cells are the most physiologically and biologically relevant in vitro tools for biotechnology-based research. These cells are directly isolated from primary cell cultures of human or animal living tissue through enzymatic or mechanical methods. The integration of primary cells into cell-based research programs has helped to deliver biologically accurate and relevant data because they efficiently maintain their fundamental cellular functions.
Key Stakeholders
- Research institutes
- Manufacturers & distributors of primary cells
- Clinical research organizations (CROs)
- Academic research institutes
- Biopharmaceutical & biotechnology companies
- Cell banks
- Venture capitalists and investors
- Government associations dedicated to primary cells and cell culture preservation
Report Objectives
- To define, describe, segment, and forecast the global primary cells market by origin, type, end user, and region
- To provide detailed information regarding the major factors influencing market growth (drivers, restraints, opportunities, and challenges)
- To analyze micromarkets1 with respect to individual growth trends, prospects, and contributions to the overall market
- To analyze market opportunities for stakeholders and provide details of the competitive landscape for key players
- To forecast the size of the market segments with respect to four regions, namely, North America, Europe, Asia Pacific, and the Rest of the World
- To profile the key players and comprehensively analyze their product portfolios, market positions, and core competencies
- To track and analyze company developments such as product launches, expansions, and acquisitions in the primary cells market.
- To benchmark players within the market using the proprietary "Competitive Leadership Mapping" framework, which analyzes market players on various parameters within the broad categories of business and product strategy
Available Customizations
With the given market data, MarketsandMarkets offers customizations as per the company’s specific needs. The following customization options are available for this report:
Geographical Analysis
- Further breakdown of the RoE primary cells market, by country
- Further breakdown of the RoAPAC primary cells market, by country
- Further breakdown of the RoW primary cells markets, by country
Company Information
- Detailed analysis and profiling of additional market players (Up to five)
Segment Analysis
- Further breakdown of the therapeutic area segment as per the product portfolio of prominent players operating in the market.


 Generating Response ...


Growth opportunities and latent adjacency in Primary Cells Market