Probiotics Market by Product Type (Functional Food & Beverages (FnB), Dietary Supplements, and Feed), Ingredient (Bacteria and Yeast), End User (Human and Animal), Distribution Channel and Region - Global Forecast to 2029
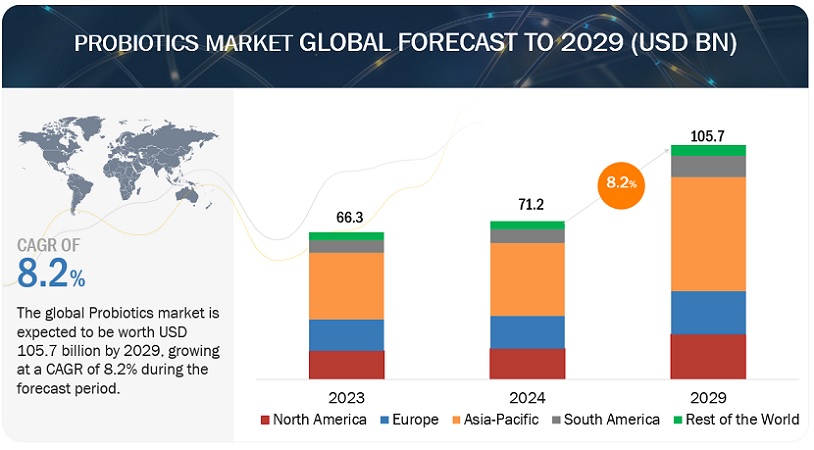
According to MarketsandMarkets, the global Probiotics market size is estimated to be valued at USD 71.2 billion in 2024 and is projected to reach USD 105.7 billion by 2029, recording a CAGR of 8.2%. This growth is primarily attributed to a confluence of factors. Rising consumer awareness of gut health's link to overall well-being and a growing preference for preventive healthcare are key drivers. Additionally, innovation in delivery methods and targeted strains promises exciting future growth.
The expanding business has offered lucrative business opportunities to the players who are operating in the market segments. For instance, in October 2023, Probi (Sweden) unveiled synbiotic solutions in collaboration with Clasado (UK) at Supply Side West. Launching Bimuno GOS with Probi Defendum and Probi Digestis , these innovations signify a strategic leap into the burgeoning synbiotics sector. This milestone underscores Probi's commitment to evidence-based advancements in digestive and immune health. Other major players, such as ADM (US), expand its international distribution partnership with Nutramax, bolstering their presence in the probiotics market. ADM Protexin now oversees Nutramax brands in Europe and select Asia Pacific markets, aiming for further global expansion. This strategic move enhances access to Nutramax's renowned pet health solutions. The deal underscores ADM's commitment to quality and animal welfare.
The overall probiotics market is classified as a fragmented market, with the Major players, namely Nestlé (Switzerland), ADM (US), International Flavors & Fragrances Inc. (US), Yakult Honsha Co., Ltd. (Japan), Meiji Holdings Co., Ltd. (Japan) occupying 12-24% of the market share.
To know about the assumptions considered for the study, Request for Free Sample Report
To know about the assumptions considered for the study, download the pdf brochure
Probiotics Market Dynamics
Drivers: Health benefits associated with probiotic-fortified foods
Health awareness among consumers is on the rise, wherein most consumers are constantly in search of healthy food products for daily consumption. Probiotics have provided strong health benefits, more specifically to the human digestive system. In Europe, the dairy sector is the most developed segment of the market. Probiotic yogurts and fermented milk that are sold in a convenient “daily dose and small pack” format are the most widely used. Consumer acceptance of probiotic-containing products varies greatly across Europe. For instance, in August 2021, Müller launched its first stand-alone yogurt brand in the UK called Gut Glory. The new range will be available in pack sizes of 450g and 125g packs. In addition to this, the Food and Agriculture Organization of the United Nations (FAO) has concluded the solid demand for dairy products, such as cheese and yogurts, globally. International trade in cheese products reached 2.8 million tons in 2020, sustaining the expansion for a fifth consecutive year by 4.1%, underpinned by the continued solid import demand by several countries, especially the Russian Federation, Iraq, China, and the Republic of Korea.
Restraints: High R&D costs for developing new probiotic strains
Substantial investments in research and development (R&D), alongside expenditures on laboratories, research equipment, and the hiring of skilled professionals, present formidable barriers to entry in the probiotics market. Scientific validation of probiotic applications has proven crucial for market success, with their association with health benefits posing challenges for manufacturers seeking a return on investment (RoI) given the high initial capital outlay. Leading companies such as , Probi (Sweden), Nestlé (Switzerland), ADM (US), Danone (France), and Yakult Honsha (Japan) have prioritized bolstering their R&D capabilities to secure a competitive edge, thereby erecting barriers for potential market entrants.
The development and production of probiotic strains and products adhere to international food regulations, contributing to high production costs and subsequently elevated final product prices. Marketing and distribution of probiotic products further inflate costs, as they necessitate distinct packaging and distribution channels compared to conventional products. Despite consumer awareness of the health advantages associated with probiotics, their premium pricing presents a hurdle to widespread adoption, posing a significant challenge for manufacturers.
Opportunities: Replacement of pharmaceutical agents by probiotics
The rising demand for probiotics underscores consumers' preference for products with established health benefits. As evidence of probiotics' positive impact on health continues to accumulate, consumer expectations regarding these products have grown. This trend towards seeking safe, natural, and cost-effective alternatives to pharmaceuticals has prompted the exploration of probiotics' potential as pharmaceutical agents. The efficacy of probiotics in this context appears to depend on the specific strain and dosage used. Clinical trials have demonstrated that probiotics have the potential to treat various human disorders, particularly those affecting the gastrointestinal (GI) tract. Incorporating probiotic-rich fermented dairy products into diets has shown promise in addressing specific clinical conditions, including antibiotic-associated diarrhea, rotavirus-associated diarrhea, inflammatory bowel disease, irritable bowel syndrome (IBS), allergic diseases, cancer, Helicobacter pylori infection, and lactose intolerance.
As per the research paper published by National Center for Biotechnology Information, probiotics have demonstrated high potential to treat and prevent various diseases such as neurodegenerative disorders, cancers, cardiovascular diseases, and inflammatory diseases. In addition, probiotics are also effective against multidrug-resistant pathogens and help maintain a balanced gut microbiota ecosystem.
Challenges: Complexities in integrating probiotics in functional foods
The process of developing and commercializing functional food products involves complexity, cost, and uncertainty. Success in this field depends on various factors including consumer demand, technological advancements, and regulatory frameworks. Additionally, consumer awareness of the health benefits associated with specific ingredients influences the acceptance of functional foods. While traditional functional ingredients like minerals, fiber, and vitamins remain popular, there is growing interest in novel products enriched with probiotics, prebiotics, flavonoids, carotenoids, and conjugated linolenic acid
The researcher has to work in-depth to overcome all the challenges related to the selection and development of the strain and related production processes. Probiotic strains are prone to changes in pH and temperature. The strains must sustain while integrating with functional foodstuffs. The basic requirement for probiotics is that products should contain sufficient numbers of microorganisms up to the expiry date. Hence, probiotics must contain specific strains and maintain certain numbers of live cells to produce health benefits in the host. Different countries have decided on the minimum number of viable cells required in the probiotic product for it to be beneficial. The preservation of these probiotic microorganisms presents a challenge as they are affected by exposure to temperature, oxygen, and light.
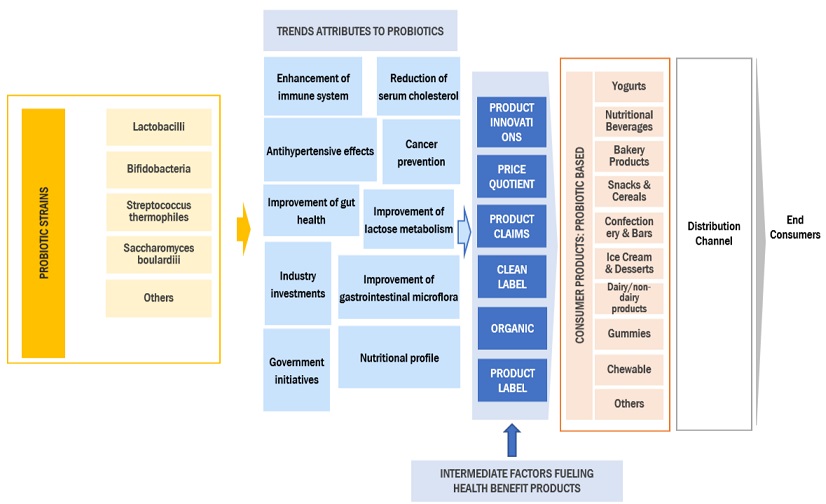
The Probiotics Market Ecosystem
By Product type, the Functional Food & beverages segment accounts for the highest market share Probiotics market during the forecast period.
Consumer demand for convenient and proactive wellness solutions has propelled the popularity of probiotic-fortified products like yogurts, kefir, kombucha, and fortified beverages, which offer an easy and enjoyable way to incorporate probiotics into daily routines. These products align well with the rising trend of preventive healthcare, catering to consumers seeking to maintain their health and well-being proactively. The segment benefits from continuous innovation and diversification, with manufacturers introducing a wide range of new probiotic-infused products to meet diverse taste preferences and dietary needs. This includes offerings such as probiotic-infused waters, shots, snack bars, and chocolates, catering to various consumer demographics and lifestyle choices, including vegan and lactose-free diets. As consumers increasingly seek personalized solutions for their health concerns, the segment is poised to further expand through tailored probiotic formulations designed to address specific digestive issues or mental health concerns, emphasizing the importance of personalization in driving market growth
By Ingredient, the bacteria segment accounts for a significant market share in the Probiotics market.
Bacteria have a well-established reputation and extensive scientific backing supporting their efficacy in promoting gut health, a fundamental application of probiotics. Bacterial strains offer a broader spectrum of diversity compared to alternative probiotic types like yeast, enabling the development of targeted formulations tailored to address specific health needs. Recent innovations, such as psychobiotic strains targeting mental well-being and spore-forming bacteria with improved shelf life and delivery properties, underscore the versatility and applicability of bacterial probiotics. The established and cost-effective manufacturing processes associated with bacteria contribute to greater affordability and broader consumer accessibility, further consolidating the bacteria segment's market dominance during the forecasted period.
By Distribution channel, the Hypermarkets/ Supermarkets segment accounts for a significant market share in the Probiotics market.
Hypermarkets, comprising expansive supermarkets and warehouse clubs, stand as pivotal hubs for probiotic distribution, capitalizing on their extensive reach and accessibility. With a sprawling network of stores, hypermarkets offer unparalleled convenience to a broad spectrum of consumers, ensuring easy access to probiotic products. This accessibility is especially important for those who prioritize convenience and don't often visit specialty stores. Moreover, hypermarkets provide a comprehensive shopping experience by curating a diverse selection of groceries, including a dedicated health and wellness section where probiotics are prominently featured. This one-stop shopping approach streamlines the purchasing process for consumers, allowing them to fulfill their dietary needs alongside other household essentials. The abundant product variety available at hypermarkets, spanning different brands, formulations, and price points, further caters to diverse consumer preferences, enriching the shopping experience.
By End User, the Human segment accounts for a significant market share in the Probiotics market.
This segment benefits from a multifaceted approach that encompasses growing awareness of gut health among the public, underscored by a 2022 IFIC survey revealing that 24% of respondents prioritize digestive health in their overall well-being. Additionally, with 32% of respondents actively seeking out probiotics and 60% of those consumers integrating them into their daily routine, there is a palpable demand for probiotic products tailored to human health needs, including digestive support, immune enhancement, and mental well-being. Furthermore, the human probiotics market thrives on a continuous stream of product innovation, evidenced by the emergence of personalized formulations targeting specific health concerns and innovative delivery methods such as chewable tablets. This innovative spirit extends to exploring psychobiotic strains for mental health benefits, highlighting the dynamic nature of the market.
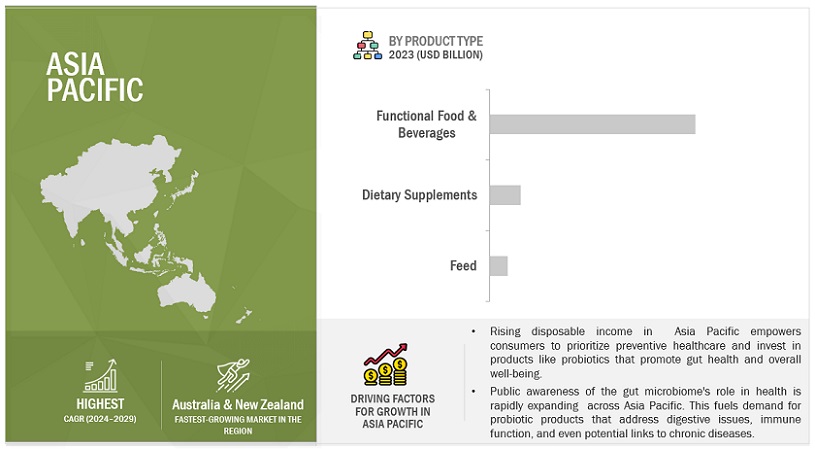
Increased awareness of gut microbiome and aging population are key drivers in Asia-Pacific probiotics market. Asia Pacific is poised to experience the highest CAGR in the Probiotics market during the forecast period.
An increased awareness of the gut microbiome and its profound impact on digestion, immunity, and mental health among the public. This heightened awareness is prompting individuals to explore probiotic supplements and foods fortified with probiotics as a means to support overall well-being. Additionally, the region's rapidly aging population, particularly in countries like South Korea, is driving the adoption of probiotics, as they are increasingly recognized for their potential benefits for gut health and immune function in older adults. Innovation, such as the development of personalized probiotic strains tailored to individual health needs, and exploration into probiotics for skin health and mental well-being, is expected to further amplify market potential in the region. In December 2020 government initiatives, such as India's promotion of nutraceuticals through policies such as the AYUSH policy, are also fostering market growth. With these factors at play, the Asia Pacific region is poised to experience the highest CAGR in the probiotics market during the forecast period.
Asia Pacific: Probiotics Market Snapshot
Key Market Players
Key players in this market include Probi (Sweden), Nestlé (Switzerland), ADM (US), Danone (France), International Flavors & Fragrances Inc. (US), Yakult Honsha Co., Ltd. (Japan), BioGaia (Sweden), MORINAGA MILK INDUSTRY CO., LTD. (Japan), Meiji Holdings Co., Ltd. (Japan), Lifeway Foods, Inc. (US), Adisseo (France), Winclove Probiotics (US), AB-Biotics, S.A. (Belgium), Apsen Farmacêutica (Brazil), and Lallemand (Canada).
Get online access to the report on the World's First Market Intelligence Cloud
- Easy to Download Historical Data & Forecast Numbers
- Company Analysis Dashboard for high growth potential opportunities
- Research Analyst Access for customization & queries
- Competitor Analysis with Interactive dashboard
- Latest News, Updates & Trend analysis
Request Sample Scope of the Report
Get online access to the report on the World's First Market Intelligence Cloud
- Easy to Download Historical Data & Forecast Numbers
- Company Analysis Dashboard for high growth potential opportunities
- Research Analyst Access for customization & queries
- Competitor Analysis with Interactive dashboard
- Latest News, Updates & Trend analysis
|
Report Metric |
Details |
|
Market size estimation |
2024–2029 |
|
Base year considered |
2023 |
|
Forecast period considered |
2024–2029 |
|
Units considered |
Value (USD), Volume (KT) |
|
Segments Covered |
Product type, ingredient, distribution channel, end user, and region. |
|
Regions covered |
North America, Europe, Asia Pacific, South America, and Rest of the World |
|
Companies studied |
|
Report Scope:
Probiotics market:
By Product Type
-
Functional Food & Beverages
- Dairy Products
- Non-Dairy Beverage
- Infant Formula
- Cereals
- Other Applications
-
Dietary Supplements
- Tablets
- Capsules
- Powders
- Liquids
- Soft Gels
- Gel Caps
- Feed
By Ingredient
-
Bacteria
-
Lactobacilli
- Lactobacillus Acidophilus
- Lactobacillus Rhamnosus
- Lactobacillus Casei
- Lactobacillus Reuteri
- Bifidobacterium
- Streptococcus Thermophilus
-
Lactobacilli
-
Yeast
- Saccharomyces Boulardii
- Other Yeasts
By Distribution Channel
- Hypermarkets/Supermarkets
- Pharmacies/Drugstores
- Specialty Stores
- Online
- Convenience Stores/Small Retail Formats
By End User
- Human
- Animal
By Region
- North America
- Europe
- Asia Pacific
- South America
- Rest of the World
Recent Developments
- In February 2024, AB Biotics SA (Netherlands) expands its presence in Asia, partnering with Wonderlab for their globally marketed product, AB-LIFE . The collaboration introduces Shape100 , a probiotic blend focusing on cardiometabolic health, to the Chinese market. This strategic move aims to address cholesterol-related concerns through evidence-based solutions.
- In November 2023, Nestlé (Switzerland) launched N3 milk, a breakthrough in nutritional innovation. Incorporating prebiotic fibers and reduced lactose, it enriches gut health and boasts over 15% fewer calories. Tailored for diverse dietary needs, N3 supports bone health, muscle growth, and immunity.
- In September 2023, Yakult Honsha Co Ltd (Japan) Introduced the Yakult Gohonmaru Cafe & Gallery in Utsunomiya, Japan. This innovative venture, inclusive of a beauty salon and gallery, offers patrons an array of delectable treats infused with Yakult probiotic beverage. The strategic investment underscores Yakult's commitment to expanding its consumer base and fostering brand awareness.
Frequently Asked Questions (FAQ):
What are the key product types considered in the study for Probiotics, and which segments within Asia Pacific’s Functional Food & Beverages product type are projected to experience promising growth?
The study focuses on three major product types: Functional Food & Beverages, Dietary Supplements and Feed. Within Asia Pacific’s Functional Food & Beverages product type, the subsegment of Dairy Products emerges as the dominant category, showcasing promising growth potential in the projected market trends.
Is there customizable information available specific to the North America Feed market within the Probiotics study, and if so, what details are provided?
Yes, Certainly, customization options are available for the North America Feed market across different segments, encompassing market size, dynamics, forecasts, competitive landscape, and company profiles. Exclusive insights will be offered for the specified North America countries below:
- US
- Canada
- Mexico
Could you highlight the opportunities identified in the study that are expected to fuel the future growth of the Probiotics market?
The global Probiotics market is characterized by the following opportunities:
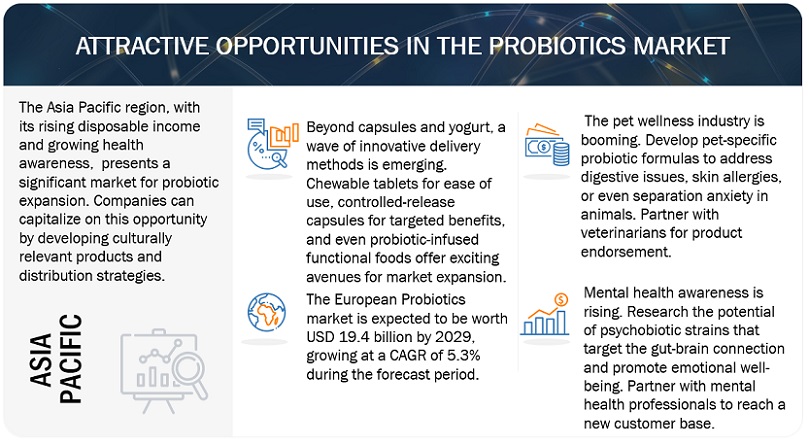
Personalized Probiotics: The study likely identified a growing opportunity in personalized probiotic solutions. This could involve targeted strains for specific health concerns, genetic testing to determine optimal strains, or even custom formulations based on individual needs.
Delivery System Innovation: New and innovative delivery methods present a significant opportunity. The study might highlight the potential of chewable tablets for increased convenience, controlled-release capsules for targeted delivery, or even the exploration of incorporating probiotics into functional foods beyond yogurt.
Among the regions studied, which one is anticipated to exhibit the CAGR for the Probiotics market?
Asia Pacific is anticipated to exhibit the highest CAGR for the Probiotics market at 9.6%. This surge is fueled by factors like rising disposable income, increasing awareness of gut health benefits, and a growing population with a focus on preventive healthcare. This trend positions Asia Pacific as a lucrative market for future probiotic product development and expansion.
Beyond hypermarkets, which emerging distribution channels offer the highest growth potential for probiotics?
Emerging distribution channels with high growth potential for probiotics include pharmacies/drugstores due to increasing consumer health awareness. .
To speak to our analyst for a discussion on the above findings, click Speak to Analyst
This research involves the extensive use of secondary sources; directories; and databases (Bloomberg and Factiva) to identify and collect information useful for a technical, market-oriented, and commercial study of the Probiotics market. In-depth interviews were conducted with various primary respondents, such as key industry participants, Subject Matter Experts (SMEs), C-level executives of key market players, and industry consultants, to obtain and verify critical qualitative and quantitative information and to assess prospects.
Secondary Research
In the secondary research process, various sources, such as the Food and Agricultural Organization (FAO), United States Department of Agriculture (USDA), U.S. Food and Drug Administration (FDA) U.S. Food and Drug Administration (FDA), European Food Safety Authority (EFSA), World Health Organization (WHO), Consumer Healthcare Products Association (CHPA), European Federation of Associations of Health Product Manufacturers (EHPM), Canadian Health Food Association (CHFA), and Health Food Manufacturers' Association (HFMA), associations were referred to identify and collect information for this study. The secondary sources also include journals, press releases, investor presentations of companies, whitepapers, certified publications, articles by recognized authors and regulatory bodies, trade directories, and paid databases.
Primary Research
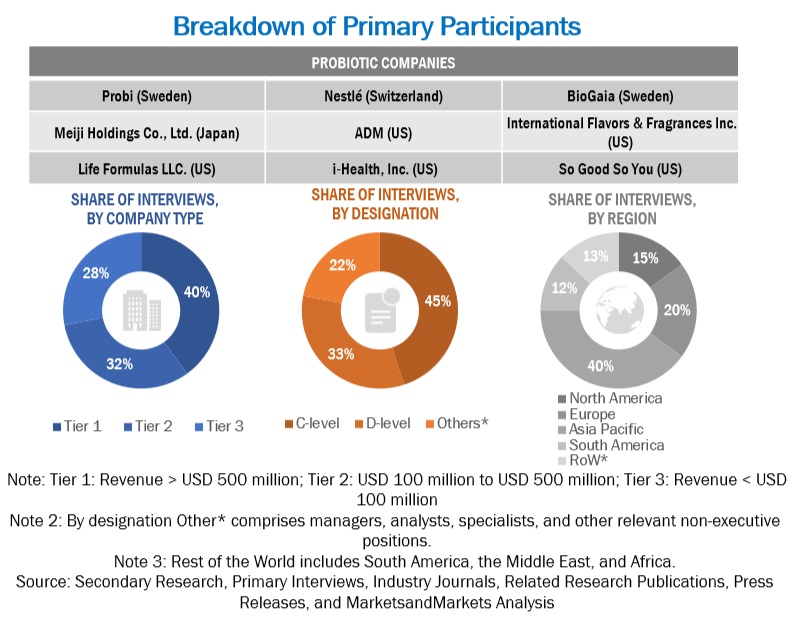
The Probiotics market encompasses various stakeholders involved in the supply chain, raw material manufacturers, raw material suppliers, regulatory organizations, and research institutions. To gather comprehensive information, primary sources from both the supply and demand sides were engaged. Primary interviewees from the supply side consisted of manufacturers, distributors, importers, and technology providers involved in the production and distribution of Probiotics. On the demand side, key opinion leaders, executives, and CEOs of companies in the Probiotics industry were approached through questionnaires, emails, and telephonic interviews. This approach ensured a comprehensive and well-rounded understanding of the Probiotics market from various perspectives.
To know about the assumptions considered for the study, download the pdf brochure
Market Size Estimation
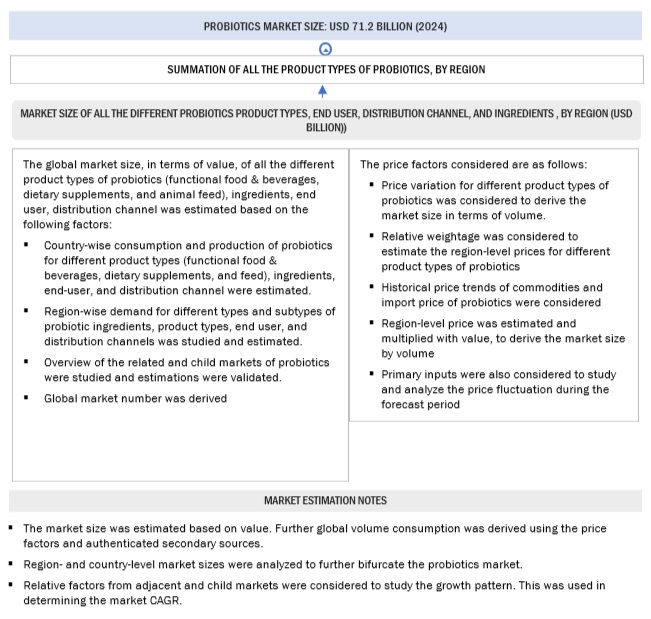
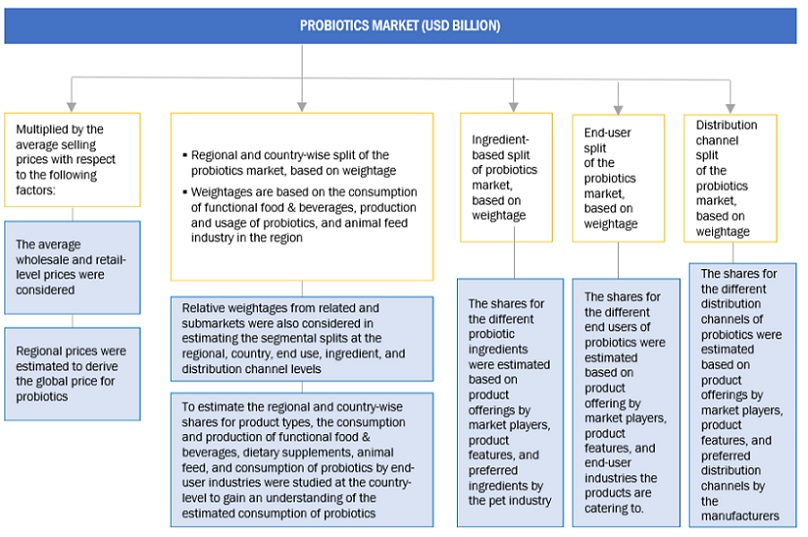
The top-down and bottom-up approaches were used to estimate and validate the market’s and various dependent submarkets’ size. The research methodology used to estimate the market size includes extensive secondary research of key players, reports, reviews, and newsletters of top market players, along with extensive interviews from leaders, such as CEOs, directors, and marketing executives.
Global Probiotics Market Size: Top-Down Approach

To know about the assumptions considered for the study, Request for Free Sample Report
Global Probiotics Market Size Estimation: Bottom-Up Approach
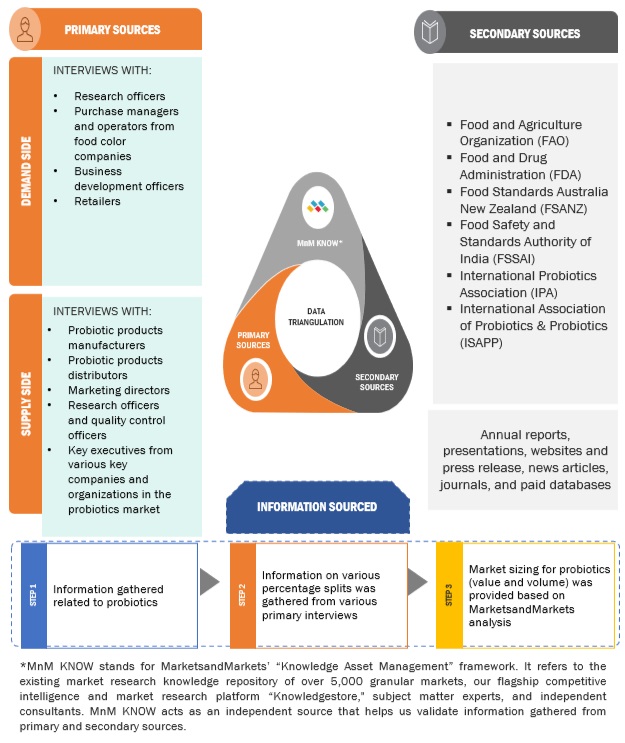
Global Probiotics Market: Data Triangluation
After arriving at the overall size from the market size estimation process explained above, the total market was split into several segments and subsegments. The data triangulation and market breakdown procedures explained below were implemented, wherever applicable, to complete the overall market engineering process and arrive at the exact statistics for various market segments and subsegments. The data was triangulated by studying various factors and trends from the demand and supply sides. Along with this, the market size was validated using both the top-down and bottom-up approaches.
Market Definition
The joint Food and Agriculture Organization (FAO)/World Health Organization (WHO) working group defines probiotics as “live micro-organisms, which when administered in adequate amounts confer a health benefit on the host” (FAO/ WHO, 2001).
Probiotics are living microorganisms that have been shown to provide specific health benefits to consumers. They are known to support gut health and help in running the digestive system smoothly. Yogurt is one of the prime natural sources of probiotics.
According to the National Center for Complementary and Integrative Health, “Probiotics are live microorganisms that are intended to have health benefits when consumed or applied to the body.” The major function of probiotics is to maintain a healthy balance in the body. Several types of microorganisms are present in probiotics, and they may have different effects on the body. The most common bacteria belong to the group called Lactobacillus and Bifidobacterium.
Key Stakeholders
- Manufacturers, Importers and Exporters, Traders, Distributors, and Suppliers of Probiotics
- Nutraceutical Manufacturers
- Food Processors and Manufacturers
- Government and Research Organizations
- Trade Associations and Industry Bodies
-
Regulatory bodies and associations are as follows:
- Food Agriculture Organization (FAO)
- World Health Organization (WHO)
- International Dairy Federation (IDF)
- European Food & Feed Cultures Association (EFFCA)
- National Yogurt Association (NYA)
- International Scientific Association for Probiotics and Prebiotics (ISAPP)
- International Probiotics Association (IPA)
- Council for Responsible Nutrition (CRN)
- National Yogurt Association (NYA)
- International Frozen Yogurt Association (IFYA)
- American Nutrition Association (ANA)
Report Objectives
- To define, segment, and project the global market for Probiotics on the basis of product type, ingredient, distribution channel, end user, and region
- To provide detailed information regarding the key factors influencing the growth of the market (drivers, restraints, opportunities, and industry-specific challenges)
- To strategically analyze the micro markets with respect to individual growth trends, future prospects, and their contribution to the total market
- To analyze the opportunities in the market for stakeholders and provide a competitive landscape of the market leaders
- To project the size of the market and its submarkets, in terms of value with respect to the regions (along with the key countries)
- To strategically profile the key players and comprehensively analyze their market position and core competencies
- To analyze competitive developments in the Probiotics market, including joint ventures, mergers & acquisitions, new product developments, and research & development activities
Available Customizations:
With the given market data, MarketsandMarkets offers customizations according to company-specific scientific needs.
The following customization options are available for the report:
Product Analysis
- Product Matrix, which gives a detailed comparison of the product portfolio of each company
Geographic Analysis
With the given market data, MarketsandMarkets offers customizations according to company-specific scientific needs.
- Further breakdown of the Rest of the European Probiotics market, by key country
- Further breakdown of the Rest of the Asia Pacific Probiotics market, by key country
- Further breakdown of the Rest of South America Probiotics market, by key country
Company Information
- Detailed analyses and profiling of additional market players


 Generating Response ...


Growth opportunities and latent adjacency in Probiotics Market