Production Monitoring Market by Component (Solutions and Services), Solution, Service (Professional and Managed), Organization Size, Industry (Process Manufacturing and Discrete Manufacturing), and Region - Global Forecast to 2023


The study involved 4 major steps to estimate the current market size for the production monitoring market. Exhaustive secondary research was done to collect information on market, peer market, and parent market. The next step was to validate these findings, assumptions, and sizing with industry experts across value chain through primary research. Both top-down and bottom-up approaches were employed to estimate the complete market size. Thereafter, market breakdown and data triangulation were used to estimate the market size of segments and subsegments.
Secondary Research
In the secondary research process, various secondary sources such as Hoovers, Bloomberg BusinessWeek, and Dun & Bradstreet have been referred to, so as to identify and collect information for this study. These secondary sources included annual reports, press releases and investor presentations of companies, white papers, technology journals and certified publications; and articles from recognized authors, directories, and databases.
Primary Research
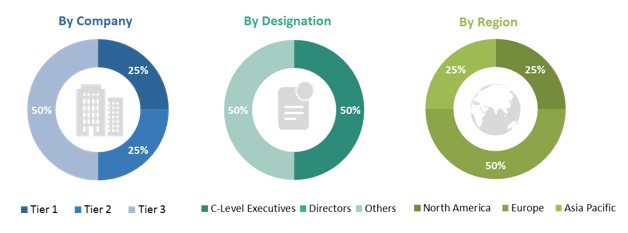
The production monitoring market comprises several stakeholders such as solution and service providers, support and maintenance service providers, manufacturing enterprises, technology consultants, system design and development vendors, and logistics and supply chain management providers. The demand side of this market is characterized by the development of process and discrete manufacturing industries, such as oil and gas, food and beverages, pharmaceutical, chemical, automotive, and electronics and semiconductors. The supply side is characterized by advancements in technology and diverse application industries. Various primary sources from both the supply and demand sides of the market were interviewed to obtain qualitative and quantitative information. Following is the breakdown of primary respondents:
To know about the assumptions considered for the study, download the pdf brochure
Market Size Estimation
Both top-down and bottom-up approaches were used to estimate and validate the total size of the production monitoring market. These methods were also used extensively to estimate the size of various subsegments in the market. The research methodology used to estimate the market size includes the following:
- The key players in the industry and markets have been identified through extensive secondary research.
- The production monitoring market expenditures across regions, along with the geographic split in various segments, have been considered to arrive at the overall market size.
- All percentage shares, splits, and breakdowns have been determined using secondary sources and verified through primary sources.
Data Triangulation
After arriving at the overall market size using the market size estimation processes as explained above the market was split into several segments and subsegments. In order to complete the overall market engineering process and arrive at the exact statistics of each market segment and subsegment, the data triangulation and market breakdown procedures were employed, wherever applicable. The data was triangulated by studying various factors and trends from both, the demand and supply sides, in the manufacturing industries.
Report Objectives
- To define, describe, and forecast the production monitoring market by component (solutions and services), deployment type, organization size, application area, industry, and region
- To provide detailed information about the major factors (drivers, restraints, opportunities, and industry-specific challenges) influencing the market growth
- To analyze the opportunities in the market and details of the competitive landscape for stakeholders and market leaders
- To forecast the market size of the segments with respect to 5 main regions, namely, North America, Europe, Asia Pacific (APAC), Middle East and Africa (MEA), and Latin America
- To profile the key players and comprehensively analyze their market rankings and core competencies
- To analyze the competitive developments, such as mergers and acquisitions, new partnerships, new contracts, and new product developments, in the production monitoring market
Scope of the Production Monitoring Market Report
|
Report Metrics |
Details |
|
Market size available for years |
2016�2023 |
|
Base year considered |
2017 |
|
Forecast period |
2018-2023 |
|
Forecast units |
Value (USD) |
|
Segments covered |
Solution, Service (Professional and Managed), Application Area, Organization Size, Deployment, Industry (Process and Discrete Manufacturing), and Region |
|
Geographies covered |
North America, APAC, Europe, Middle East and Africa, and Latin America |
|
Companies covered |
Capgemini (France), Infosys (India), Oracle (US), Hitachi (Japan), Siemens (Germany), IQMS (US), Softweb Solutions (US). A total of 25 players covered. |
This research report categorizes the production monitoring market based on solution, service (professional, managed), application area, deployment, organization size, industry (process and discrete manufacturing), and region.
By Component:
- Solutions
- Services
By Solution:
- Asset Management
- Data Management
- Smart Surveillance and Security
- Mobile Workforce Management
By Service:
- Professional Services
- Managed Services
By Professional Service:
- Integration and Deployment
- Consulting
- Support and Maintenance
- Education and Training
By Managed Service:
- Infrastructure Management
- Security Management
By Application Area:
- Business Process Optimization
- Logistics and Supply Chain Management
- Automation and Control Management
- Emergency and Incident Management
By Deployment Type:
- On-premises
- Cloud
By Organization Size:
- Small and Medium-sized Enterprises
- Large Enterprises
By Industry:
- Process Manufacturing
- Discrete Manufacturing
By Process Manufacturing:
- Oil and Gas
- Chemical
- Pharmaceutical and Life Sciences
- Energy and Power
- Water and Wastewater Management
- Food and Beverage
By Discrete Manufacturing:
- Automotive
- Aerospace and Defense
- Medical Devices
- Electronics and Semiconductors
By Region:
- North America
- Europe
- APAC
- MEA
- Latin America
Available Customizations
With the given market data, MarketsandMarkets offers customizations as per the company�s specific needs. The following customization options are available for the report:
Geographic Analysis
- Further breakup of the North American market into the US and Canada
- Further breakup of the European market into the UK, Germany, and France
Company Information
- Detailed analysis and profiling of additional production monitoring market players
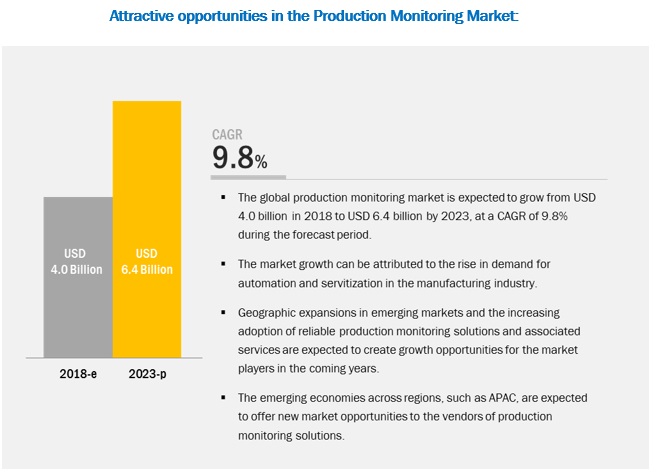
The global production monitoring market size is expected to grow from USD 4.0 billion in 2018 to USD 6.4 billion by 2023, at a Compound Annual Growth Rate (CAGR) of 9.8% during the forecast period. The rising demand for industrial automation in the manufacturing industry is a major factor driving the growth of the market.
By application area, the business process optimization segment is expected to be the largest contributor in the production monitoring market during the forecast period
Business process optimization is a management approach that helps construct new processes and develop new resources to make an organization as effective as possible. This approach encourages organizational leaders to get back to basics and get rid of processes that are not working anymore. It creates an environment of ongoing monitoring, analysis, and adjustments when necessary. The production monitoring solutions based on platforms, such as Machine Learning (ML), IoT, and big data, are helping manufacturing organizations in achieving their short-term and long-term goals. These solutions enable manufacturing organizations to reduce the number of costly errors and achieve a vastly improved result by implementing a well-designed set of business process management solutions.
Integration and deployment accounts for the largest market size during forecast period.
Integration and deployment services is expected to account for the larger market size during the forecast period. These services are the basic and the most important aspect of implementing production monitoring solutions, as they optimize production management, asset monitoring, and maintenance. Deployment services involve the identification of business functions, analysis of operational risks, and development of management plans and policies to improve the operational efficiency of a production process and the performance of assets. The production monitoring vendors assist enterprises in gaining a high Return on Investment (RoI) on their investments by offering multiple application integration based on different platforms and by analyzing the centralized data of manufacturing operations.
North America is expected to account for the largest market size during the forecast period
North America is expected to be the largest contributor to the production monitoring market in terms of market size, as it is a technologically advanced region. North American countries have developed infrastructure and skilled workforce, which help production monitoring solution providers offer 24/7 support and maintenance to their clients. This factor assures manufacturers to rely on production monitoring solutions and focus on increasing their operational revenues. The advent of SMEs and adoption of digitalization in manufacturing are expected to drive the growth of the market in North America. Due to the early adoption of trending technologies, such as IoT, big data, DevOps, and mobility, manufacturers are keen to adopt new advanced technologies for their production process.
Key Market Players
The major vendors in the production monitoring market are Capgemini (France), Infosys (India), Oracle (US), Hitachi (Japan), Siemens (Germany), Verizon (US), Emerson (US), Rockwell Automation (US), AspenTech (US), Schlumberger (US), IQMS (US), sedApta (France), Softweb Solutions (US), ORDINAL Software (France), Infinity QS (US), TESAR (Italy), PCE Instruments (Germany), LineView (England), Monnit (US), Coesia (Italy), RT Engineering (US), Cannon Automata (Italy), Intouch Monitoring (England), PetroDAQ (US), and Vertech (France).
Recent Developments:
- In May 2018, Rockwell Automation launched Predictive Maintenance-as-a-Service (PMaaS). The service, which is applied on critical assets identified by the customer, analyzes data from connected technologies, such as sensors, control systems, and smart machines, and can identify normal operations and build out data models to help predict, monitor, and mitigate future failures or issues as part of the preventive maintenance strategy.
- In April 2018, Hitachi Power Solutions launched a knowledge-based analytics solution for prescriptive maintenance. This enables production managers to develop and speed up operations on assets and equipment maintenance.
- In March 2017, Schlumberger announced a new service Lift IQ, a production life cycle management service. Lift IQ offers monitoring, diagnostics, and optimization of artificial lift systems in real time.
Key Questions addressed by the report:
- Where will all these developments take the industry in the mid to long term?
- What are the upcoming industry applications for the production monitoring market?
- Which are the major factors expected to drive the market in near future?
- Which region would offer a higher growth for the vendors in the market?
- Which application area would see the largest market share in the market?
Table of Contents
1 Introduction (Page No. - 20)
1.1 Objectives of the Study
1.2 Market Definition
1.3 Market Segmentation
1.4 Years Considered for the Study
1.5 Currency Considered
1.6 Stakeholders
2 Research Methodology (Page No. - 23)
2.1 Research Data
2.1.1 Secondary Data
2.1.2 Primary Data
2.1.2.1 Breakup of Primaries
2.1.2.2 Key Industry Insights
2.2 Market Size Estimation
2.2.1 Bottom-Up Approach
2.2.2 Top-Down Approach
2.3 Assumptions for the Study
2.4 Limitations of the Study
3 Executive Summary (Page No. - 30)
4 Premium Insights (Page No. - 34)
4.1 Attractive Opportunities in the Production Monitoring Market
4.2 Market Top 3 Process Manufacturing Industries and Regions
4.3 Market By Region
4.4 Market Investment Scenario
5 Market Overview (Page No. - 37)
5.1 Introduction
5.2 Market Dynamics
5.2.1 Drivers
5.2.1.1 Rising Demand for Industrial Automation in the Manufacturing Industry
5.2.1.2 Servitization in Manufacturing
5.2.1.3 Need for Centralized Monitoring and Predictive Maintenance of Assets
5.2.1.4 Rise of Industry 4.0
5.2.2 Restraints
5.2.2.1 Data Security Concerns and Privacy Issues
5.2.3 Opportunities
5.2.3.1 Increasing Adoption of Cloud-Based Solutions
5.2.4 Challenges
5.2.4.1 Lack of Skills and Expertise
6 Production Monitoring Market, By Component (Page No. - 41)
6.1 Introduction
6.2 Solutions
6.2.1 Asia Pacific to Witness the Highest Growth Rate in the Solutions Segment
6.3 Services
6.3.1 North America to Witness the Largest Market Size in the Services Segment
7 Market By Solution (Page No. - 45)
7.1 Introduction
7.2 Asset Management
7.2.1 Critical Need for Asset Performance to Lead the Growth of Asset Management Solutions in the Production Monitoring Market
7.3 Data Management
7.3.1 Need for Predictive Analysis in the Manufacturing Industry to Drive the Growth of Data Management Solutions
7.4 Smart Surveillance and Security
7.4.1 Use of Technology in the Manufacturing Industry and Data Security Concerns are the Factors Driving the Growth of Smart Surveillance and Security Solutions
7.5 Mobile Workforce Management
7.5.1 Rise in Servitization in the Manufacturing Industry Fueling the Growth of Mobile Workforce Management Solutions
8 Production Monitoring Market, By Service (Page No. - 52)
8.1 Introduction
8.2 Professional Services
8.2.1 Asia Pacific to Witness the Highest Growth Rate in the Professional Services Segment Due to the Rising Adoption of Technology Solutions
8.3 Managed Services
8.3.1 Increased Monitoring and Security Requirements, and Improved Compliance Driving the Growth of the Managed Services Segment
9 Market By Professional Service (Page No. - 56)
9.1 Introduction
9.2 Integration and Deployment
9.2.1 Need for Optimized Production Management and Asset Monitoring Fueling the Growth of Integration and Deployment Services
9.3 Consulting
9.3.1 Increasing Awareness of Compliance Requirements in the Manufacturing Industry Driving the Growth of Consulting Services
9.4 Support and Maintenance
9.4.1 Increasing Dependency on Automation and Use of Smart Equipment in the Manufacturing Industry Driving the Growth of Support and Maintenance Services
9.5 Education and Training
9.5.1 Increasing Complexity of Threats and Data Loss Generating the Need for Education and Training Services
10 Production Monitoring Market, By Managed Service (Page No. - 62)
10.1 Introduction
10.2 Infrastructure Management
10.2.1 Advancement of IT Infrastructure in the Manufacturing Industry Driving the Growth of Infrastructure Management Services
10.3 Security Management
10.3.1 Critical Need of Protecting Customer Data Increasing the Demand for Security Management Services
11 Market By Application Area (Page No. - 66)
11.1 Introduction
11.2 Business Process Optimization
11.2.1 Increasing Focus on Productivity and Efficiency Driving the Growth of Production Monitoring Solutions in the Business Process Optimization Segment
11.3 Logistics and Supply Chain Management
11.3.1 Focus on Reducing the Supply Chain and Inventory Complexities Increasing the Demand for Production Monitoring Solutions in the Logistics and Supply Chain Management Segment
11.4 Automation and Control Management
11.4.1 Asset Condition Monitoring Solutions Help Reduce the Downtime in the Automation and Control Management Segment
11.5 Emergency and Incident Management
11.5.1 Predictive Maintenance and Smart Security Help Enterprises in Achieving Better Efficiency in the Emergency and Incident Management Segment
12 Production Monitoring Market, By Deployment Type (Page No. - 72)
12.1 Introduction
12.2 On-Premises
12.2.1 Advanced IT Infrastructure Driving the Growth of On-Premises Solutions in North America
12.3 Cloud
12.3.1 Reduced IT Infrastructure Cost Leading to the Growth of Cloud Solutions in the Market
13 Market By Organization Size (Page No. - 76)
13.1 Introduction
13.2 Small and Medium-Sized Enterprises
13.2.1 Focus on Niche Areas of the Manufacturing Industry Leading to the Growth of Small and Medium-Sized Enterprises
13.3 Large Enterprises
13.3.1 Availability of Infrastructure and Resources Driving Large Enterprises to Adopt Production Monitoring Solutions
14 Production Monitoring Market, By Industry (Page No. - 81)
14.1 Introduction
14.2 Process Manufacturing
14.2.1 Focus on High Volume and High Efficiency Driving the Growth of Production Monitoring Solutions in the Process Manufacturing Industry
14.3 Discrete Manufacturing
14.3.1 Focus on Reducing the Asset Performance and Downtime Increasing the Demand for Production Monitoring Solutions in the Discrete Manufacturing Industry
15 Market By Process Manufacturing Industry (Page No. - 85)
15.1 Introduction
15.2 Oil and Gas
15.2.1 Need for Real-Time Monitoring and Predictive Maintenance in the Oil and Gas Vertical Driving the Growth of Production Monitoring Solutions
15.3 Chemical
15.3.1 Need for Operational Efficiency Increasing the Demand for Production Monitoring Solutions in the Chemical Vertical
15.4 Pharmaceutical and Life Sciences
15.4.1 Need for Maintaining High-Quality Products Leading to the Growth of Production Monitoring Solutions in the Pharmaceutical and Life Sciences Vertical
15.5 Energy and Power
15.5.1 Increasing Adoption of Smart Meters and Grids Driving the Growth of Production Monitoring Solutions in the Energy and Power Vertical
15.6 Water and Wastewater Management
15.6.1 Critical Need for Advanced Processes Increasing the Demand for Production Monitoring Solutions and Services in the Water and Wastewater Management Vertical
15.7 Food and Beverage
15.7.1 Rise in Production of Foods and Beverages Increasing the Demand for Production Monitoring Solutions
16 Production Monitoring Market, By Discrete Manufacturing Industry (Page No. - 93)
16.1 Introduction
16.2 Automotive
16.2.1 High Level of Assembly and Focus on Reducing Process Inefficiencies Driving the Growth of Production Monitoring Solutions in the Automotive Vertical
16.3 Aerospace and Defense
16.3.1 Demand for Quality and Growing Complexities in the Supply Chain Driving the Growth of Production Monitoring Solutions in the Aerospace and Defense Vertical
16.4 Medical Devices
16.4.1 Need of Reducing Error Patterns in Medical Devices Increasing the Demand for Production Monitoring Solutions in the Medical Devices Vertical
16.5 Electronics and Semiconductors
16.5.1 Focus on Increasing Operational Efficiency Driving the Growth of Production Monitoring Solutions in the Electronics and Semiconductors Vertical
17 Production Monitoring Market, By Region (Page No. - 99)
17.1 Introduction
17.2 North America
17.2.1 Early Adoption of Technologies and High Focus on Innovation Leading to the Growth of Production Monitoring Solutions in North America
17.3 Europe
17.3.1 The Growing Need of Virtualized Environment, Analytics, Security, and Digitization in the Manufacturing Industry Leading to the Growth of Production Monitoring Solutions in Europe
17.4 Asia Pacific
17.4.1 Rising Adoption of New Technologies in the Manufacturing Industry and Aggressive Initiatives to Increase the IT Infrastructure Leading to the Growth of Production Monitoring Solutions in Asia Pacific
17.5 Middle East and Africa
17.5.1 Increasing Adoption of Digitization in the Manufacturing Industry Fueling the Growth of Production Monitoring Solutions in Middle East and Africa
17.6 Latin America
17.6.1 Increasing Use of Big Data Technologies in the Manufacturing Industry to Drive the Growth of Production Monitoring Solutions in Latin America
18 Competitive Landscape (Page No. - 128)
18.1 Overview
18.2 Market Ranking
18.3 Competitive Scenario
18.3.1 New Product Launches and Enhancements
18.3.2 Partnerships, Collaborations, and Agreements
18.3.3 Mergers and Acquisitions
19 Company Profiles (Page No. - 133)
(Business Overview, Solutions Offered, Recent Developments, SWOT Analysis, MnM View.)*
19.1 Capgemini
19.2 Infosys
19.3 Oracle
19.4 Hitachi
19.5 Siemens
19.6 Verizon
19.7 Emerson
19.8 Rockwell Automation
19.9 Aspen Technology
19.10 Schlumberger
19.11 IQMS
19.12 Sedapta
19.13 Softweb Solutions
19.14 Ordinal Software
19.15 Infinity Qs
19.16 Tesar
19.17 PCE Instruments
19.18 Lineview
19.19 Monnit
19.20 Coesia
19.21 RT Engineering
19.22 Cannon Automata
19.23 Intouch Monitoring
19.24 Petrodaq
19.25 Vertech
* Business Overview, Solutions Offered, Recent Developments, SWOT Analysis, MnM View Might Not Be Captured in Case of Unlisted Companies.
20 Appendix (Page No. - 179)
20.1 Discussion Guide
20.2 Knowledge Store: Marketsandmarkets� Subscription Portal
20.3 Available Customizations
20.4 Related Reports
20.5 Author Details
List of Tables (105 Tables)
Table 1 Production Monitoring Market Size and Growth Rate, 2016�2023 (USD Million, Y-O-Y %)
Table 2 Market Size By Component, 2016�2023 (USD Million)
Table 3 Solutions: Market Size By Region, 2016�2023 (USD Million)
Table 4 Services: Market Size By Region, 2016�2023 (USD Million)
Table 5 Production Monitoring Market Size, By Solution, 2016�2023 (USD Million)
Table 6 Asset Management: Market Size By Region, 2016�2023 (USD Million)
Table 7 Data Management: Market Size By Region, 2016�2023 (USD Million)
Table 8 Smart Surveillance and Security: Market Size By Region, 2016�2023 (USD Million)
Table 9 Mobile Workforce Management: Market Size By Region, 2016�2023 (USD Million)
Table 10 Production Monitoring Market Size, By Service, 2016�2023 (USD Million)
Table 11 Professional Services: Market Size By Region, 2016�2023 (USD Million)
Table 12 Managed Services: Market Size By Region, 2016�2023 (USD Million)
Table 13 Market Size By Professional Service, 2016�2023 (USD Million)
Table 14 Integration and Deployment: Market Size By Region, 2016�2023 (USD Million)
Table 15 Consulting: Production Monitoring Market Size, By Region, 2016�2023 (USD Million)
Table 16 Support and Maintenance: Market Size By Region, 2016�2023 (USD Million)
Table 17 Education and Training: Market Size By Region, 2016�2023 (USD Million)
Table 18 Market Size By Managed Service, 2016�2023 (USD Million)
Table 19 Infrastructure Management: Market Size By Region, 2016�2023 (USD Million)
Table 20 Security Management: Market Size By Region, 2016�2023 (USD Million)
Table 21 Market Size By Application Area, 2016�2023 (USD Million)
Table 22 Business Process Optimization: Market Size By Region, 2016�2023 (USD Million)
Table 23 Logistics and Supply Chain Management: Market Size By Region, 2016�2023 (USD Million)
Table 24 Automation and Control Management: Market Size By Region, 2016�2023 (USD Million)
Table 25 Emergency and Incident Management: Market Size By Region, 2016�2023 (USD Million)
Table 26 Production Monitoring Market Size, By Deployment Type, 2016�2023 (USD Million)
Table 27 On-Premises: Market Size By Region, 2016�2023 (USD Million)
Table 28 Cloud: Market Size By Region, 2016�2023 (USD Million)
Table 29 Market Size By Organization Size, 2016�2023 (USD Million)
Table 30 Small and Medium-Sized Enterprises: Market Size By Region, 2016�2023 (USD Million)
Table 31 Large Enterprises: Market Size By Region, 2016�2023 (USD Million)
Table 32 Market Size By Industry, 2016�2023 (USD Million)
Table 33 Process Manufacturing: Market Size By Region, 2016�2023 (USD Million)
Table 34 Discrete Manufacturing: Market Size By Region, 2016�2023 (USD Million)
Table 35 Production Monitoring Market Size, By Process Manufacturing Industry, 2016�2023 (USD Million)
Table 36 Oil and Gas: Market Size By Region, 2016�2023 (USD Million)
Table 37 Chemical: Market Size By Region, 2016�2023 (USD Million)
Table 38 Pharmaceutical and Life Sciences: Market Size By Region, 2016�2023 (USD Million)
Table 39 Energy and Power: Market Size By Region, 2016�2023 (USD Million)
Table 40 Water and Wastewater Management: Market Size By Region, 2016�2023 (USD Million)
Table 41 Food and Beverage: Market Size By Region, 2016-2023 (USD Million)
Table 42 Market Size By Discrete Manufacturing Industry, 2016�2023 (USD Million)
Table 43 Automotive: Market Size By Region, 2016�2023 (USD Million)
Table 44 Aerospace and Defense: Market Size By Region, 2016�2023 (USD Million)
Table 45 Medical Devices: Market Size By Region, 2016�2023 (USD Million)
Table 46 Electronics and Semiconductors: Market Size By Region, 2016�2023 (USD Million)
Table 47 Production Monitoring Market Size, By Region, 2016�2023 (USD Million)
Table 48 North America: Market Size By Component, 2016�2023 (USD Million)
Table 49 North America: Market Size By Solution, 2016�2023 (USD Million)
Table 50 North America: Market Size By Service, 2016�2023 (USD Million)
Table 51 North America: Market Size By Professional Service, 2016�2023 (USD Million)
Table 52 North America: Market Size By Managed Service, 2016�2023 (USD Million)
Table 53 North America: Market Size By Application Area, 2016�2023 (USD Million)
Table 54 North America: Market Size By Deployment Type, 2016�2023 (USD Million)
Table 55 North America: Market Size By Organization Size, 2016�2023 (USD Million)
Table 56 North America: Market Size By Industry, 2016�2023 (USD Million)
Table 57 North America: Market Size By Process Manufacturing Industry, 2016�2023 (USD Million)
Table 58 North America: Market Size By Discrete Manufacturing Industry, 2016�2023 (USD Million)
Table 59 Europe: Production Monitoring Market Size, By Component, 2016�2023 (USD Million)
Table 60 Europe: Market Size By Solution, 2016�2023 (USD Million)
Table 61 Europe: Market Size By Service, 2016�2023 (USD Million)
Table 62 Europe: Market Size By Professional Service, 2016�2023 (USD Million)
Table 63 Europe: Market Size By Managed Service, 2016�2023 (USD Million)
Table 64 Europe: Market Size By Application Area, 2016�2023 (USD Million)
Table 65 Europe: Market Size By Deployment Type, 2016�2023 (USD Million)
Table 66 Europe: Market Size By Organization Size, 2016�2023 (USD Million)
Table 67 Europe: Market Size By Industry, 2016�2023 (USD Million)
Table 68 Europe: Market Size By Process Manufacturing Industry, 2016�2023 (USD Million)
Table 69 Europe: Market Size By Discrete Manufacturing Industry, 2016�2023 (USD Million)
Table 70 Asia Pacific: Production Monitoring Market Size, By Component, 2016�2023 (USD Million)
Table 71 Asia Pacific: Market Size By Solution, 2016�2023 (USD Million)
Table 72 Asia Pacific: Market Size By Service, 2016�2023 (USD Million)
Table 73 Asia Pacific: Market Size By Professional Service, 2016�2023 (USD Million)
Table 74 Asia Pacific: Market Size By Managed Service, 2016�2023 (USD Million)
Table 75 Asia Pacific: Market Size By Application Area, 2016�2023 (USD Million)
Table 76 Asia Pacific: Market Size By Deployment Type, 2016�2023 (USD Million)
Table 77 Asia Pacific: Market Size By Organization Size, 2016�2023 (USD Million)
Table 78 Asia Pacific: Market Size By Industry, 2016�2023 (USD Million)
Table 79 Asia Pacific: Market Size By Process Manufacturing Industry, 2016�2023 (USD Million)
Table 80 Asia Pacific: Market Size By Discrete Manufacturing Industry, 2016�2023 (USD Million)
Table 81 Middle East and Africa: Production Monitoring Market Size, By Component, 2016�2023 (USD Million)
Table 82 Middle East and Africa: Market Size By Solution, 2016�2023 (USD Million)
Table 83 Middle East and Africa: Market Size By Service, 2016�2023 (USD Million)
Table 84 Middle East and Africa: Market Size By Professional Service, 2016�2023 (USD Million)
Table 85 Middle East and Africa: Market Size By Managed Service, 2016�2023 (USD Million)
Table 86 Middle East and Africa: Market Size By Application Area, 2016�2023 (USD Million)
Table 87 Middle East and Africa: Market Size By Deployment Type, 2016�2023 (USD Million)
Table 88 Middle East and Africa: Market Size By Organization Size, 2016�2023 (USD Million)
Table 89 Middle East and Africa: Market Size By Industry, 2016�2023 (USD Million)
Table 90 Middle East and Africa: Market Size By Process Manufacturing Industry, 2016�2023 (USD Million)
Table 91 Middle East and Africa: Market Size By Discrete Manufacturing Industry, 2016�2023 (USD Million)
Table 92 Latin America: Production Monitoring Market Size, By Component, 2016�2023 (USD Million)
Table 93 Latin America: Market Size By Solution, 2016�2023 (USD Million)
Table 94 Latin America: Market Size By Service, 2016�2023 (USD Million)
Table 95 Latin America: Market Size By Professional Service, 2016�2023 (USD Million)
Table 96 Latin America: Market Size By Managed Service, 2016�2023 (USD Million)
Table 97 Latin America: Market Size By Application Area, 2016�2023 (USD Million)
Table 98 Latin America: Market Size By Deployment Type, 2016�2023 (USD Million)
Table 99 Latin America: Market Size By Organization Size, 2016�2023 (USD Million)
Table 100 Latin America: Market Size By Industry, 2016�2023 (USD Million)
Table 101 Latin America: Market Size By Process Manufacturing Industry, 2016�2023 (USD Million)
Table 102 Latin America: Market Size By Discrete Manufacturing Industry, 2016�2023 (USD Million)
Table 103 New Product Launches and Enhancements, 2017�2018
Table 104 Partnerships, Collaborations, and Agreements, 2017�2018
Table 105 Mergers and Acquisitions, 2017
List of Figures (47 Figures)
Figure 1 Production Monitoring Market: Research Design
Figure 2 Market Breakdown and Data Triangulation
Figure 3 Market Bottom-Up Approach
Figure 4 Market Top-Down Approach
Figure 5 Market Top 3 Segments, 2018
Figure 6 Market By Deployment Type, 2018
Figure 7 Increasing Demand of Automation and Servitization in the Manufacturing Industry are Expected to Drive the Production Monitoring Market Growth
Figure 8 Oil and Gas Vertical and North America are Estimated to Hold the Highest Market Shares in 2018
Figure 9 Asia Pacific is Expected to Grow at the Highest CAGR During the Forecast Period
Figure 10 Asia Pacific is Expected to Emerge as the Best Market for Investments During the Next 5 Years
Figure 11 Drivers, Restraints, Opportunities, and Challenges: Production Monitoring Market
Figure 12 Solutions Segment is Expected to Account for A Larger Market Size During the Forecast Period
Figure 13 Services Segment in North America is Expected to Account for the Largest Market Size During the Forecast Period
Figure 14 Asset Management Segment is Expected to Account for the Largest Market Size During the Forecast Period
Figure 15 Asset Management Segment in North America is Expected to Account for the Largest Market Size During the Forecast Period
Figure 16 Data Management Segment in North America is Expected to Account for the Largest Market Size During the Forecast Period
Figure 17 Professional Services Segment is Expected to Account for A Larger Market Size During the Forecast Period
Figure 18 Integration and Deployment Segment is Expected to Account for the Largest Market Size During the Forecast Period
Figure 19 Infrastructure Management Segment is Expected to Account for A Larger Market Size During the Forecast Period
Figure 20 Business Process Optimization Segment is Expected to Account for the Largest Market Size During the Forecast Period
Figure 21 On-Premises Deployment Type is Expected to Account for A Larger Market Size During the Forecast Period
Figure 22 Large Enterprises Segment is Expected to Account for A Larger Market Size During the Forecast Period
Figure 23 Large Enterprises Segment is Expected to Dominate the Asia Pacific Region During the Forecast Period
Figure 24 Discrete Manufacturing Industry is Expected to Account for A Larger Market Size During the Forecast Period
Figure 25 Oil and Gas Vertical is Expected to Account for the Largest Market Size During the Forecast Period
Figure 26 Automotive Vertical is Expected to Account for the Largest Market Size During the Forecast Period
Figure 27 Asia Pacific is Expected to Grow at the Highest CAGR During the Forecast Period
Figure 28 North America: Market Snapshot
Figure 29 Solutions Segment is Expected to Account for A Larger Market Size During the Forecast Period
Figure 30 Asia Pacific: Market Snapshot
Figure 31 Key Developments By the Leading Players in the Production Monitoring Market During 2017�2018
Figure 32 Schlumberger Led the Production Monitoring Market in 2017-2018
Figure 33 Capgemini: Company Snapshot
Figure 34 Capgemini: SWOT Analysis
Figure 35 Infosys: Company Snapshot
Figure 36 Infosys: SWOT Analysis
Figure 37 Oracle: Company Snapshot
Figure 38 Oracle: SWOT Analysis
Figure 39 Hitachi: Company Snapshot
Figure 40 Hitachi: SWOT Analysis
Figure 41 Siemens: Company Snapshot
Figure 42 Siemens: SWOT Analysis
Figure 43 Verizon: Company Snapshot
Figure 44 Emerson: Company Snapshot
Figure 45 Rockwell Automation: Company Snapshot
Figure 46 Aspen Technology: Company Snapshot
Figure 47 Schlumberger: Company Snapshot


Growth opportunities and latent adjacency in Production Monitoring Market