Push-to-talk Market

Push-to-talk Market by Offering (Hardware, Solutions, and Services), Network Type (LMR and Cellular), Vertical (Government & Public Safety, Aerospace & Defense, and Transportation & Logistics) and Region - Global Forecast to 2028

Report Code: TC 7493 Sep, 2023, by marketsandmarkets.com

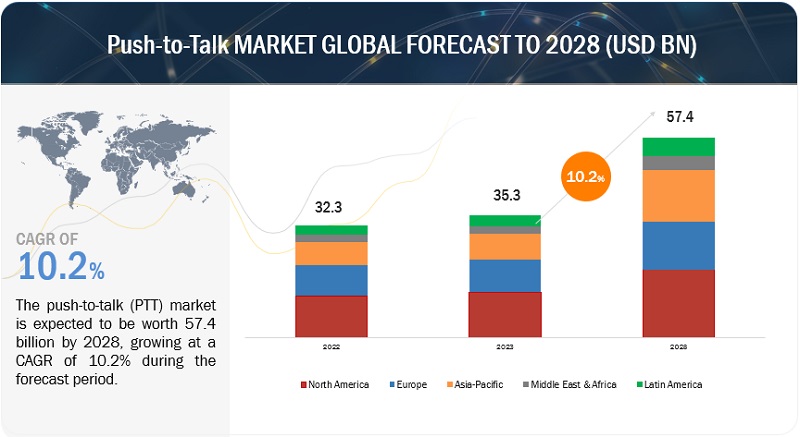
[251 Pages Report] The push-to-talk (PTT) market is estimated at USD 35.3 billion in 2023 to USD 57.4 billion by 2028, at a Compound Annual Growth Rate (CAGR) of 10.2%. The availability of PTT applications on a wide range of consumer devices, including smartphones and tablets, has significantly contributed to their accessibility and popularity among a broad user base. This accessibility stems from the versatility and compatibility of PTT apps, allowing users to communicate seamlessly across different platforms and operating systems, which is driving the PTT market.
Push-to-talk Market

To speak to our analyst for a discussion on the above findings, click Speak to Analyst
Push-to-talk Market

To know about the assumptions considered for the study, download the pdf brochure

Push-to-Talk Market Dynamics

Driver: Proliferation of rugged and ultra-rugged smartphones

The proliferation of rugged and ultra-rugged smartphones is driven by the increasing need for durable, reliable, and resilient mobile devices in various industries and outdoor activities. The integration of PTT functionality further enhances their value, making them essential tools for professionals and adventurers operating in challenging environments. As technology continues to advance, it is expected that these devices to evolve further, offering even more features and capabilities to meet the demands of their diverse user base.

Restraint: Dependence on a stable network connection

PTT technology, whether in the form of dedicated PTT devices or mobile apps, relies on a continuous network connection to enable instant communication. When a user presses the PTT button, their voice is transmitted over the network to the recipients, emulating the functionality of a traditional two-way radio. The restraint here lies in the dependence on a stable network connection. If a user is in an area with weak or no network coverage, such as remote wilderness locations, underground tunnels, or areas with heavy network congestion, PTT communication can suffer from latency, dropouts, or complete failure. This limitation is particularly critical in emergency situations, where immediate and reliable communication is essential.

Opportunity: Standardization of infrastructure platforms

The standardization of infrastructure platforms presents significant opportunities for various industries and organizations. Standardizing infrastructure platforms for PTT opens up opportunities for seamless interoperability. This means that PTT devices and systems from different manufacturers can work together effortlessly. Organizations can choose the best PTT hardware and software solutions for their needs without worrying about compatibility issues. This interoperability is particularly advantageous in industries like public safety and emergency response, where various agencies and departments need to coordinate communication during critical situations.

Challenge: LMR and PTT interoperability issues

The interoperability challenges between Land Mobile Radio (LMR) systems and Push-to-Talk (PTT) solutions can pose significant hurdles in the seamless communication landscape, especially in sectors where instant and reliable communication is paramount. LMR systems, including analog and digital variants like TETRA or P25, have been widely used by public safety agencies and other critical infrastructure sectors for many years. These systems often operate on proprietary or specialized technologies. In contrast, modern PTT solutions are predominantly software-based and utilize internet protocol (IP) networks. Bridging the gap between these diverse technologies is a significant challenge, as LMR systems are not inherently designed to integrate with IP-based PTT systems.

Push-to-Talk Market Ecosystem

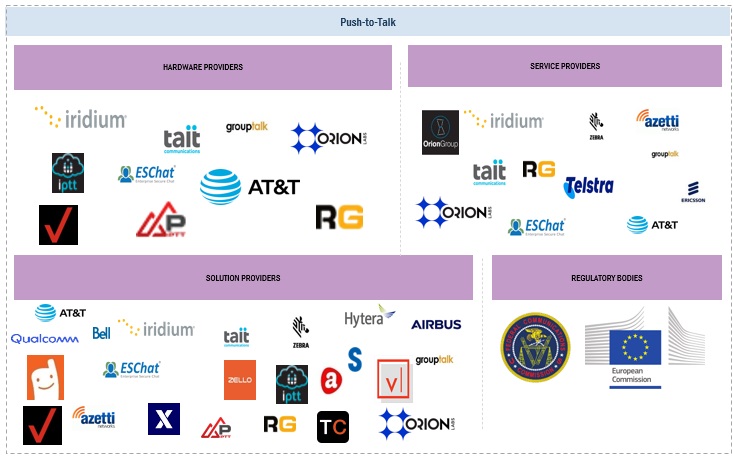
Prominent companies in this market include well-established, financially stable PTT hardware, solutions, services providers, and regulatory bodies. These companies have been operating in the market for several years and possess a diversified product portfolio and state-of-the-art technologies. Prominent companies in this market include AT&T Inc. (US); Verizon Wireless (US); Motorola Solutions, Inc. (US); T-Mobile (US); Qualcomm Incorporated (US); Zebra Technologies Corporation (US); Telstra Group Limited (Australia); Hytera Communications Corporation Limited (China); Telefonaktiebolaget LM Ericsson (Sweden); Bell Canada (Canada); Iridium Communications Inc. (US); Tait Communications (New Zealand); Airbus SE (Netherlands); L3Harris Technologies, Inc. (US); ServiceMax, a PTC Technology (US); Simoco Wireless Solutions (UK); GroupTalk (Sweden); Orion Labs, Inc. (US); Zello Inc. (US); Procore Technologies, Inc. (US); VoxerNet LLC (US); International Push to Talk Ltd (England); Enterprise Secure Chat (US); AINA Wireless (US); Azetti Networks (Spain); PeakPTT (US); RugGear (China); ProMobi Technologies (India); and TeamConnect (US)
Push-to-talk Market

By network type, land mobile radio segment to hold the largest market size during the forecast period

Land mobile radio (LMR) PTT systems offer rugged hardware designed for durability in harsh environments, and they operate on dedicated radio frequencies, providing robust coverage and ensuring that critical messages reach their intended recipients. While newer technologies like cellular PTT have emerged, LMR PTT remains a vital tool for mission-critical communications in industries where reliability and resilience are paramount.

Bu service, the support & maintenance service segment is expected to register the fastest growth rate during the forecast period.

The PTT technology support & maintenance service segment plays a crucial role in ensuring the uninterrupted functionality of PTT communication systems. This service encompasses a range of activities aimed at keeping PTT devices and networks operational. It includes regular software updates, firmware upgrades, troubleshooting, and hardware repairs. Additionally, PTT technology support & maintenance services offer proactive monitoring to detect and address potential issues before they disrupt communication. This segment is vital for industries such as public safety, transportation, and logistics, where instant and reliable communication is essential for day-to-day operations.

North America is expected to hold the largest market size during the forecast period

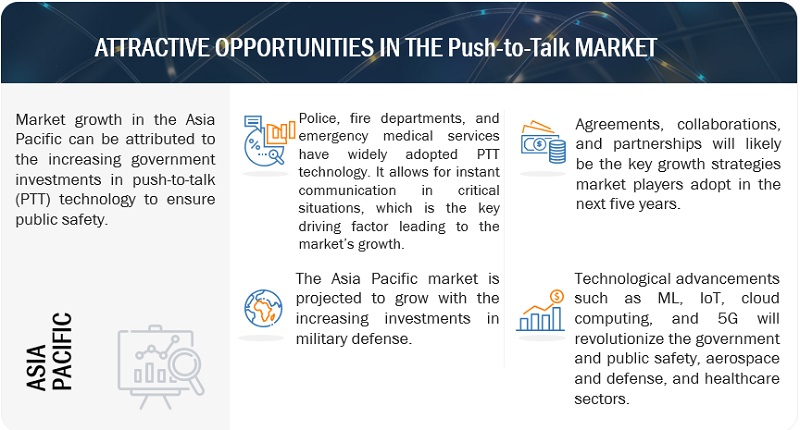
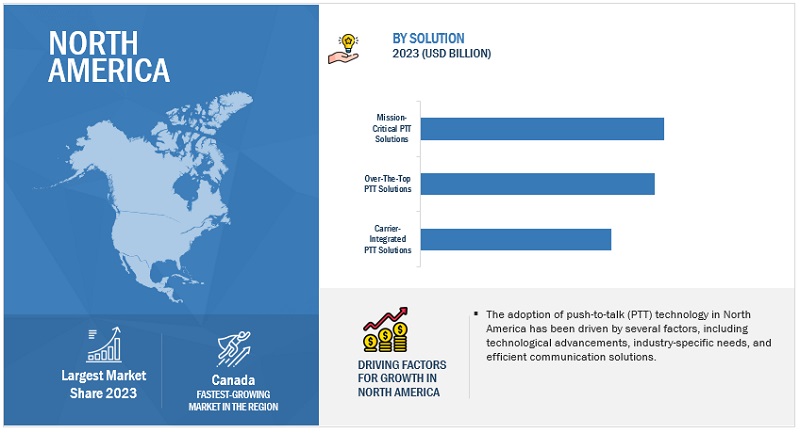
North America is expected to dominate the PTT market during the forecast period. Commercially, PTT technology has been integrated into the daily operations of businesses across North America. The ability to improve communication, streamline tasks, and enhance coordination among mobile workforces led to its widespread adoption. Companies in fields such as logistics, construction, and healthcare found value in PTT solutions.
Push-to-talk Market Size, and Share

Market Players:

The major players in the PTT market are AT&T Inc. (US); Verizon Wireless (US); Motorola Solutions, Inc. (US); T-Mobile (US); Qualcomm Incorporated (US); Zebra Technologies Corporation (US); Telstra Group Limited (Australia); Hytera Communications Corporation Limited (China); Telefonaktiebolaget LM Ericsson (Sweden); Bell Canada (Canada); Iridium Communications Inc. (US); Tait Communications (New Zealand); Airbus SE (Netherlands); L3Harris Technologies, Inc. (US); ServiceMax, a PTC Technology (US); Simoco Wireless Solutions (UK); GroupTalk (Sweden); Orion Labs, Inc. (US); Zello Inc. (US); Procore Technologies, Inc. (US); VoxerNet LLC (US); International Push to Talk Ltd (England); Enterprise Secure Chat (US); AINA Wireless (US); Azetti Networks (Spain); PeakPTT (US); RugGear (China); ProMobi Technologies (India); and TeamConnect (US). These players have adopted various growth strategies, such as partnerships, agreements and collaborations, new product launches and enhancements, and acquisitions to expand their footprint in the PTT market.

Get online access to the report on the World's First Market Intelligence Cloud

  • Easy to Download Historical Data & Forecast Numbers
  • Company Analysis Dashboard for high growth potential opportunities
  • Research Analyst Access for customization & queries
  • Competitor Analysis with Interactive dashboard
  • Latest News, Updates & Trend analysis
Request Sample

Scope of the Report

Report Metrics

Details

Market size available for years

2017-2028

Base year considered

2022

Forecast period

2023–2028

Forecast units

Value (USD) Billion

Segments covered

Offering (Hardware, Solutions, and Services), Network Type, Vertical, and Region

Region covered

North America, Europe, Asia Pacific, Middle East & Africa, and Latin America.

Companies covered

AT&T Inc. (US); Verizon Wireless (US); Motorola Solutions, Inc. (US); T-Mobile (US); Qualcomm Incorporated (US); Zebra Technologies Corporation (US); Telstra Group Limited (Australia); Hytera Communications Corporation Limited (China); Telefonaktiebolaget LM Ericsson (Sweden); Bell Canada (Canada); Iridium Communications Inc. (US); Tait Communications (New Zealand); Airbus SE (Netherlands); L3Harris Technologies, Inc. (US); ServiceMax, a PTC Technology (US); Simoco Wireless Solutions (UK); GroupTalk (Sweden); Orion Labs, Inc. (US); Zello Inc. (US); Procore Technologies, Inc. (US); VoxerNet LLC (US); International Push to Talk Ltd (England); Enterprise Secure Chat (US); AINA Wireless (US); Azetti Networks (Spain); PeakPTT (US); RugGear (China); ProMobi Technologies (India); and TeamConnect (US).

This research report categorizes the PTT market to forecast revenues and analyze trends in each of the following submarkets:

Based on Offering:
  • Hardware
  • Solutions
    • Carrier Integrated Ptt Solution
    • Over The Top Ptt Solution
    • Mission-Critical Ptt Solution
  • Services
    • Consulting
    • Implementation
    • Support & Maintenance
Based on Network Type:
  • Land Mobile Radio
  • Cellular
Based on Vertical:
  • Government & Public Safety
  • Aerospace & Defense
  • Transportation & Logistics
  • Manufacturing
  • Construction & Mining
  • Energy & Utilities
  • Travel & Hospitality
  • Healthcare
  • Other Verticals
By Region:
  • North America
    • United States (US)
    • Canada
  • Europe
    • United Kingdom (UK)
    • Germany
    • France
    • Italy
    • Spain
    • Nordics
    • Rest of Europe
  • Asia Pacific
    • China
    • India
    • Japan
    • Australia & New Zealand
    • Rest of Asia Pacific
  • Middle East
    • KSA
    • UAE
    • Rest of Middle East
  • Africa
  • Latin America
    • Brazil
    • Mexico
    • Rest of Latin America

Recent Developments

  • In May 2023, Qualcomm’s subsidiary, Qualcomm Technologies, Inc., acquired Autotalks. Through the acquisition, the Autotalks standalone safety solutions was expected to be incorporated into Qualcomm Technologies’ expanding Snapdragon Digital Chassis product.
  • In July 2022, Ericsson acquired Vonage, This acquisition was expected to support Ericsson’s strategy to leverage technology leadership to grow its mobile network business and expand into enterprise.
  • In May 2022, Motorola Solutions, in partnership with Arya Communications & Electronics Services and Arya Omnitalk Wireless Solutions, launched WAVE PTX in India.

Frequently Asked Questions (FAQ):

To speak to our analyst for a discussion on the above findings, click Speak to Analyst

TABLE OF CONTENTS
 
1 INTRODUCTION (Page No. - 37)
    1.1 STUDY OBJECTIVES 
    1.2 MARKET DEFINITION 
    1.3 STUDY SCOPE 
           1.3.1 MARKET SEGMENTATION
                    FIGURE 1 PUSH-TO-TALK MARKET: MARKET SEGMENTATION
           1.3.2 REGIONS COVERED
           1.3.3 INCLUSIONS AND EXCLUSIONS
           1.3.4 YEARS CONSIDERED
    1.4 CURRENCY CONSIDERED 
           TABLE 1 USD EXCHANGE RATES, 2020–2022
    1.5 STAKEHOLDERS 
    1.6 IMPACT OF RECESSION 
    1.7 SUMMARY OF CHANGES 
 
2 RESEARCH METHODOLOGY (Page No. - 42)
    2.1 RESEARCH DATA 
           FIGURE 2 PUSH-TO-TALK MARKET: RESEARCH DESIGN
           2.1.1 SECONDARY DATA
                    2.1.1.1 Key data from secondary sources
           2.1.2 PRIMARY DATA
                    2.1.2.1 Primary interviews with experts
                    2.1.2.2 Breakdown of primary profiles
                               FIGURE 3 BREAKDOWN OF PRIMARY INTERVIEWS: BY COMPANY TYPE, DESIGNATION, AND REGION
                    2.1.2.3 Primary sources
                    2.1.2.4 Key insights from industry experts
    2.2 MARKET SIZE ESTIMATION 
           FIGURE 4 MARKET SIZE ESTIMATION METHODOLOGY-APPROACH 1 (SUPPLY SIDE): REVENUE OF OFFERINGS IN PUSH-TO-TALK MARKET
           FIGURE 5 MARKET SIZE ESTIMATION METHODOLOGY: APPROACH 2 (DEMAND SIDE): MARKET
           2.2.1 BOTTOM-UP APPROACH
                    FIGURE 6 BOTTOM-UP APPROACH
                    FIGURE 7 MARKET SIZE ESTIMATION USING BOTTOM-UP APPROACH
           2.2.2 TOP-DOWN APPROACH
                    FIGURE 8 TOP-DOWN APPROACH
    2.3 DATA TRIANGULATION 
           FIGURE 9 MARKET BREAKUP AND DATA TRIANGULATION
    2.4 GROWTH FORECAST ASSUMPTIONS 
           TABLE 2 FACTOR ANALYSIS
    2.5 RESEARCH ASSUMPTIONS 
           TABLE 3 RESEARCH ASSUMPTIONS
    2.6 RISK ASSESSMENT 
           TABLE 4 RISK ASSESSMENT: PUSH-TO-TALK MARKET
    2.7 LIMITATIONS 
    2.8 IMPLICATION OF RECESSION ON MARKET 
 
3 EXECUTIVE SUMMARY (Page No. - 53)
    FIGURE 10 MARKET TO WITNESS SIGNIFICANT GROWTH DURING FORECAST PERIOD 
    FIGURE 11 MARKET: REGIONAL SNAPSHOT 
 
4 PREMIUM INSIGHTS (Page No. - 56)
    4.1 ATTRACTIVE OPPORTUNITIES IN GLOBAL  PUSH-TO-TALK MARKET 
           FIGURE 12 PROLIFERATION OF PUSH-TO-TALK TECHNOLOGY OVER CELLULAR NETWORKS TO DRIVE GLOBAL MARKET
    4.2 MARKET, BY OFFERING, 2023 
           FIGURE 13 HARDWARE SEGMENT TO HOLD LARGEST MARKET SHARE IN MARKET IN 2023
    4.3 MARKET, BY NETWORK TYPE, 2023 
           FIGURE 14 CELLULAR SEGMENT TO WITNESS HIGHER GROWTH RATE IN FORECAST PERIOD
    4.4 MARKET, BY SOLUTION, 2023 
           FIGURE 15 MISSION-CRITICAL PUSH-TO-TALK SOLUTION SEGMENT TO LEAD MARKET IN 2023
    4.5 MARKET, BY VERTICAL, 2023 VS. 2028 
           FIGURE 16 GOVERNMENT & PUBLIC SAFETY SEGMENT TO LEAD MARKET DURING FORECAST PERIOD
    4.6 MARKET IN NORTH AMERICA: SOLUTION AND TOP THREE VERTICALS 
           FIGURE 17 MISSION-CRITICAL PUSH-TO-TALK SOLUTIONS AND GOVERNMENT & PUBLIC SAFETY TO HOLD LARGEST MARKET SHARES IN 2023
 
5 MARKET OVERVIEW AND INDUSTRY TRENDS (Page No. - 59)
    5.1 INTRODUCTION 
    5.2 MARKET DYNAMICS 
           FIGURE 18 DRIVERS, RESTRAINTS, OPPORTUNITIES, AND CHALLENGES:  PUSH-TO-TALK MARKET
           5.2.1 DRIVERS
                    5.2.1.1 Growing demand for PoC
                    5.2.1.2 Proliferation of rugged and ultra-rugged smartphones
                    5.2.1.3 Growing need for driver safety
                    5.2.1.4 Transition of LMR systems from analog to digital
           5.2.2 RESTRAINTS
                    5.2.2.1 Dependence on stable network connection
           5.2.3 OPPORTUNITIES
                    5.2.3.1 High-speed 5G network to enhance push-to-talk-related operations
                    5.2.3.2 Standardization of infrastructure platforms
           5.2.4 CHALLENGES
                    5.2.4.1 LMR and PTT interoperability issues
                    5.2.4.2 High existing investments by public sector to deploy  LMR systems
    5.3 INDUSTRY TRENDS 
           5.3.1 BRIEF HISTORY OF PUSH-TO-TALK TECHNOLOGY
                    FIGURE 19 BRIEF HISTORY OF PUSH-TO-TALK TECHNOLOGY
                    5.3.1.1 1990s
                    5.3.1.2 2000s
                    5.3.1.3 2010s
                    5.3.1.4 2020s
           5.3.2 ECOSYSTEM ANALYSIS
                    FIGURE 20 PUSH-TO-TALK MARKET: ECOSYSTEM
                    TABLE 5 MARKET: ECOSYSTEM
                    5.3.2.1 Solution providers
                    5.3.2.2 Service providers
                    5.3.2.3 Hardware providers
           5.3.3 CASE STUDY ANALYSIS
                    5.3.3.1 Case study 1: Windsor Regional Hospital used Bell Push-to-Talk solution to help its nonclinical teams provide outstanding patient care
                    5.3.3.2 Case study 2: Hydro-Quebec worked with Network Innovations and Tel-Loc to leverage Iridium Push-To-Talk (PTT) solutions for keeping field workers, medical and safety personnel, and operations centers connected throughout development of new utility line
                    5.3.3.3 Case study 3: Orion Labs increased Summit Hospitality Group's operational efficiency across properties with its PTT Voice Services
                    5.3.3.4 Case study 4: Zello’s ZelloWork helped YRC Worldwide improve communications for dispatchers
                    5.3.3.5 Case study 5: Connexus Energy selected Motorola's WAVE to improve workforce communications
           5.3.4 VALUE CHAIN ANALYSIS
                    FIGURE 21 VALUE CHAIN ANALYSIS: PUSH-TO-TALK MARKET
           5.3.5 TARIFF AND REGULATORY LANDSCAPE
                    5.3.5.1 Tariff related to Push-to-Talk devices
                               TABLE 6 TARIFF RELATED TO TELEPHONE SETS WITH CORDLESS HANDSETS
                    5.3.5.2 Regulatory bodies, government agencies, and other organizations
                    TABLE 7 NORTH AMERICA: REGULATORY BODIES, GOVERNMENT AGENCIES, AND OTHER ORGANIZATIONS
                               TABLE 8 EUROPE: REGULATORY BODIES, GOVERNMENT AGENCIES, AND OTHER ORGANIZATIONS
                               TABLE 9 ASIA PACIFIC: REGULATORY BODIES, GOVERNMENT AGENCIES, AND OTHER ORGANIZATIONS
                               TABLE 10 ROW: REGULATORY BODIES, GOVERNMENT AGENCIES, AND OTHER ORGANIZATIONS
                    5.3.5.3 North America
                               5.3.5.3.1 US
                               5.3.5.3.2 Canada
                    5.3.5.4 Europe
                    5.3.5.5 Asia Pacific
                               5.3.5.5.1 China
                               5.3.5.5.2 India
                    5.3.5.6 Middle East & Africa
                               5.3.5.6.1 UAE
                    5.3.5.7 Latin America
                               5.3.5.7.1 Brazil
                               5.3.5.7.2 Mexico
           5.3.6 PORTER’S FIVE FORCES ANALYSIS
                    TABLE 11 PUSH-TO-TALK MARKET: PORTER’S FIVE FORCES MODEL ANALYSIS
                    FIGURE 22 MARKET: PORTER’S FIVE FORCES MODEL
                    5.3.6.1 Threat of new entrants
                    5.3.6.2 Threat of substitutes
                    5.3.6.3 Bargaining power of buyers
                    5.3.6.4 Bargaining power of suppliers
                    5.3.6.5 Intensity of competitive rivalry
           5.3.7 PATENT ANALYSIS
                    5.3.7.1 Methodology
                    5.3.7.2 Document types
                               TABLE 12 PATENTS FILED, JANUARY 2021–AUGUST 2023
                    5.3.7.3 Innovation and patent applications
                               FIGURE 23 NUMBER OF PATENTS GRANTED ANNUALLY, 2021–2023
                               5.3.7.3.1 Top applicants
                               FIGURE 24 TOP 10 PATENT APPLICANTS WITH HIGHEST NUMBER OF PATENT APPLICATIONS, 2021–2023
                               TABLE 13 LIST OF PATENTS IN PUSH-TO-TALK MARKET, 2021–2023
           5.3.8 HS CODE: TELEPHONE SETS (8517)
                    5.3.8.1 Export scenario for HS Code: 8517
                               FIGURE 25 PUSH-TO-TALK TELEPHONE SETS EXPORT, BY KEY COUNTRY,  2015–2022 (USD BILLION)
                    5.3.8.2 Import scenario for HS Code: 8517
                               FIGURE 26 PUSH-TO-TALK TELEPHONE SETS IMPORT, BY KEY COUNTRY,  2015–2022 (USD BILLION)
           5.3.9 TRENDS AND DISRUPTIONS IMPACTING BUYERS’/CLIENTS’ BUSINESSES
           5.3.10 KEY CONFERENCES & EVENTS, 2023–2024
                    TABLE 14 DETAILED LIST OF CONFERENCES & EVENTS, 2023–2024
           5.3.11 PRICING ANALYSIS
                    5.3.11.1 Average selling price trend of key players, by solution and service
                               TABLE 15 AVERAGE SELLING PRICES OF KEY PLAYERS, BY SOLUTION AND SERVICE
                    5.3.11.2 Indicative pricing analysis, by hardware
                               TABLE 16 INDICATIVE PRICING ANALYSIS, BY HARDWARE
           5.3.12 KEY STAKEHOLDERS & BUYING CRITERIA
                    5.3.12.1 Key stakeholders in buying criteria
                               FIGURE 27 INFLUENCE OF STAKEHOLDERS ON BUYING PROCESS FOR TOP THREE END USERS
                               TABLE 17 INFLUENCE OF STAKEHOLDERS ON BUYING PROCESS FOR TOP THREE END USERS
                    5.3.12.2 Buying criteria
                               FIGURE 28 KEY BUYING CRITERIA FOR TOP THREE END USERS
                               TABLE 18 KEY BUYING CRITERIA FOR TOP THREE END USERS
           5.3.13 BEST PRACTICES IN PUSH-TO-TALK MARKET
                    5.3.13.1 Choose appropriate equipment
                    5.3.13.2 Set up group and private channels
                    5.3.13.3 Practice emergency protocols
           5.3.14 CURRENT AND EMERGING BUSINESS MODELS
                    5.3.14.1 Subscription-services model
                    5.3.14.2 Integration-with-other-application model
                    5.3.14.3 Paid add-ons model
           5.3.15 PUSH-TO-TALK FRAMEWORKS AND TECHNIQUES
                    5.3.15.1 Push-to-talk techniques
                               5.3.15.1.1 Single-channel PTT
                               5.3.15.1.2 Multi-channel PTT
                               5.3.15.1.3 Encrypted PTT
                    5.3.15.2 Push-to-talk framework
                               FIGURE 29 ONE-TO-MANY PUSH-TO-TALK OVER CELLULAR GROUP SESSION (VOICE TRANSMISSION) PTT FRAMEWORK
           5.3.16 TECHNOLOGY ANALYSIS
                    5.3.16.1 Key technologies
                               5.3.16.1.1 VoIP
                               5.3.16.1.2 Encryption
                    5.3.16.2 Complementary technologies
                               5.3.16.2.1 Location tracking
                               5.3.16.2.2 Cellular technologies
                    5.3.16.3 Adjacent technologies
                               5.3.16.3.1 Cloud computing
                               5.3.16.3.2 Artificial intelligence and machine learning
                               5.3.16.3.3 Mesh networks
                               5.3.16.3.4 IoT
           5.3.17 FUTURE LANDSCAPE OF PUSH-TO-TALK MARKET
                    5.3.17.1 Push-to-talk technology roadmap to 2030
                               5.3.17.1.1 Short-term roadmap (2023–2025)
                               5.3.17.1.2 Mid-term roadmap (2026–2028)
                               5.3.17.1.3 Long-term roadmap (2029–2030)
           5.3.18 KEY FEATURES OF PUSH-TO-TALK DEVICES
                    5.3.18.1 Multimedia sharing
                    5.3.18.2 Real-time location tracking
                    5.3.18.3 Communication
                    5.3.18.4 Integration
                    5.3.18.5 Alerting & broadcasting
                    5.3.18.6 LMR interoperability
                    5.3.18.7 End-to-end encryption
                    5.3.18.8 Web dispatch
 
6 PUSH-TO-TALK MARKET, BY OFFERING (Page No. - 88)
    6.1 INTRODUCTION 
           FIGURE 30 SOLUTIONS SEGMENT TO GROW AT HIGHER CAGR DURING FORECAST PERIOD
           6.1.1 OFFERING: MARKET DRIVERS
                    TABLE 19 MARKET, BY OFFERING, 2017–2022 (USD MILLION)
                    TABLE 20 MARKET, BY OFFERING, 2023–2028 (USD MILLION)
    6.2 HARDWARE 
           6.2.1 GROWING NUMBER OF END-USE DEVICES TO DRIVE ADOPTION OF PTT HARDWARE
                    TABLE 21 HARDWARE: MARKET, BY REGION, 2017–2022 (USD MILLION)
                    TABLE 22 HARDWARE: MARKET, BY REGION, 2023–2028 (USD MILLION)
    6.3 SOLUTIONS 
           6.3.1 PUSH-TO-TALK SOLUTIONS TO ENABLE RELIABLE COMMUNICATION FOR MISSION-CRITICAL PURPOSES
                    FIGURE 31 OVER-THE-TOP PTT SOLUTIONS SEGMENT TO GROW AT HIGHER CAGR DURING FORECAST PERIOD
                    TABLE 23 PUSH-TO-TALK MARKET, BY SOLUTION, 2017–2022 (USD MILLION)
                    TABLE 24 MARKET, BY SOLUTION, 2023–2028 (USD MILLION)
                    TABLE 25 SOLUTION: MARKET, BY REGION, 2017–2022 (USD MILLION)
                    TABLE 26 SOLUTION: MARKET, BY REGION, 2023–2028 (USD MILLION)
           6.3.2 CARRIER-INTEGRATED PTT SOLUTION
                    TABLE 27 CARRIER-INTEGRATED PTT SOLUTION: MARKET, BY REGION,  2017–2022 (USD MILLION)
                    TABLE 28 CARRIER-INTEGRATED PTT SOLUTION: MARKET, BY REGION,  2023–2028 (USD MILLION)
           6.3.3 OVER-THE-TOP PTT SOLUTION
                    TABLE 29 OVER-THE-TOP PTT SOLUTION: MARKET, BY REGION,  2017–2022 (USD MILLION)
                    TABLE 30 OVER-THE-TOP PTT SOLUTION: MARKET, BY REGION,  2023–2028 (USD MILLION)
           6.3.4 MISSION-CRITICAL PTT SOLUTION
                    TABLE 31 MISSION-CRITICAL PTT SOLUTION: MARKET, BY REGION,  2017–2022 (USD MILLION)
                    TABLE 32 MISSION-CRITICAL PTT SOLUTION: MARKET, BY REGION,  2023–2028 (USD MILLION)
    6.4 SERVICES 
           FIGURE 32 SUPPORT & MAINTENANCE SERVICES SEGMENT TO GROW AT HIGHER CAGR DURING FORECAST PERIOD
           TABLE 33 PUSH-TO-TALK MARKET, BY SERVICE, 2017–2022 (USD MILLION)
           TABLE 34 MARKET, BY SERVICE, 2023–2028 (USD MILLION)
           TABLE 35 SERVICES: MARKET, BY REGION, 2017–2022 (USD MILLION)
           TABLE 36 SERVICES: MARKET, BY REGION, 2023–2028 (USD MILLION)
           6.4.1 CONSULTING
                    6.4.1.1 Need for technical expertise in setting up robust PTT system to drive demand for consulting services
                               TABLE 37 CONSULTING: MARKET, BY REGION, 2017–2022 (USD MILLION)
                               TABLE 38 CONSULTING: MARKET, BY REGION, 2023–2028 (USD MILLION)
           6.4.2 IMPLEMENTATION
                    6.4.2.1 Implementation services to help critical communications organizations operate at their highest capacity
                               TABLE 39 IMPLEMENTATION: MARKET, BY REGION, 2017–2022 (USD MILLION)
                               TABLE 40 IMPLEMENTATION: MARKET, BY REGION, 2023–2028 (USD MILLION)
           6.4.3 SUPPORT & MAINTENANCE
                    6.4.3.1 Need for 24/7 real-time support to fuel demand for support and maintenance services
                               TABLE 41 SUPPORT & MAINTENANCE: MARKET, BY REGION,  2017–2022 (USD MILLION)
                               TABLE 42 SUPPORT & MAINTENANCE: MARKET, BY REGION,  2023–2028 (USD MILLION)
 
7 PUSH-TO-TALK MARKET, BY NETWORK TYPE (Page No. - 100)
    7.1 INTRODUCTION 
           FIGURE 33 SERVICES SEGMENT TO GROW AT HIGHER CAGR DURING FORECAST PERIOD
           7.1.1 NETWORK TYPE: MARKET DRIVERS
                    TABLE 43 MARKET, BY NETWORK TYPE, 2017–2022 (USD MILLION)
                    TABLE 44 MARKET, BY NETWORK TYPE, 2023–2028 (USD MILLION)
    7.2 LAND MOBILE RADIO 
           7.2.1 GROWING ADOPTION IN PUBLIC SAFETY VERTICAL TO DRIVE MARKET FOR LAND MOBILE RADIO SYSTEMS
                    TABLE 45 LAND MOBILE RADIO: MARKET, BY REGION, 2017–2022 (USD MILLION)
                    TABLE 46 LAND MOBILE RADIO: MARKET, BY REGION, 2023–2028 (USD MILLION)
    7.3 CELLULAR 
           7.3.1 HIGH SPEED AND LOW LATENCY COMMUNICATIONS TO DRIVE MARKET
                    TABLE 47 CELLULAR: MARKET, BY REGION, 2017–2022 (USD MILLION)
                    TABLE 48 CELLULAR: MARKET, BY REGION, 2023–2028 (USD MILLION)
 
8 PUSH-TO-TALK MARKET, BY VERTICAL (Page No. - 105)
    8.1 INTRODUCTION 
           FIGURE 34 TRAVEL & HOSPITALITY SEGMENT TO GROW AT HIGHER CAGR DURING FORECAST PERIOD
           8.1.1 VERTICAL: MARKET DRIVERS
                    TABLE 49 MARKET, BY VERTICAL, 2017–2022 (USD MILLION)
                    TABLE 50 MARKET, BY VERTICAL, 2023–2028 (USD MILLION)
    8.2 GOVERNMENT & PUBLIC SAFETY 
           8.2.1 NEED FOR RELIABLE, STABLE, AND FLEXIBLE GROUP COMMUNICATION SYSTEM WITH PTT FUNCTIONALITY TO BOOST MARKET
           8.2.2 GOVERNMENT & PUBLIC SAFETY: PUSH-TO-TALK USE CASES
                    8.2.2.1 Emergency command centers
                    8.2.2.2 Search and rescue operations
                    8.2.2.3 Fire departments
                               TABLE 51 GOVERNMENT & PUBLIC SAFETY: MARKET, BY REGION,  2017–2022 (USD MILLION)
                               TABLE 52 GOVERNMENT & PUBLIC SAFETY: MARKET, BY REGION,  2023–2028 (USD MILLION)
    8.3 AEROSPACE & DEFENSE 
           8.3.1 REAL-TIME COORDINATION DURING MILITARY OPERATIONS AND REMOTE CONTROL OF UNMANNED VEHICLES TO DRIVE MARKET
           8.3.2 AEROSPACE & DEFENSE: PUSH-TO-TALK USE CASES
                    8.3.2.1 Air traffic control
                    8.3.2.2 Tactical communication
                               TABLE 53 AEROSPACE & DEFENSE: MARKET, BY REGION,  2017–2022 (USD MILLION)
                               TABLE 54 AEROSPACE & DEFENSE: MARKET, BY REGION,  2023–2028 (USD MILLION)
    8.4 TRANSPORTATION & LOGISTICS 
           8.4.1 RELIABLE DELIVERY OF SHIPMENTS AND REAL-TIME TRACKING OF FLEETS TO BOOST MARKET
           8.4.2 TRANSPORTATION & LOGISTICS: PUSH-TO-TALK USE CASES
                    8.4.2.1 Fleet management and dispatch
                    8.4.2.2 Warehouse operations
                               TABLE 55 TRANSPORTATION & LOGISTICS: PUSH-TO-TALK MARKET, BY REGION,  2017–2022 (USD MILLION)
                               TABLE 56 TRANSPORTATION & LOGISTICS: MARKET, BY REGION,  2023–2028 (USD MILLION)
    8.5 MANUFACTURING 
           8.5.1 PUSH-TO-TALK SOLUTIONS TO HELP MANUFACTURERS IMPROVE WORKER SAFETY AND PRODUCTIVITY
           8.5.2 MANUFACTURING: PUSH-TO-TALK USE CASES
                    8.5.2.1 Maximize worker safety
                    8.5.2.2 Streamline communications
                               TABLE 57 MANUFACTURING: MARKET, BY REGION, 2017–2022 (USD MILLION)
                               TABLE 58 MANUFACTURING: MARKET, BY REGION, 2023–2028 (USD MILLION)
    8.6 CONSTRUCTION & MINING 
           8.6.1 PUSH-TO-TALK SOLUTIONS TO OFFER EFFECTIVE COMMUNICATION OPTIONS AT CONSTRUCTION SITES
           8.6.2 CONSTRUCTION & MINING: PUSH-TO-TALK USE CASES
                    8.6.2.1 Site coordination
                    8.6.2.2 Remote monitoring
                               TABLE 59 CONSTRUCTION & MINING: PUSH-TO-TALK MARKET, BY REGION,  2017–2022 (USD MILLION)
                               TABLE 60 CONSTRUCTION & MINING: MARKET, BY REGION,  2023–2028 (USD MILLION)
    8.7 ENERGY & UTILITIES 
           8.7.1 PUSH-TO-TALK DEVICES TO ENABLE REAL-TIME COMMUNICATION AND ENSURE SAFETY OF LARGE WORKFORCES IN ENERGY & UTILITIES VERTICAL
           8.7.2 ENERGY & UTILITIES: PUSH-TO-TALK USE CASES
                    8.7.2.1 Smart grid management
                    8.7.2.2 Disaster response and recovery
                               TABLE 61 ENERGY & UTILITIES: MARKET, BY REGION, 2017–2022 (USD MILLION)
                               TABLE 62 ENERGY & UTILITIES: MARKET, BY REGION, 2023–2028 (USD MILLION)
    8.8 TRAVEL & HOSPITALITY 
           8.8.1 INTEGRATED VOICE AND BUSINESS APPLICATIONS TO IMPROVE OVERALL GUEST AND TRAVELER EXPERIENCE
           8.8.2 TRAVEL & HOSPITALITY: PUSH-TO-TALK USE CASES
                    8.8.2.1 Event management
                    8.8.2.2 Maintenance and housekeeping
                               TABLE 63 TRAVEL & HOSPITALITY: PUSH-TO-TALK MARKET, BY REGION, 2017–2022 (USD MILLION)
                               TABLE 64 TRAVEL & HOSPITALITY: MARKET, BY REGION, 2023–2028 (USD MILLION)
    8.9 HEALTHCARE 
           8.9.1 FASTER RESPONSE TIMES AND IMPROVED COLLABORATION TO PROPEL MARKET GROWTH
           8.9.2 HEALTHCARE: PUSH-TO-TALK USE CASES
                    8.9.2.1 Speedy response time
                    8.9.2.2 Security and safety
                               TABLE 65 HEALTHCARE: MARKET, BY REGION, 2017–2022 (USD MILLION)
                               TABLE 66 HEALTHCARE: MARKET, BY REGION, 2023–2028 (USD MILLION)
    8.10 OTHER VERTICALS 
           8.10.1 OTHER VERTICALS: PUSH-TO-TALK USE CASES
                    8.10.1.1 Network maintenance
                    8.10.1.2 Administrative communication
                    8.10.1.3 Store management
                               TABLE 67 OTHER VERTICALS: MARKET, BY REGION, 2017–2022 (USD MILLION)
                               TABLE 68 OTHER VERTICALS: MARKET, BY REGION, 2023–2028 (USD MILLION)
 
9 PUSH-TO-TALK MARKET, BY REGION (Page No. - 120)
    9.1 INTRODUCTION 
           TABLE 69 MARKET, BY REGION, 2017–2022 (USD MILLION)
           TABLE 70 MARKET, BY REGION, 2023–2028 (USD MILLION)
    9.2 NORTH AMERICA 
           9.2.1 NORTH AMERICA: RECESSION IMPACT
           9.2.2 NORTH AMERICA: MARKET DRIVERS
                    FIGURE 35 NORTH AMERICA: MARKET SNAPSHOT
                    TABLE 71 NORTH AMERICA: PUSH-TO-TALK MARKET, BY OFFERING, 2017–2022 (USD MILLION)
                    TABLE 72 NORTH AMERICA: MARKET, BY OFFERING, 2023–2028 (USD MILLION)
                    TABLE 73 NORTH AMERICA: MARKET, BY SOLUTION, 2017–2022 (USD MILLION)
                    TABLE 74 NORTH AMERICA: MARKET, BY SOLUTION, 2023–2028 (USD MILLION)
                    TABLE 75 NORTH AMERICA: MARKET, BY SERVICE, 2017–2022 (USD MILLION)
                    TABLE 76 NORTH AMERICA: MARKET, BY SERVICE, 2023–2028 (USD MILLION)
                    TABLE 77 NORTH AMERICA: MARKET, BY NETWORK TYPE,  2017–2022 (USD MILLION)
                    TABLE 78 NORTH AMERICA: MARKET, BY NETWORK TYPE,  2023–2028 (USD MILLION)
                    TABLE 79 NORTH AMERICA: MARKET, BY VERTICAL, 2017–2022 (USD MILLION)
                    TABLE 80 NORTH AMERICA: MARKET, BY VERTICAL, 2023–2028 (USD MILLION)
                    TABLE 81 NORTH AMERICA: MARKET, BY COUNTRY,  2017–2022 (USD MILLION)
                    TABLE 82 NORTH AMERICA: MARKET, BY COUNTRY,  2023–2028 (USD MILLION)
           9.2.3 US
                    9.2.3.1 Highly developed telecom infrastructure and presence of several PTT vendors to drive market
                               TABLE 83 US: PUSH-TO-TALK MARKET, BY OFFERING, 2017–2022 (USD MILLION)
                               TABLE 84 US: MARKET, BY OFFERING, 2023–2028 (USD MILLION)
                               TABLE 85 US: MARKET, BY SOLUTION, 2017–2022 (USD MILLION)
                               TABLE 86 US: MARKET, BY SOLUTION, 2023–2028 (USD MILLION)
                               TABLE 87 US: MARKET, BY SERVICE, 2017–2022 (USD MILLION)
                               TABLE 88 US: MARKET, BY SERVICE, 2023–2028 (USD MILLION)
                               TABLE 89 US: MARKET, BY NETWORK TYPE, 2017–2022 (USD MILLION)
                               TABLE 90 US: MARKET, BY NETWORK TYPE, 2023–2028 (USD MILLION)
                               TABLE 91 US: MARKET, BY VERTICAL, 2017–2022 (USD MILLION)
                               TABLE 92 US: MARKET, BY VERTICAL, 2023–2028 (USD MILLION)
           9.2.4 CANADA
                    9.2.4.1 Adoption of critical communication solutions to fuel market growth
                               TABLE 93 CANADA: PUSH-TO-TALK MARKET, BY OFFERING, 2017–2022 (USD MILLION)
                               TABLE 94 CANADA: MARKET, BY OFFERING, 2023–2028 (USD MILLION)
                               TABLE 95 CANADA: MARKET, BY SOLUTION, 2017–2022 (USD MILLION)
                               TABLE 96 CANADA: MARKET, BY SOLUTION, 2023–2028 (USD MILLION)
                               TABLE 97 CANADA: MARKET, BY SERVICE, 2017–2022 (USD MILLION)
                               TABLE 98 CANADA: MARKET, BY SERVICE, 2023–2028 (USD MILLION)
                               TABLE 99 CANADA: MARKET, BY NETWORK TYPE, 2017–2022 (USD MILLION)
                               TABLE 100 CANADA: MARKET, BY NETWORK TYPE, 2023–2028 (USD MILLION)
                               TABLE 101 CANADA: MARKET, BY VERTICAL, 2017–2022 (USD MILLION)
                               TABLE 102 CANADA: MARKET, BY VERTICAL, 2023–2028 (USD MILLION)
    9.3 EUROPE 
           9.3.1 EUROPE: RECESSION IMPACT
           9.3.2 EUROPE: MARKET DRIVERS
                    TABLE 103 EUROPE: PUSH-TO-TALK MARKET, BY OFFERING, 2017–2022 (USD MILLION)
                    TABLE 104 EUROPE: MARKET, BY OFFERING, 2023–2028 (USD MILLION)
                    TABLE 105 EUROPE: MARKET, BY SOLUTION, 2017–2022 (USD MILLION)
                    TABLE 106 EUROPE: MARKET, BY SOLUTION, 2023–2028 (USD MILLION)
                    TABLE 107 EUROPE: MARKET, BY SERVICE, 2017–2022 (USD MILLION)
                    TABLE 108 EUROPE: MARKET, BY SERVICE, 2023–2028 (USD MILLION)
                    TABLE 109 EUROPE: MARKET, BY NETWORK TYPE, 2017–2022 (USD MILLION)
                    TABLE 110 EUROPE: MARKET, BY NETWORK TYPE, 2023–2028 (USD MILLION)
                    TABLE 111 EUROPE: MARKET, BY VERTICAL, 2017–2022 (USD MILLION)
                    TABLE 112 EUROPE: MARKET, BY VERTICAL, 2023–2028 (USD MILLION)
                    TABLE 113 EUROPE: MARKET, BY COUNTRY, 2017–2022 (USD MILLION)
                    TABLE 114 EUROPE: MARKET, BY COUNTRY, 2023–2028 (USD MILLION)
           9.3.3 GERMANY
                    9.3.3.1 Increase in developments in PoC services to boost market
                               TABLE 115 GERMANY: PUSH-TO-TALK MARKET, BY OFFERING, 2017–2022 (USD MILLION)
                               TABLE 116 GERMANY: MARKET, BY OFFERING, 2023–2028 (USD MILLION)
                               TABLE 117 GERMANY: MARKET, BY SOLUTION, 2017–2022 (USD MILLION)
                               TABLE 118 GERMANY: MARKET, BY SOLUTION, 2023–2028 (USD MILLION)
                               TABLE 119 GERMANY: MARKET, BY SERVICE, 2017–2022 (USD MILLION)
                               TABLE 120 GERMANY: MARKET, BY SERVICE, 2023–2028 (USD MILLION)
                               TABLE 121 GERMANY: MARKET, BY NETWORK TYPE, 2017–2022 (USD MILLION)
                               TABLE 122 GERMANY: MARKET, BY NETWORK TYPE, 2023–2028 (USD MILLION)
                               TABLE 123 GERMANY: MARKET, BY VERTICAL, 2017–2022 (USD MILLION)
                               TABLE 124 GERMANY: MARKET, BY VERTICAL, 2023–2028 (USD MILLION)
           9.3.4 UNITED KINGDOM
                    9.3.4.1 Increasing demand for digital transformation to drive market
           9.3.5 FRANCE
                    9.3.5.1 Advanced economy and flourishing IoT, AI, and ML technologies to drive market
           9.3.6 ITALY
                    9.3.6.1 Increasing adoption of cloud-based PTT devices to fuel market growth
           9.3.7 SPAIN
                    9.3.7.1 Increasing popularity of smartphones and other mobile devices to drive market
           9.3.8 NORDICS
                    9.3.8.1 High level of mobile adoption and growing demand for real-time communication to increase adoption of push-to-talk technology
           9.3.9 REST OF EUROPE
    9.4 ASIA PACIFIC 
           9.4.1 ASIA PACIFIC: RECESSION IMPACT
           9.4.2 ASIA PACIFIC: MARKET DRIVERS
                    FIGURE 36 ASIA PACIFIC: PUSH-TO-TALK MARKET SNAPSHOT
                    TABLE 125 ASIA PACIFIC: MARKET, BY OFFERING, 2017–2022 (USD MILLION)
                    TABLE 126 ASIA PACIFIC: MARKET, BY OFFERING, 2023–2028 (USD MILLION)
                    TABLE 127 ASIA PACIFIC: MARKET, BY SOLUTION, 2017–2022 (USD MILLION)
                    TABLE 128 ASIA PACIFIC: MARKET, BY SOLUTION, 2023–2028 (USD MILLION)
                    TABLE 129 ASIA PACIFIC: MARKET, BY SERVICE, 2017–2022 (USD MILLION)
                    TABLE 130 ASIA PACIFIC: MARKET, BY SERVICE, 2023–2028 (USD MILLION)
                    TABLE 131 ASIA PACIFIC: MARKET, BY NETWORK TYPE, 2017–2022 (USD MILLION)
                    TABLE 132 ASIA PACIFIC: MARKET, BY NETWORK TYPE, 2023–2028 (USD MILLION)
                    TABLE 133 ASIA PACIFIC: MARKET, BY VERTICAL, 2017–2022 (USD MILLION)
                    TABLE 134 ASIA PACIFIC: MARKET, BY VERTICAL, 2023–2028 (USD MILLION)
                    TABLE 135 ASIA PACIFIC: MARKET, BY COUNTRY, 2017–2022 (USD MILLION)
                    TABLE 136 ASIA PACIFIC: MARKET, BY COUNTRY, 2023–2028 (USD MILLION)
           9.4.3 CHINA
                    9.4.3.1 Continuous demand for integrated voice and data on mobile devices to drive market
                               TABLE 137 CHINA: PUSH-TO-TALK MARKET, BY OFFERING, 2017–2022 (USD MILLION)
                               TABLE 138 CHINA: MARKET, BY OFFERING, 2023–2028 (USD MILLION)
                               TABLE 139 CHINA: MARKET, BY SOLUTION, 2017–2022 (USD MILLION)
                               TABLE 140 CHINA: MARKET, BY SOLUTION, 2023–2028 (USD MILLION)
                               TABLE 141 CHINA: MARKET, BY SERVICE, 2017–2022 (USD MILLION)
                               TABLE 142 CHINA: MARKET, BY SERVICE, 2023–2028 (USD MILLION)
                               TABLE 143 CHINA: MARKET, BY NETWORK TYPE, 2017–2022 (USD MILLION)
                               TABLE 144 CHINA: MARKET, BY NETWORK TYPE, 2023–2028 (USD MILLION)
                               TABLE 145 CHINA: MARKET, BY VERTICAL, 2017–2022 (USD MILLION)
                               TABLE 146 CHINA: MARKET, BY VERTICAL, 2023–2028 (USD MILLION)
           9.4.4 INDIA
                    9.4.4.1 Rise in adoption of PTT solutions in defense services to drive market
           9.4.5 JAPAN
                    9.4.5.1 Surge in demand for cost-effective communication solutions to fuel market growth
           9.4.6 AUSTRALIA & NEW ZEALAND
                    9.4.6.1 Need for more secure and reliable communication solutions to boost market
           9.4.7 REST OF ASIA PACIFIC
    9.5 MIDDLE EAST & AFRICA 
           9.5.1 MIDDLE EAST & AFRICA: RECESSION IMPACT
           9.5.2 MIDDLE EAST & AFRICA: MARKET DRIVERS
                    TABLE 147 MIDDLE EAST & AFRICA: PUSH-TO-TALK MARKET, BY OFFERING,  2017–2022 (USD MILLION)
                    TABLE 148 MIDDLE EAST & AFRICA: MARKET, BY OFFERING,  2023–2028 (USD MILLION)
                    TABLE 149 MIDDLE EAST & AFRICA: MARKET, BY SOLUTION,  2017–2022 (USD MILLION)
                    TABLE 150 MIDDLE EAST & AFRICA: MARKET, BY SOLUTION,  2023–2028 (USD MILLION)
                    TABLE 151 MIDDLE EAST & AFRICA: MARKET, BY SERVICE,  2017–2022 (USD MILLION)
                    TABLE 152 MIDDLE EAST & AFRICA: MARKET, BY SERVICE,  2023–2028 (USD MILLION)
                    TABLE 153 MIDDLE EAST & AFRICA: MARKET, BY NETWORK TYPE,  2017–2022 (USD MILLION)
                    TABLE 154 MIDDLE EAST & AFRICA: MARKET, BY NETWORK TYPE,  2023–2028 (USD MILLION)
                    TABLE 155 MIDDLE EAST & AFRICA: MARKET, BY VERTICAL,  2017–2022 (USD MILLION)
                    TABLE 156 MIDDLE EAST & AFRICA: MARKET, BY VERTICAL,  2023–2028 (USD MILLION)
                    TABLE 157 MIDDLE EAST & AFRICA: MARKET, BY COUNTRY,  2017–2022 (USD MILLION)
                    TABLE 158 MIDDLE EAST & AFRICA: MARKET, BY COUNTRY,  2023–2028 (USD MILLION)
           9.5.3 MIDDLE EAST
                    TABLE 159 MIDDLE EAST: PUSH-TO-TALK MARKET, BY OFFERING, 2017–2022 (USD MILLION)
                    TABLE 160 MIDDLE EAST: MARKET, BY OFFERING, 2023–2028 (USD MILLION)
                    TABLE 161 MIDDLE EAST: MARKET, BY SOLUTION, 2017–2022 (USD MILLION)
                    TABLE 162 MIDDLE EAST: MARKET, BY SOLUTION, 2023–2028 (USD MILLION)
                    TABLE 163 MIDDLE EAST: MARKET, BY SERVICE, 2017–2022 (USD MILLION)
                    TABLE 164 MIDDLE EAST: MARKET, BY SERVICE, 2023–2028 (USD MILLION)
                    TABLE 165 MIDDLE EAST: MARKET, BY NETWORK TYPE, 2017–2022 (USD MILLION)
                    TABLE 166 MIDDLE EAST: MARKET, BY NETWORK TYPE, 2023–2028 (USD MILLION)
                    TABLE 167 MIDDLE EAST: MARKET, BY VERTICAL, 2017–2022 (USD MILLION)
                    TABLE 168 MIDDLE EAST: MARKET, BY VERTICAL, 2023–2028 (USD MILLION)
                    TABLE 169 MIDDLE EAST: MARKET, BY COUNTRY, 2017–2022 (USD MILLION)
                    TABLE 170 MIDDLE EAST: MARKET, BY COUNTRY, 2023–2028 (USD MILLION)
                    9.5.3.1 KSA
                               9.5.3.1.1 Focus on safe communications in hazardous areas to drive market
                               TABLE 171 KSA: PUSH-TO-TALK MARKET, BY OFFERING, 2017–2022 (USD MILLION)
                               TABLE 172 KSA: MARKET, BY OFFERING, 2023–2028 (USD MILLION)
                               TABLE 173 KSA: MARKET, BY SOLUTION, 2017–2022 (USD MILLION)
                               TABLE 174 KSA: MARKET, BY SOLUTION, 2023–2028 (USD MILLION)
                               TABLE 175 KSA: MARKET, BY SERVICE, 2017–2022 (USD MILLION)
                               TABLE 176 KSA: MARKET, BY SERVICE, 2023–2028 (USD MILLION)
                               TABLE 177 KSA: MARKET, BY NETWORK TYPE, 2017–2022 (USD MILLION)
                               TABLE 178 KSA: MARKET, BY NETWORK TYPE, 2023–2028 (USD MILLION)
                               TABLE 179 KSA: MARKET, BY VERTICAL, 2017–2022 (USD MILLION)
                               TABLE 180 KSA: MARKET, BY VERTICAL, 2023–2028 (USD MILLION)
                    9.5.3.2 UAE
                               9.5.3.2.1 Adoption of mission-critical and smart city services by UAE government to propel market growth
                    9.5.3.3 Rest of Middle East
           9.5.4 AFRICA
                    9.5.4.1 Transition from analog to digital systems to accelerate market growth
    9.6 LATIN AMERICA 
           9.6.1 LATIN AMERICA: RECESSION IMPACT
           9.6.2 LATIN AMERICA: MARKET DRIVERS
                    TABLE 181 LATIN AMERICA: PUSH-TO-TALK MARKET, BY OFFERING, 2017–2022 (USD MILLION)
                    TABLE 182 LATIN AMERICA: MARKET, BY OFFERING, 2023–2028 (USD MILLION)
                    TABLE 183 LATIN AMERICA: MARKET, BY SOLUTION, 2017–2022 (USD MILLION)
                    TABLE 184 LATIN AMERICA: MARKET, BY SOLUTION, 2023–2028 (USD MILLION)
                    TABLE 185 LATIN AMERICA: MARKET, BY SERVICE, 2017–2022 (USD MILLION)
                    TABLE 186 LATIN AMERICA: MARKET, BY SERVICE, 2023–2028 (USD MILLION)
                    TABLE 187 LATIN AMERICA: MARKET, BY NETWORK TYPE, 2017–2022 (USD MILLION)
                    TABLE 188 LATIN AMERICA: MARKET, BY NETWORK TYPE, 2023–2028 (USD MILLION)
                    TABLE 189 LATIN AMERICA: MARKET, BY VERTICAL, 2017–2022 (USD MILLION)
                    TABLE 190 LATIN AMERICA: MARKET, BY VERTICAL, 2023–2028 (USD MILLION)
                    TABLE 191 LATIN AMERICA: MARKET, BY COUNTRY, 2017–2022 (USD MILLION)
                    TABLE 192 LATIN AMERICA: MARKET, BY COUNTRY, 2023–2028 (USD MILLION)
           9.6.3 BRAZIL
                    9.6.3.1 Spike in demand for remote solutions in organizations to boost market
                               TABLE 193 BRAZIL: PUSH-TO-TALK MARKET, BY OFFERING, 2017–2022 (USD MILLION)
                               TABLE 194 BRAZIL: MARKET, BY OFFERING, 2023–2028 (USD MILLION)
                               TABLE 195 BRAZIL: MARKET, BY SOLUTION, 2017–2022 (USD MILLION)
                               TABLE 196 BRAZIL: MARKET, BY SOLUTION, 2023–2028 (USD MILLION)
                               TABLE 197 BRAZIL: MARKET, BY SERVICE, 2017–2022 (USD MILLION)
                               TABLE 198 BRAZIL: MARKET, BY SERVICE, 2023–2028 (USD MILLION)
                               TABLE 199 BRAZIL: MARKET, BY NETWORK TYPE, 2017–2022 (USD MILLION)
                               TABLE 200 BRAZIL: MARKET, BY NETWORK TYPE, 2023–2028 (USD MILLION)
                               TABLE 201 BRAZIL: MARKET, BY VERTICAL, 2017–2022 (USD MILLION)
                               TABLE 202 BRAZIL: MARKET, BY VERTICAL, 2023–2028 (USD MILLION)
           9.6.4 MEXICO
                    9.6.4.1 Telecom reforms and government initiatives to boost adoption of PTT technology
           9.6.5 REST OF LATIN AMERICA
 
10 COMPETITIVE LANDSCAPE (Page No. - 169)
     10.1 INTRODUCTION 
     10.2 STRATEGIES ADOPTED BY KEY PLAYERS 
               TABLE 203 OVERVIEW OF STRATEGIES ADOPTED BY KEY PLAYERS
     10.3 HISTORICAL REVENUE ANALYSIS 
               FIGURE 37 HISTORICAL REVENUE ANALYSIS OF KEY PLAYERS, 2020–2022 (USD MILLION)
     10.4 MARKET SHARE ANALYSIS OF KEY PLAYERS 
               TABLE 204 PUSH-TO-TALK MARKET: DEGREE OF COMPETITION
     10.5 COMPANY EVALUATION MATRIX 
             10.5.1 STARS
             10.5.2 EMERGING LEADERS
             10.5.3 PERVASIVE PLAYERS
             10.5.4 PARTICIPANTS
                       FIGURE 38 GLOBAL PTT MARKET COMPANY EVALUATION MATRIX, 2023
             10.5.5 COMPANY FOOTPRINT
                       TABLE 205 OFFERING FOOTPRINT
                       TABLE 206 VERTICAL FOOTPRINT
                       TABLE 207 REGIONAL FOOTPRINT
                       TABLE 208 COMPANY FOOTPRINT
     10.6 STARTUP/SME EVALUATION MATRIX 
             10.6.1 PROGRESSIVE COMPANIES
             10.6.2 RESPONSIVE COMPANIES
             10.6.3 DYNAMIC COMPANIES
             10.6.4 STARTING BLOCKS
                       FIGURE 39 GLOBAL PTT MARKET STARTUP/SME EVALUATION MATRIX, 2023
             10.6.5 COMPETITIVE BENCHMARKING
                       TABLE 209 PTT MARKET: DETAILED LIST OF STARTUPS/SMES
                       TABLE 210 COMPETITIVE BENCHMARKING OF STARTUPS/SMES
                       TABLE 211 PTT MARKET: COMPETITIVE BENCHMARKING OF KEY PLAYERS
     10.7 COMPETITIVE SCENARIO 
             10.7.1 PRODUCT LAUNCHES
                       TABLE 212 PRODUCT LAUNCHES, 2020–2023
             10.7.2 DEALS
                       TABLE 213 DEALS, 2020–2023
     10.8 PTT PRODUCT BENCHMARKING 
             10.8.1 PROMINENT PTT SOLUTION PROVIDERS
                       TABLE 214 COMPARATIVE ANALYSIS OF PROMINENT PTT SOLUTION PROVIDERS
                       10.8.1.1 AT&T Enhanced Push-to-Talk platform
                       10.8.1.2 Verizon Push to Talk Plus
                       10.8.1.3 T-Mobile Push-to-Talk (PTT)
                       10.8.1.4 QChat Push-to-Chat solution
                       10.8.1.5 Airbus Agnet
             10.8.2 PROMINENT PTT SERVICE PROVIDERS
                       TABLE 215 COMPARATIVE ANALYSIS OF PROMINENT PTT SERVICE PROVIDERS
                       10.8.2.1 WAVE PTX
                       10.8.2.2 Bell Canada Push-to-Talk Service
                       10.8.2.3 Ericsson Mission-Critical Services
     10.9 VALUATION AND FINANCIAL METRICS OF KEY PTT VENDORS 
               FIGURE 40 VALUATION AND FINANCIAL METRICS OF KEY PTT VENDORS
 
11 COMPANY PROFILES (Page No. - 185)
     11.1 MAJOR PLAYERS 
(Business overview, Products/Solutions/Services offered, Recent developments, MnM view, Right to win, Strategic choices, and Weaknesses and Competitive threats)*
             11.1.1 AT&T
                       TABLE 216 AT&T: COMPANY OVERVIEW
                       FIGURE 41 AT&T: COMPANY SNAPSHOT
                       TABLE 217 AT&T: PRODUCTS/SOLUTIONS/SERVICES OFFERED
                       TABLE 218 AT&T: PRODUCT LAUNCHES AND ENHANCEMENTS
                       TABLE 219 AT&T: DEALS
             11.1.2 VERIZON
                       TABLE 220 VERIZON: COMPANY OVERVIEW
                       FIGURE 42 VERIZON: COMPANY SNAPSHOT
                       TABLE 221 VERIZON: PRODUCTS/SOLUTIONS/SERVICES OFFERED
                       TABLE 222 VERIZON: PRODUCT LAUNCHES AND ENHANCEMENTS
             11.1.3 MOTOROLA SOLUTIONS
                       TABLE 223 MOTOROLA SOLUTIONS: COMPANY OVERVIEW
                       FIGURE 43 MOTOROLA SOLUTIONS: COMPANY SNAPSHOT
                       TABLE 224 MOTOROLA SOLUTIONS: PRODUCTS/SOLUTIONS/SERVICES OFFERED
                       TABLE 225 MOTOROLA SOLUTIONS: PRODUCT LAUNCHES AND ENHANCEMENTS
                       TABLE 226 MOTOROLA SOLUTIONS: DEALS
             11.1.4 T-MOBILE
                       TABLE 227 T-MOBILE: COMPANY OVERVIEW
                       FIGURE 44 T-MOBILE: COMPANY SNAPSHOT
                       TABLE 228 T-MOBILE: PRODUCTS/SOLUTIONS/SERVICES OFFERED
                       TABLE 229 T-MOBILE: DEALS
             11.1.5 QUALCOMM
                       TABLE 230 QUALCOMM: COMPANY OVERVIEW
                       FIGURE 45 QUALCOMM: COMPANY SNAPSHOT
                       TABLE 231 QUALCOMM: PRODUCTS/SOLUTIONS/SERVICES OFFERED
                       TABLE 232 QUALCOMM: DEALS
             11.1.6 ERICSSON
                       TABLE 233 ERICSSON: COMPANY OVERVIEW
                       FIGURE 46 ERICSSON: COMPANY SNAPSHOT
                       TABLE 234 ERICSSON: PRODUCTS/SOLUTIONS/SERVICES OFFERED
                       TABLE 235 ERICSSON: DEALS
             11.1.7 AIRBUS
                       TABLE 236 AIRBUS: COMPANY OVERVIEW
                       FIGURE 47 AIRBUS: COMPANY SNAPSHOT
                       TABLE 237 AIRBUS: PRODUCTS/SOLUTIONS/SERVICES OFFERED
                       TABLE 238 AIRBUS: PRODUCT LAUNCHES AND ENHANCEMENTS
                       TABLE 239 AIRBUS: DEALS
             11.1.8 BELL CANADA
                       TABLE 240 BELL CANADA: BUSINESS OVERVIEW
                       FIGURE 48 BELL CANADA: COMPANY SNAPSHOT
                       TABLE 241 BELL CANADA: PRODUCTS/SOLUTIONS/SERVICES OFFERED
                       TABLE 242 BELL CANADA: DEALS
             11.1.9 ZEBRA TECHNOLOGIES
                       TABLE 243 ZEBRA TECHNOLOGIES: COMPANY OVERVIEW
                       FIGURE 49 ZEBRA TECHNOLOGIES: COMPANY SNAPSHOT
                       TABLE 244 ZEBRA TECHNOLOGIES: PRODUCTS/SOLUTIONS/SERVICES OFFERED
                       TABLE 245 ZEBRA TECHNOLOGIES: PRODUCT LAUNCHES AND ENHANCEMENTS
                       TABLE 246 ZEBRA TECHNOLOGIES: DEALS
             11.1.10 TELSTRA
                       TABLE 247 TELSTRA: COMPANY OVERVIEW
                       FIGURE 50 TELSTRA: COMPANY SNAPSHOT
                       TABLE 248 TELSTRA: PRODUCTS/SOLUTIONS/SERVICES OFFERED
                       TABLE 249 TELSTRA: DEALS
             11.1.11 HYTERA
                       TABLE 250 HYTERA: COMPANY OVERVIEW
                       TABLE 251 HYTERA: PRODUCTS/SOLUTIONS/SERVICES OFFERED
                       TABLE 252 HYTERA: PRODUCT LAUNCHES AND ENHANCEMENTS
                       TABLE 253 HYTERA: DEALS
             11.1.12 IRIDIUM COMMUNICATIONS
             11.1.13 TAIT COMMUNICATIONS
             11.1.14 SERVICEMAX
             11.1.15 L3HARRIS TECHNOLOGIES
     11.2 STARTUPS/SMES 
             11.2.1 GROUPTALK
             11.2.2 ORION
             11.2.3 ZELLO
             11.2.4 VOXER
             11.2.5 IPTT
             11.2.6 ESCHAT
             11.2.7 AINA WIRELESS
             11.2.8 AZETTI NETWORKS
             11.2.9 TEAMCONNECT
             11.2.10 VOICELAYER
             11.2.11 SIMOCO WIRELESS SOLUTIONS
             11.2.12 PEAKPTT
             11.2.13 RUGGEAR
             11.2.14 PROMOBI TECHNOLOGIES
*Details on Business overview, Products/Solutions/Services offered, Recent developments, MnM view, Right to win, Strategic choices, and Weaknesses and Competitive threats might not be captured in case of unlisted companies.
 
12 ADJACENT/RELATED MARKETS (Page No. - 238)
     12.1 INTRODUCTION 
     12.2 ENTERPRISE MOBILITY MANAGEMENT MARKET 
             12.2.1 MARKET DEFINITION
             12.2.2 MARKET OVERVIEW
             12.2.3 ENTERPRISE MOBILITY MANAGEMENT MARKET, BY COMPONENT
                       TABLE 254 EMM MARKET, BY COMPONENT, 2020–2026 (USD MILLION)
             12.2.4 ENTERPRISE MOBILITY MANAGEMENT MARKET, BY ORGANIZATION SIZE
                       TABLE 255 ENTERPRISE MOBILITY MANAGEMENT MARKET, BY ORGANIZATION SIZE,  2020–2026 (USD MILLION)
             12.2.5 ENTERPRISE MOBILITY MANAGEMENT MARKET, BY DEPLOYMENT MODE
                       TABLE 256 ENTERPRISE MOBILITY MANAGEMENT MARKET, BY DEPLOYMENT MODE,  2020–2026 (USD MILLION)
             12.2.6 ENTERPRISE MOBILITY MANAGEMENT MARKET, BY VERTICAL
                       TABLE 257 ENTERPRISE MOBILITY MANAGEMENT MARKET, BY VERTICAL,  2020–2026 (USD MILLION)
     12.3 MOBILE DEVICE MANAGEMENT MARKET 
             12.3.1 MARKET DEFINITION
             12.3.2 MARKET OVERVIEW
             12.3.3 MOBILE DEVICE MANAGEMENT MARKET, BY COMPONENT
                       TABLE 258 MOBILE DEVICE MANAGEMENT MARKET, BY COMPONENT, 2016–2021 (USD MILLION)
                       TABLE 259 MOBILE DEVICE MANAGEMENT MARKET, BY COMPONENT, 2022–2027 (USD MILLION)
             12.3.4 MOBILE DEVICE MANAGEMENT MARKET, BY OPERATING SYSTEM
                       TABLE 260 MOBILE DEVICE MANAGEMENT MARKET, BY OPERATING SYSTEM,  2016–2021 (USD MILLION)
                       TABLE 261 MOBILE DEVICE MANAGEMENT MARKET, BY OPERATING SYSTEM,  2022–2027 (USD MILLION)
             12.3.5 MOBILE DEVICE MANAGEMENT MARKET, BY VERTICAL
                       TABLE 262 MOBILE DEVICE MANAGEMENT MARKET, BY VERTICAL, 2016–2021 (USD MILLION)
                       TABLE 263 MOBILE DEVICE MANAGEMENT MARKET, BY VERTICAL, 2022–2027 (USD MILLION)
 
13 APPENDIX (Page No. - 245)
     13.1 DISCUSSION GUIDE 
     13.2 KNOWLEDGESTORE: MARKETSANDMARKETS’  SUBSCRIPTION PORTAL 
     13.3 CUSTOMIZATION OPTIONS  
     13.4 RELATED REPORTS 
     13.5 AUTHOR DETAILS 

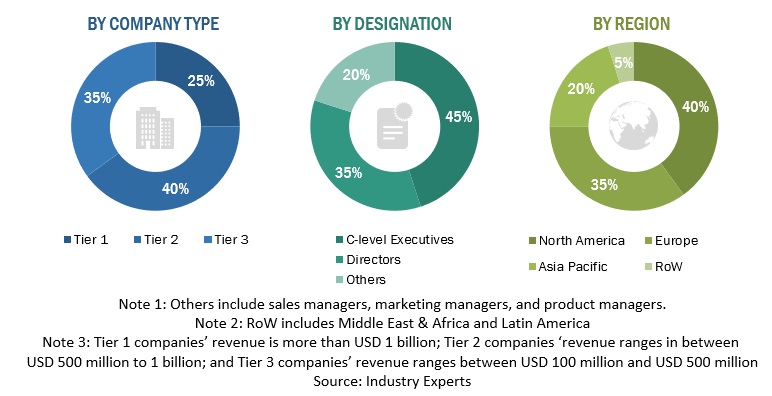
This research study involved extensive secondary sources, directories, and databases, such as Dun & Bradstreet (D&B) Hoovers and Bloomberg BusinessWeek, to identify and collect information useful for a technical, market-oriented, and commercial study of the PTT market. The primary sources have been mainly industry experts from the core and related industries and preferred suppliers, manufacturers, distributors, service providers, technology developers, alliances, and organizations related to all segments of the value chain of this market. In-depth interviews have been conducted with various primary respondents, including key industry participants, subject matter experts, C-level executives of key market players, and industry consultants to obtain and verify critical qualitative and quantitative information.

Secondary Research

The market for the companies offering push-to-talk hardware, solutions, and services for various industry verticals is arrived at based on the secondary data available through paid and unpaid sources and by analyzing the product portfolio of major companies in the ecosystem and rating them based on their performance and quality. In the secondary research process, various sources were referred to for identifying and collecting information for this study. The secondary sources included annual reports, press releases, investor presentations of companies, white papers, journals, and certified publications and articles from recognized authors, directories, and databases.

Secondary research was used to obtain key information about the industry’s supply chain, the total pool of key players, market classification, and segmentation according to the industry trends to the bottom-most level, regional markets, and key developments from both the market and technology-oriented perspectives, all of which were further validated by primary sources.

Primary Research

In the primary research process, various primary sources from both the supply and demand sides were interviewed to obtain qualitative and quantitative information for the report. The primary sources from the supply side included industry experts, such as Chief Executive Officers (CEOs), Chief Technology Officers (CTOs), Chief Operating Officers (COOs), Vice Presidents (VPs), marketing directors, technology and innovation directors, and related key executives from various key companies and organizations operating in the Push-to-talk market. The primary sources from the demand side included Push-to-talk end users, network administrators/consultants/specialists, Chief Information Officers (CIOs), and subject-matter experts from enterprises and government associations. After the complete market engineering process (including calculations for market statistics, market breakdown, market size estimations, market forecast, and data triangulation), extensive primary research was conducted to gather information and verify and validate the critical numbers arrived at. Primary research was also conducted to identify and validate the segmentation types; industry trends; key players; the market's competitive landscape, and key market dynamics, such as drivers, restraints, opportunities, challenges, industry trends, and key strategies. In the complete market engineering process, both top-down and bottom-up approaches and several data triangulation methods were used to estimate and forecast the overall market segments and subsegments listed in this report. Extensive qualitative and quantitative analysis was performed on the complete market engineering process to list the key information/insights throughout the report.
Push-to-talk Market Size, and Share

To know about the assumptions considered for the study, download the pdf brochure

Market Size Estimation

Multiple approaches were adopted to estimate and forecast the size of the PTT market. The first approach involves estimating market size by summing up the revenue generated by companies through the sale of PTT offerings, such as solutions, and services.

Both top-down and bottom-up approaches were used to estimate and validate the total size of the PTT market. These methods were extensively used to estimate the size of various segments in the market. The research methodology used to estimate the market size includes the following:

  • Key players in the market have been identified through extensive secondary research.
  • In terms of value, the industry’s supply chain and market size have been determined through primary and secondary research processes.
  • All percentage shares, splits, and breakups have been determined using secondary sources and verified through primary sources.

Push-to-Talk Market Size: Bottom-Up Approach

Push-to-talk Market Size, and Share

To know about the assumptions considered for the study, Request for Free Sample Report

Push-to-Talk Market Size: Top-Down Approach

Push-to-talk Market Size, and Share

Data Triangulation

After arriving at the overall market size, the PTT market was divided into several segments and subsegments. A data triangulation procedure was used to complete the overall market engineering process and arrive at the exact statistics for all segments and subsegments, wherever applicable. The data was triangulated by studying various factors and trends from the demand and supply sides. Along with data triangulation and market breakdown, the market size was validated by the top-down and bottom-up approaches.

Market Definition

The PTT market includes PTT hardware, solutions/applications and associated services that help in establishing a two-way radio communications service, which operates with a push of a button on devices such as smartphones, rugged PTT devices, and accessories (headsets, microphones, etc.). The PTT technology addresses the need within enterprises and emergency first responders to communicate time-critical information quickly and efficiently.

Key Stakeholders

  • Information Technology (IT) directors, managers, and support staff
  • Network and system administrators
  • Operations improvement managers
  • Dispatch managers
  • Communications and distribution managers
  • Enterprise mobility managers
  • Mobile device managers
  • PTT specialists
  • Account managers and sales managers
  • Value-Added Resellers (VARs)

Report Objectives

  • To determine and forecast the global PTT market by offering (hardware, solutions, and services), network type, vertical, and region from 2023 to 2028, and analyze the various macroeconomic and microeconomic factors that affect the market growth.
  • To forecast the size of the market segments with respect to five main regions: North America, Europe, Asia Pacific (APAC), Latin America, and Middle East & Africa.
  • To provide detailed information about the major factors (drivers, restraints, opportunities, and challenges) influencing the growth of the PTT market.
  • To analyze each submarket with respect to individual growth trends, prospects, and contributions to the overall PTT market.
  • To analyze the opportunities in the market for stakeholders by identifying the high-growth segments of the PTT market.
  • To profile the key market players; provide a comparative analysis based on business overviews, regional presence, product offerings, business strategies, and key financials; and illustrate the market's competitive landscape.
  • Track and analyze competitive developments in the market, such as mergers and acquisitions, product developments, partnerships and collaborations, and Research and Development (R&D) activities.

Available Customizations

With the given market data, MarketsandMarkets offers customizations as per the company’s specific needs. The following customization options are available for the report:

Geographic Analysis

  • Further breakup of the Asia Pacific market into countries contributing 75% to the regional market size
  • Further breakup of the North American market into countries contributing 75% to the regional market size
  • Further breakup of the Latin American market into countries contributing 75% to the regional market size
  • Further breakup of the MEA market into countries contributing 75% to the regional market size
  • Further breakup of the European market into countries contributing 75% to the regional market size

Company Information

  • Detailed analysis and profiling of additional market players (up to 5)
Custom Market Research Services

We will customize the research for you, in case the report listed above does not meet with your exact requirements. Our custom research will comprehensively cover the business information you require to help you arrive at strategic and profitable business decisions.

Request Customization

Instant Answers with GPT - Ask Now!

Ask real questions. Get complete answers !
Report Code
TC 7493
Published ON
Sep, 2023
Choose License Type
BUY NOW
  • SHARE
X
Request Customization
Speak to Analyst
Speak to Analyst
OR FACE-TO-FACE MEETING
PERSONALIZE THIS RESEARCH
  • Triangulate with your Own Data
  • Get Data as per your Format and Definition
  • Gain a Deeper Dive on a Specific Application, Geography, Customer or Competitor
  • Any level of Personalization
REQUEST A FREE CUSTOMIZATION
LET US HELP YOU!
  • What are the Known and Unknown Adjacencies Impacting the Push-to-talk Market
  • What will your New Revenue Sources be?
  • Who will be your Top Customer; what will make them switch?
  • Defend your Market Share or Win Competitors
  • Get a Scorecard for Target Partners
CUSTOMIZED WORKSHOP REQUEST
+1-888-600-6441
  • Call Us
  • +1-888-600-6441 (Corporate office hours)
  • +1-888-600-6441 (US/Can toll free)
  • +44-800-368-9399 (UK office hours)
CONNECT WITH US
ABOUT TRUST ONLINE
©2024 MarketsandMarkets Research Private Ltd. All rights reserved
DMCA.com Protection Status Website Feedback