Radiation Hardened Electronics Market

Radiation Hardened Electronics Market by Component (Mixed Signal ICs, Processors & Controllers, Memory, Power Management), Manufacturing Techniques (RHBD, RHBP), Product Type, Application and Geography - Global Forecast to 2029

Report Code: SE 2934 Feb, 2024, by marketsandmarkets.com

[260 Pages Report] The Radiation-Hardened Electronics Market Size is expected to grow from USD 1.7 billion in 2024 to USD 2.1 billion by 2029; it is expected to grow at a CAGR of 4.8% from 2024 to 2029.

The market has a positive growth potential due to several driving factors, including ongoing research and development in materials science, design techniques, and testing methodologies that are leading to improved performance, reliability, and affordability of radiation-hardened electronics, opening doors for new applications.
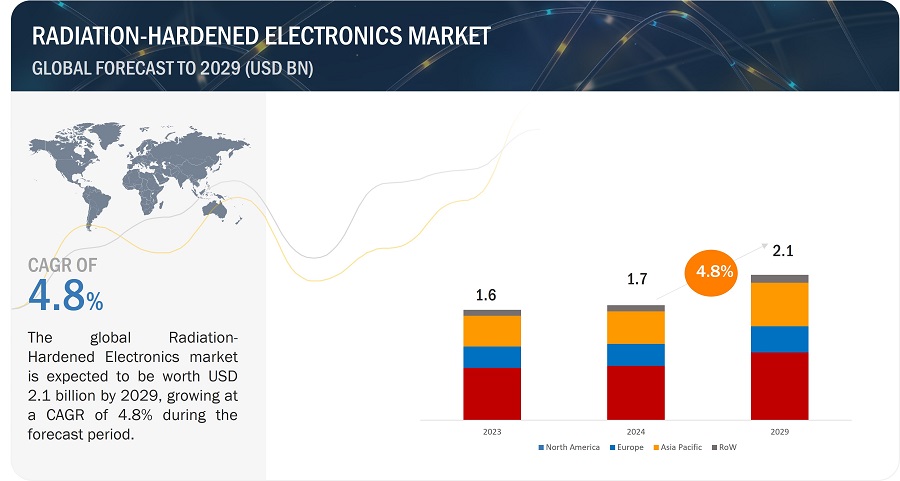
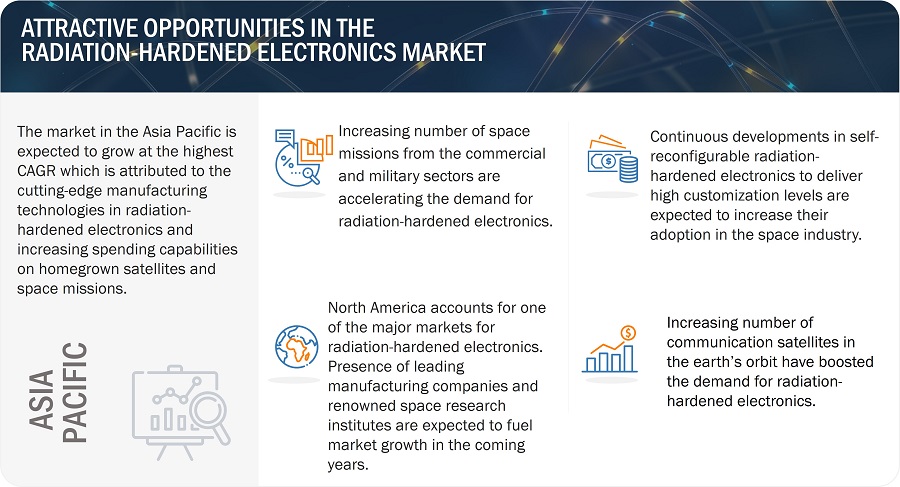
Radiation Hardened Electronics Market

Radiation Hardened Electronics Market

Radiation Hardened Electronics Market Forecast to 2029

To know about the assumptions considered for the study, Request for Free Sample Report

Radiation-Hardened Electronics Market Dynamics

Driver: Increasing intelligence, surveillance, and reconnaissance (ISR) activities.

Intelligence, surveillance, and reconnaissance (ISR) operations are increasing by the day in the defence industry to stay one step ahead of enemies and allies. Any ISR operation can be successful if high-quality, reliable, and environmentally acceptable end products are used. Hence, the latest processors, controllers, and electronic equipment are preferred for space, maritime, and military applications during ISR operations. The electronic equipment must survive highly challenging environments for an average of 15 years without degrading its performance and power, especially for space operations.

Restraint: Difficulties in creating a real testing environment

One of the restraints associated with these radiation-hardened components is the creation of a testing environment that can actually represent space, a nuclear war, or a defence environment. Real environments expose electronics to a complex mix of radiation types, energies, and intensities. Replicating this mix accurately in a testing lab is difficult and often requires multiple sources and techniques.

Opportunity: Increasing demand for commercial-off-the-shelf components in space satellite

The role of commercial off-the-shelf (COTS) products in satellites and other space applications is significant as the demand for low-cost nanosatellites is growing. COTS components can be used for small satellites that are mission specific. COTS solutions offer improved time-to-market and cost-saving features for various low earth orbit satellites, space rovers and robots, launchers, and other applications. These products are based on solid architecture and provide peripherals, such as ETHERNET and CAN.

Challenge: Customized requirements from high-end consumers

Different applications encounter varying radiation intensities and types. Customization ensures components withstand the specific radiation profile of the target environment, optimizing performance and cost-effectiveness. For example, a deep-space probe needs higher tolerance than a medical device used in low-dose radiation therapy.

Radiation-Hardened Electronics Market Map:
Radiation-hardened  Electronics Market by Map

Processors & controllers component will hold significant market share in radiation-hardened electronics market during the forecast period

Processors and controllers play a crucial role in synchronizing, directing, and controlling components and ensuring that they function accurately. Any failure in processors or controllers can risk the entire space mission. Hence, it is imperative that processors can withstand the space environment and the effects of radiation. Spacecraft system designers are also adopting radiation-hardened FPGAs to obtain high-speed data communication and improved on-board data processing in the extreme space environment

RHBP is expected to grow at a significant CAGR during the forecast period

The RHBP technique uses the IC fabrication process and modifications to harden electronic components. RHBP tackles the radiation head-on by creating transistor bodies that are less sensitive to degrading effects. The technique can be widely used wherein there is not much demand for radiation-hardened components because manufacturers need to modify their IC fab for huge volume production, which is a time-consuming and expensive process.

The commercial-off-the-shelf product type segment is expected to dominate the radiation-hardened electronics market from 2024 to 2029

Radiation-hardened electronics are increasingly being adopted by commercial small satellites and military satellites. The space industry is also continuously booming with NASA deep space missions, mega-constellations of small satellites, etc., which are demanding microelectronics with high reliability and low-cost benefits. This can be achieved through COTS devices as they can be replaced with pin-out compatible ceramic packages, which offer the same functionality as the original device. This helps to achieve significant cost savings and reduces the risk and development time.

Radiation hardened electronics market in China is expected to maintain the highest CAGR in Asia Pacific region share during 2024

China has made significant progress in the space industry, has a nearly complete range of satellite launch vehicles, and can accomplish various space missions. These include remote sensing satellites with various resolutions, covering various spectrums, satellite navigation systems, communication satellites, robust human spaceflight, and the lunar exploration program. These government initiatives are also expected to benefit developments in military space technology. For instance, in March 2022, China launched a classified military remote-sensing satellite. It is expected to be used for surveying land resources, crop yield estimation, urban planning, and disaster prevention. These new space programs are expected to propel the demand for radiation-hardened electronics in the region.
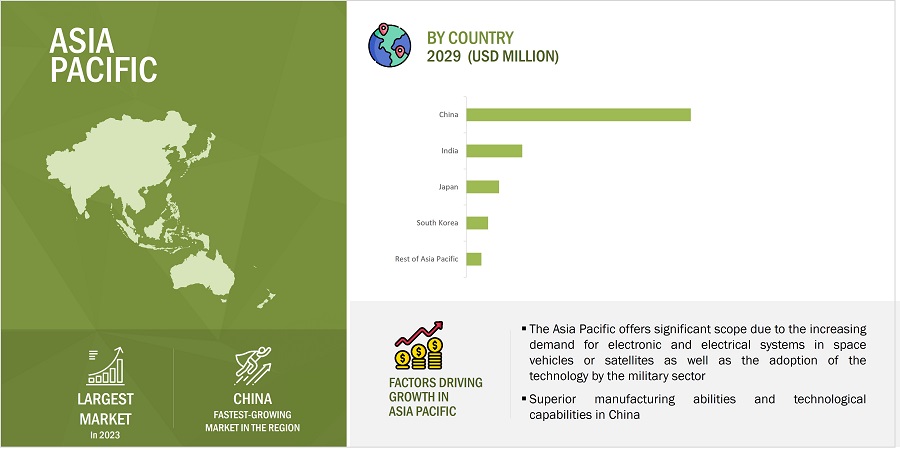
Radiation Hardened Electronics Market
 by Region

Radiation Hardened Electronics Market by Region

To know about the assumptions considered for the study, download the pdf brochure

Key Market Players

Key players in the radiation-hardened electronics companies are Microchip Technology Inc.(US), BAE Systems (UK), Renesas Electronics Corporation (Japan), Infineon Technologies AG (Germany), STMicroelectronics (Switzerland), AMD (US), Texas Instruments Incorporated (US), Honeywell International Inc. (US), Teledyne Technologies Inc. (US), and TTM Technologies, Inc. (US). SMEs/startups covered in the study are Cobham Limited (UK), Analog Devices, Inc (US), Data Devices Corporation (US), 3D Plus (France), Mercury Systems, Inc. (US), PCB Piezotronics, Inc (US), Vorago Technologies  (US), Micropac Industries, Inc (US), GSI technology, Inc (US), Everspin Technologies Inc (US), Semiconductor Components Industries, LLC (US), AiTech (US), Microelectronics Research Development Corporation (US), Space Micro, Inc (US), and Triad Semiconductor ( US).

Radiation-Hardened Electronics Market Report Scope:

Report Metric

Details

Market size available for years

2020–2029

Base year considered

2023

Forecast period

2024–2029

Forecast units

Thousand/Million/Billion

Segments Covered

Component, Manufacturing Technique, Product Type, Application, and Region

Geographies covered

Asia Pacific, Europe, North America, and the Rest of the World

Companies covered

The key players operating in the radiation-hardened electronics market are Microchip Technology Inc.(US), BAE Systems (UK), Renesas Electronics Corporation (Japan), Infineon Technologies AG (Germany), STMicroelectronics (Switzerland), AMD (US), Texas Instruments (US), Honeywell International Inc. (US), Teledyne Technologies (US), TTM Technologies, Inc. (US), Cobham (UK), Analog Devices, Inc.(US), Data Device Corporation (DDC) (US), 3D Plus (France), Mercury Systems Inc (US), PCB Piezotronics (US), Vorago Technologies (US), Micropac Industries (US), GSI Technology (US), Everspin Technologies (US), Semiconductor Components Industries (US), Aitech (US), Microelectronics Research Development Corporation (US), Space Micro (US), Triad Semiconductor (US).

Radiation Hardened Electronics Market Highlights

This report categorizes the Radiation Hardened Electronics Market based on Component, Manufacturing Technique, Product Type, Application, and Region.

Segment

Subsegment

By Component:

  • Mixed Signal ICs
  • Processors & Controllers
  • Memory
  • Power Management

By Manufacturing Technique:

  • Radiation-Hardening by Design (RHBD)
  • Radiation-Hardening by Process (RHBP)

By Product Type:

  • Commercial-off-the-Shelf (COTS)
  • Custom Made

By Application:

  • Space
  • Aerospace & Defense
  • Nuclear Power Plant
  • Medical
  • Others

By Region:

  • North America
    • US
    • Canada
    • Mexico
  • Europe
    • UK
    • Germany
    • France
    • Rest of Europe
  • Asia Pacific
    • China
    • India
    • Japan
    • South Korea
    • Rest of Asia Pacific
  • RoW
    • Middle East & Africa
    • GCC
    • South America

Recent Developments

  • In January 2024, Infineon Technologies AG unveiled radiation-hardened asynchronous static random-access memory (SRAM) chips for space applications. Using RADSTOP technology, these chips are designed with proprietary methods for enhanced radiation hardness, ensuring high reliability and performance in harsh environments.
  • In October 2023, Teledyne e2v collaborated with Microchip Technology to develop a pioneering space computing reference design, featuring Microchip's Radiation-Tolerant Gigabit Ethernet PHYs. The innovative design focuses on high-speed data routing in space applications, presented at the EDHPC 2023.
  • In September 2023, Microchip Technology Inc. launched the MPLAB Machine Learning Development Suite, a comprehensive solution supporting 8-bit, 16-bit, and 32-bit MCUs, and 32-MPUs for efficient ML at the edge. The integrated workflow streamlines ML model development across Microchip's product portfolio
  • In September 2023, Infineon Technologies collaborated with Chinese firm Infypower in the new energy vehicle charger market, providing industry-leading 1200 V CoolSiC MOSFET power semiconductors. This partnership aimed to enhance efficiency in electric vehicle charging stations, offering wide constant power range, high density, minimal interference, and high reliability for Infypower's 30 kW DC charging module.

Critical questions answered by this report:

To speak to our analyst for a discussion on the above findings, click Speak to Analyst

TABLE OF CONTENTS
 
1 INTRODUCTION (Page No. - 32)
    1.1 STUDY OBJECTIVES 
    1.2 MARKET DEFINITION 
           1.2.1 MARKETS COVERED
                    FIGURE 1 MARKET SEGMENTATION
    1.3 REGIONAL SCOPE 
           1.3.1 YEARS CONSIDERED
           1.3.2 INCLUSIONS AND EXCLUSIONS
    1.4 CURRENCY 
    1.5 STAKEHOLDERS 
    1.6 SUMMARY OF CHANGES 
    1.7 LIMITATIONS 
    1.8 RECESSION IMPACT 
 
2 RESEARCH METHODOLOGY (Page No. - 36)
    2.1 RESEARCH DATA 
           FIGURE 2 PROCESS FLOW: RADIATION-HARDENED ELECTRONICS MARKET ESTIMATION
           FIGURE 3 RESEARCH DESIGN
           2.1.1 SECONDARY AND PRIMARY RESEARCH
                    2.1.1.1 Key industry insights
           2.1.2 SECONDARY DATA
                    2.1.2.1 List of key secondary sources
                    2.1.2.2 Key data from secondary sources
           2.1.3 PRIMARY DATA
                    2.1.3.1 Breakdown of primaries
                    2.1.3.2 Key data from primary sources
    2.2 MARKET SIZE ESTIMATION 
           2.2.1 BOTTOM-UP APPROACH
                    2.2.1.1 Approach to obtain market size using bottom-up analysis (demand side)
                               FIGURE 4 MARKET SIZE ESTIMATION METHODOLOGY: BOTTOM-UP APPROACH
           2.2.2 TOP-DOWN APPROACH
                    2.2.2.1 Approach to capture market size using top-down analysis
                               FIGURE 5 MARKET SIZE ESTIMATION METHODOLOGY: TOP-DOWN APPROACH
    2.3 DATA TRIANGULATION 
           FIGURE 6 DATA TRIANGULATION
    2.4 RESEARCH ASSUMPTIONS 
    2.5 LIMITATIONS 
    2.6 RISK ASSESSMENT 
    2.7 APPROACH TO ANALYZE IMPACT OF RECESSION ON MARKET 
 
3 EXECUTIVE SUMMARY (Page No. - 47)
    3.1 RADIATION-HARDENED ELECTRONICS MARKET: RECESSION IMPACT 
           FIGURE 7 RECESSION IMPACT ON MARKET, 2020–2029 (USD MILLION)
           FIGURE 8 POWER MANAGEMENT SEGMENT TO ACCOUNT FOR LARGEST SHARE, BY COMPONENT, DURING FORECAST PERIOD
           FIGURE 9 RADIATION-HARDENED BY DESIGN – FASTEST SEGMENT DURING FORECAST PERIOD
           FIGURE 10 SPACE APPLICATION TO GROW AT HIGHEST CAGR IN MARKET FROM 2024 TO 2029
           FIGURE 11 NORTH AMERICA ACCOUNTED FOR LARGEST MARKET SHARE IN 2023
 
4 PREMIUM INSIGHTS (Page No. - 51)
    4.1 ATTRACTIVE GROWTH OPPORTUNITIES IN RADIATION-HARDENED ELECTRONICS MARKET 
           FIGURE 12 INCREASING DEMAND FOR RADIATION-HARDENED ELECTRONICS IN COMMERCIAL SATELLITES EXPECTED TO PROPEL MARKET GROWTH
    4.2 MARKET, BY COMPONENT 
           FIGURE 13 POWER MANAGEMENT SEGMENT TO ACCOUNT FOR LARGEST SHARE FROM 2024 TO 2029
    4.3 MARKET, BY MANUFACTURING TECHNIQUE 
           FIGURE 14 RADIATION-HARDENED BY DESIGN SEGMENT TO DOMINATE MARKET FROM 2024 TO 2029
    4.4 MARKET, BY PRODUCT TYPE 
           FIGURE 15 COTS SEGMENT TO LEAD MARKET WITH MAJOR SHARE THROUGH 2029
    4.5 MARKET, BY APPLICATION 
           FIGURE 16 SPACE SEGMENT TO COMMAND LARGEST SHARE OF MARKET IN 2024
    4.6 MARKET, BY COUNTRY AND REGION 
           FIGURE 17 MARKET IN CHINA TO GROW AT HIGHEST CAGR FROM 2024 TO2029
 
5 MARKET OVERVIEW (Page No. - 55)
    5.1 INTRODUCTION 
    5.2 EVOLUTION: RADIATION-HARDENED ELECTRONICS MARKET 
           FIGURE 18 EVOLUTION OF RADIATION-HARDENED ELECTRONICS TECHNOLOGY
    5.3 MARKET DYNAMICS 
           FIGURE 19 DRIVERS, RESTRAINTS, OPPORTUNITIES, AND CHALLENGES: MARKET
           5.3.1 DRIVERS
                    FIGURE 20 DRIVERS FOR MARKET AND THEIR IMPACT
                    5.3.1.1 Rising intelligence, surveillance, and reconnaissance (ISR) activities
                    5.3.1.2 Technology advancements in multicore processors used for military and space applications
                    5.3.1.3 Increasing demand for use in commercial satellites
                    5.3.1.4 Proliferation of electronic systems that can withstand severe nuclear environments
           5.3.2 RESTRAINTS
                    FIGURE 21 RESTRAINTS IN MARKET AND THEIR IMPACT
                    5.3.2.1 Difficulties in creating real testing environments
                    5.3.2.2 High costs associated with development of radiation-hardened products
           5.3.3 OPPORTUNITIES
                    FIGURE 22 OPPORTUNITIES IN MARKET AND THEIR IMPACT
                    5.3.3.1 Increasing space missions globally
                    5.3.3.2 Demand for reconfigurable radiation-hardened electronics
                    5.3.3.3 Rising demand for commercial-off-the-shelf components in space satellites
           5.3.4 CHALLENGES
                    FIGURE 23 CHALLENGES IN RADIATION-HARDENED ELECTRONICS MARKET AND THEIR IMPACT
                    5.3.4.1 Customization requirements from high-end consumers
    5.4 TRENDS/DISRUPTIONS IMPACTING CUSTOMERS 
           FIGURE 24 REVENUE SHIFT FOR RADIATION-HARDENED ELECTRONICS
    5.5 PRICING ANALYSIS 
           5.5.1 AVERAGE SELLING PRICE OF POWER MANAGEMENT PRODUCTS
           FIGURE 25 AVERAGE SELLING PRICE OF POWER MANAGEMENT PRODUCTS
           5.5.2 POWER MANAGEMENT
                    TABLE 1 AVERAGE SELLING PRICE ANALYSIS OF KEY PLAYERS
           5.5.3 MIXED SIGNAL ICS
                    TABLE 2 AVERAGE SELLING PRICE OF A/D & D/A CONVERTERS
           5.5.4 PROCESSORS & CONTROLLERS
                    TABLE 3 AVERAGE SELLING PRICE OF PROCESSORS & CONTROLLERS
           5.5.5 MEMORY
                    TABLE 4 AVERAGE SELLING PRICE OF MEMORY PRODUCTS
    5.6 SUPPLY/VALUE CHAIN ANALYSIS 
           FIGURE 26 VALUE CHAIN ANALYSIS: MAJOR VALUE ADDED DURING MANUFACTURING, FABRICATION & PACKAGING AND INTERFACING & SOFTWARE DEVELOPMENT
    5.7 ECOSYSTEM/MARKET MAP 
           FIGURE 27 MARKET: ECOSYSTEM
           TABLE 5 MARKET: ECOSYSTEM
    5.8 INVESTMENT AND FUNDING SCENARIO 
           FIGURE 28 FUNDS AUTHORIZED BY COMPANIES IN RADIATION-HARDENED ELECTRONICS MARKET
    5.9 TECHNOLOGY ANALYSIS 
           5.9.1 DEVELOPMENT OF PLASTIC PACKAGING FOR SPACE-GRADE ELECTRONICS
           5.9.2 SMART CHIPSETS FOR SATELLITES
           5.9.3 ADVANCED PACKAGING OF SPACE ELECTRONICS
    5.10 PORTER’S FIVE FORCES ANALYSIS 
           TABLE 6 RADIATION-HARDENED ELECTRONICS MARKET: PORTER’S FIVE FORCES ANALYSIS
           5.10.1 INTENSITY OF COMPETITIVE RIVALRY
           5.10.2 BARGAINING POWER OF SUPPLIERS
           5.10.3 BARGAINING POWER OF BUYERS
           5.10.4 THREAT OF SUBSTITUTES
           5.10.5 THREAT OF NEW ENTRANTS
    5.11 KEY STAKEHOLDERS & BUYING CRITERIA 
           5.11.1 KEY STAKEHOLDERS IN BUYING PROCESS
                    FIGURE 29 INFLUENCE OF STAKEHOLDERS ON BUYING PROCESS FOR TOP THREE INDUSTRIES
                    TABLE 7 INFLUENCE OF STAKEHOLDERS ON BUYING PROCESS FOR TOP THREE INDUSTRIES
           5.11.2 BUYING CRITERIA
                    FIGURE 30 KEY BUYING CRITERIA FOR TOP THREE INDUSTRIES
                    TABLE 8 KEY BUYING CRITERIA FOR TOP THREE INDUSTRIES
    5.12 CASE STUDY ANALYSIS 
           TABLE 9 ASSESSMENT OF 90 MM PROCESS HARDENING TECHNIQUE
           TABLE 10 ASSESSMENT OF 4MBIT MRAM DEVICE IN SATELLITES
           TABLE 11 ASSESSMENT OF RADIATION-HARDENED BY DESIGN MICROELECTRONICS
           TABLE 12 ASSESSMENT OF ARM MCUS FOR SPACE CONDITIONS
           TABLE 13 ASSESSMENT OF SSDS FOR LOW EARTH ORBIT SATELLITES
    5.13 TRADE ANALYSIS 
           5.13.1 IMPORT SCENARIO
                    FIGURE 31 IMPORTS, BY KEY COUNTRY, 2019–2022 (USD THOUSAND)
           5.13.2 EXPORT SCENARIO
                    FIGURE 32 EXPORTS, BY KEY COUNTRY, 2019–2022 (USD THOUSAND)
    5.14 PATENT ANALYSIS 
           FIGURE 33 TOP 10 COMPANIES WITH HIGHEST NUMBER OF PATENT APPLICATIONS IN LAST 10 YEARS
           TABLE 14 TOP 20 PATENT OWNERS IN LAST 10 YEARS
           FIGURE 34 NUMBER OF PATENTS GRANTED PER YEAR FROM 2013 TO 2023
           TABLE 15 LIST OF MAJOR PATENTS
    5.15 KEY CONFERENCES & EVENTS DURING 2024–2025 
           TABLE 16 RADIATION-HARDENED ELECTRONICS MARKET: CONFERENCES & EVENTS
    5.16 REGULATORY LANDSCAPE 
           5.16.1 REGULATORY BODIES, GOVERNMENT AGENCIES, AND OTHER ORGANIZATIONS
                    TABLE 17 NORTH AMERICA: REGULATORY BODIES, GOVERNMENT AGENCIES, AND OTHER ORGANIZATIONS
                    TABLE 18 EUROPE: REGULATORY BODIES, GOVERNMENT AGENCIES, AND OTHER ORGANIZATIONS
                    TABLE 19 ASIA PACIFIC: REGULATORY BODIES, GOVERNMENT AGENCIES, AND OTHER ORGANIZATIONS
                    TABLE 20 REST OF THE WORLD: REGULATORY BODIES, GOVERNMENT AGENCIES, AND OTHER ORGANIZATIONS
           5.16.2 STANDARDS AND REGULATIONS RELATED TO MARKET
                    5.16.2.1 North America
                               5.16.2.1.1 US
                                             5.16.2.1.1.1 MIL-STD-750D
                                             5.16.2.1.1.2 MIL-STD-750F
                                             5.16.2.1.1.3 Radiation Hardness Assurance SSB1_005
                                             5.16.2.1.1.4 MIL-STD-975M (NASA)
                               5.16.2.1.2 Canada
                                             5.16.2.1.2.1 Radiation Emitting Devices Regulations (C.R.C., c. 1370)
                    5.16.2.2 Europe
                               5.16.2.2.1 ECSS-Q-60-01A
                               5.16.2.2.2 ECSS-Q-ST-60-15C
                               5.16.2.2.3 ECSS-Q-HB-60-02A
                    5.16.2.3 Asia Pacific
                               5.16.2.3.1 India
                                             5.16.2.3.1.1 IS:1885
                               5.16.2.3.2 Japan
                                             5.16.2.3.2.1 Japan Product Safety Compliance
                                             5.16.2.3.2.2 JMR-001
 
6 MATERIAL SELECTION AND PACKAGING TYPES IN RADIATION-HARDENED ELECTRONICS MARKET (Page No. - 89)
    6.1 INTRODUCTION 
    6.2 MATERIAL SELECTION 
           6.2.1 SILICON
           6.2.2 SILICON CARBIDE (SIC)
           6.2.3 GALLIUM NITRIDE (GAN)
           6.2.4 GALLIUM ARSENIDE (GAAS)
    6.3 PACKAGING TYPES 
           6.3.1 FLIP-CHIP
           6.3.2 CERAMIC PACKAGES
 
7 RADIATION-HARDENED ELECTRONICS MARKET, BY COMPONENT (Page No. - 92)
    7.1 INTRODUCTION 
           FIGURE 35 POWER MANAGEMENT SEGMENT TO ACCOUNT FOR LARGEST SHARE DURING FORECAST PERIOD
           TABLE 21 MARKET, BY COMPONENT, 2020–2023 (USD MILLION)
           TABLE 22 MARKET, BY COMPONENT, 2024–2029 (USD MILLION)
    7.2 MIXED SIGNAL ICS 
           TABLE 23 MIXED SIGNAL DEVICES: RADIATION-HARDENED ELECTRONICS MARKET, BY TYPE, 2020–2023 (USD MILLION)
           TABLE 24 MIXED SIGNAL DEVICES: MARKET, BY TYPE, 2024–2029 (USD MILLION)
           TABLE 25 MIXED SIGNAL ICS: MARKET, BY MANUFACTURING TECHNIQUE, 2020–2023 (USD MILLION)
           TABLE 26 MIXED SIGNAL ICS: MARKET, BY MANUFACTURING TECHNIQUE, 2024–2029 (USD MILLION)
           TABLE 27 MIXED SIGNAL ICS: MARKET, BY PRODUCT TYPE, 2020–2023 (USD MILLION)
           TABLE 28 MIXED SIGNAL ICS: MARKET, BY PRODUCT TYPE, 2024–2029 (USD MILLION)
           7.2.1 RAD-HARD A/D AND D/A CONVERTERS
                    7.2.1.1 Increasing usage in space applications
           7.2.2 MULTIPLEXERS & RESISTORS
                    7.2.2.1 High demand for multiplexers in data acquisition systems
    7.3 PROCESSORS & CONTROLLERS 
           TABLE 29 PROCESSORS & CONTROLLERS: RADIATION-HARDENED ELECTRONICS MARKET, BY TYPE, 2020–2023 (USD MILLION)
           TABLE 30 PROCESSORS & CONTROLLERS: MARKET, BY TYPE, 2024–2029 (USD MILLION)
           TABLE 31 PROCESSORS & CONTROLLERS: MARKET, BY TYPE, 2020–2023 (THOUSAND UNITS)
           TABLE 32 PROCESSORS & CONTROLLERS: MARKET, BY TYPE, 2024–2029 (THOUSAND UNITS)
           TABLE 33 PROCESSORS & CONTROLLERS: MARKET, BY MANUFACTURING TECHNIQUE, 2020–2023 (USD MILLION)
           TABLE 34 PROCESSORS & CONTROLLERS: MARKET, BY MANUFACTURING TECHNIQUE, 2024–2029 (USD MILLION)
           TABLE 35 PROCESSORS & CONTROLLERS: MARKET, BY PRODUCT TYPE, 2020–2023 (USD MILLION)
           TABLE 36 PROCESSORS & CONTROLLERS: MARKET, BY PRODUCT TYPE, 2024–2029 (USD MILLION)
           7.3.1 MICROPROCESSOR UNITS (MPUS)
                    7.3.1.1 Developments in multicore processors for space & defense applications
           7.3.2 MICROCONTROLLER UNITS (MCUS)
                    7.3.2.1 Development of ARM-based microcontrollers for spacecraft subsystems
           7.3.3 APPLICATION-SPECIFIC INTEGRATED CIRCUITS (ASICS)
                    7.3.3.1 Increasing demand for highly customized design
           7.3.4 FPGAS
                    7.3.4.1 Help eliminate costs related to re-designing or manual updating
    7.4 MEMORY 
           TABLE 37 MEMORY: RADIATION-HARDENED ELECTRONICS MARKET, BY TYPE, 2020–2023 (USD MILLION)
           TABLE 38 MEMORY: MARKET, BY TYPE, 2024–2029 (USD MILLION)
           TABLE 39 MEMORY: MARKET, BY COMPONENT, 2020–2023 (USD MILLION)
           TABLE 40 MEMORY: MARKET, BY COMPONENT, 2024–2029 (USD MILLION)
           TABLE 41 MEMORY: MARKET, BY MANUFACTURING TECHNIQUE, 2020–2023 (USD MILLION)
           TABLE 42 MEMORY: MARKET, BY MANUFACTURING TECHNIQUE, 2024–2029 (USD MILLION)
           TABLE 43 MEMORY: MARKET, BY PRODUCT TYPE, 2020–2023 (USD MILLION)
           TABLE 44 MEMORY: MARKET, BY PRODUCT TYPE, 2024–2029 (USD MILLION)
           7.4.1 VOLATILE MEMORY
                    7.4.1.1 Dynamic Random-Access Memory (DRAM)
                               7.4.1.1.1 Low retention time expected to increase adoption in spacecraft
                    7.4.1.2 Static random-access memory (SRAM)
                               7.4.1.2.1 High adoption in image processing applications
           7.4.2 NON-VOLATILE MEMORY
                    7.4.2.1 Magnetoresistive random-access memory (MRAM)
                               7.4.2.1.1 Increasing developments in MRAM technologies for space environment
                    7.4.2.2 Flash
                               7.4.2.2.1 Increasing requirement for NOR flash memory in processing applications
                    7.4.2.3 Others (ReRAM, EEPROM, NVRAM)
    7.5 POWER MANAGEMENT 
           TABLE 45 POWER MANAGEMENT: RADIATION-HARDENED ELECTRONICS MARKET, BY COMPONENT, 2020–2023 (USD MILLION)
           TABLE 46 POWER MANAGEMENT: MARKET, BY COMPONENT, 2024–2029 (USD MILLION)
           TABLE 47 POWER MANAGEMENT: MARKET, BY MANUFACTURING TECHNIQUE, 2020–2023 (USD MILLION)
           TABLE 48 POWER MANAGEMENT: MARKET, BY MANUFACTURING TECHNIQUE, 2024–2029 (USD MILLION)
           TABLE 49 POWER MANAGEMENT: MARKET, BY PRODUCT TYPE, 2020–2023 (USD MILLION)
           TABLE 50 POWER MANAGEMENT: MARKET, BY PRODUCT TYPE, 2024–2029 (USD MILLION)
           7.5.1 MOSFETS
                    7.5.1.1 Increasing adoption for outer space applications
           7.5.2 DIODES
                    7.5.2.1 Integration of ceramic packaging technology to improve performance in space applications
           7.5.3 THYRISTORS
                    7.5.3.1 Increasing adoption in aerospace & defense applications
           7.5.4 IGBTS
                    7.5.4.1 High current density and low power dissipation drive adoption
    7.6 OTHERS (QUALITATIVE) 
 
8 RADIATION-HARDENED ELECTRONICS MARKET, BY MANUFACTURING TECHNIQUE (Page No. - 109)
    8.1 INTRODUCTION 
           FIGURE 36 RHBD SEGMENT TO LEAD MARKET DURING FORECAST PERIOD
           TABLE 51 MARKET, BY MANUFACTURING TECHNIQUE, 2020–2023 (USD MILLION)
           TABLE 52 MARKET, BY MANUFACTURING TECHNIQUE, 2024–2029 (USD MILLION)
    8.2 RADIATION-HARDENING BY DESIGN (RHBD) 
           TABLE 53 RHBD: MARKET, BY COMPONENT, 2020–2023 (USD MILLION)
           TABLE 54 RHBD: MARKET, BY COMPONENT, 2024–2029 (USD MILLION)
           TABLE 55 RHBD: MARKET, BY MIXED SIGNAL IC, 2020–2023 (USD MILLION)
           TABLE 56 RHBD: MARKET, BY MIXED SIGNAL IC, 2024–2029 (USD MILLION)
           TABLE 57 RHBD: MARKET, BY PROCESSOR & CONTROLLER, 2020–2023 (USD MILLION)
           TABLE 58 RHBD: MARKET, BY PROCESSOR & CONTROLLER, 2024–2029 (USD MILLION)
           TABLE 59 RHBD: MARKET, BY MEMORY, 2020–2023 (USD MILLION)
           TABLE 60 RHBD: MARKET, BY MEMORY, 2024–2029 (USD MILLION)
           TABLE 61 RHBD: MARKET, BY POWER MANAGEMENT, 2020–2023 (USD MILLION)
           TABLE 62 RHBD: MARKET, BY POWER MANAGEMENT, 2024–2029 (USD MILLION)
           8.2.1 TOTAL IONIZING DOSE
                    8.2.1.1 Long-term ionizing damage could result in malfunctioning of electronic components
           8.2.2 SINGLE EVENT EFFECT (SEE)
                    8.2.2.1 RHBD approach favored in space electronics
    8.3 RADIATION-HARDENING BY PROCESS (RHBP) 
           TABLE 63 RHBP: RADIATION-HARDENED ELECTRONICS MARKET, BY COMPONENT, 2020–2023 (USD MILLION)
           TABLE 64 RHBP: MARKET, BY COMPONENT, 2024–2029 (USD MILLION)
           TABLE 65 RHBP: MARKET, BY MIXED SIGNAL IC, 2020–2023 (USD MILLION)
           TABLE 66 RHBP: MARKET, BY MIXED SIGNAL IC, 2024–2029 (USD MILLION)
           TABLE 67 RHBP: MARKET, BY PROCESSOR & CONTROLLER, 2020–2023 (USD MILLION)
           TABLE 68 RHBP: MARKET, BY PROCESSOR & CONTROLLER, 2024–2029 (USD MILLION)
           TABLE 69 RHBP: MARKET, BY MEMORY, 2020–2023 (USD MILLION)
           TABLE 70 RHBP: MARKET, BY MEMORY, 2024–2029 (USD MILLION)
           TABLE 71 RHBP: MARKET, BY POWER MANAGEMENT, 2020–2023 (USD MILLION)
           TABLE 72 RHBP: MARKET, BY POWER MANAGEMENT, 2024–2029 (USD MILLION)
           8.3.1 SILICON ON INSULATOR (SOI)
                    8.3.1.1 Integration of SOI ICs in insulation layers provides benefits in high-radiation environments
           8.3.2 SILICON ON SAPPHIRE (SOS)
                    8.3.2.1 High resistance to radiation increases demand in aerospace and military applications
    8.4 RADIATION HARDENING BY SOFTWARE (RHBS) (QUALITATIVE) 
 
9 RADIATION-HARDENED ELECTRONICS MARKET, BY PRODUCT TYPE (Page No. - 120)
    9.1 INTRODUCTION 
           FIGURE 37 COTS SEGMENT TO HOLD LARGER SHARE AND REGISTER HIGHER CAGR DURING FORECAST PERIOD
           TABLE 73 MARKET, BY PRODUCT TYPE, 2020–2023 (USD MILLION)
           TABLE 74 MARKET, BY PRODUCT TYPE, 2024–2029 (USD MILLION)
    9.2 COMMERCIAL-OFF-THE-SHELF (COTS) 
           9.2.1 INCREASING ADOPTION IN COMMERCIAL AND MILITARY SATELLITES DUE TO LOW-COST BENEFITS
                    TABLE 75 COTS: MARKET, BY COMPONENT, 2020–2023 (USD MILLION)
                    TABLE 76 COTS: MARKET, BY COMPONENT, 2024–2029 (USD MILLION)
                    TABLE 77 COTS: MARKET, BY MIXED SIGNAL IC, 2020–2023 (USD MILLION)
                    TABLE 78 COTS: MARKET, BY MIXED SIGNAL IC, 2024–2029 (USD MILLION)
                    TABLE 79 COTS: MARKET, BY PROCESSOR & CONTROLLER, 2020–2023 (USD MILLION)
                    TABLE 80 COTS: MARKET, BY PROCESSOR & CONTROLLER, 2024–2029 (USD MILLION)
                    TABLE 81 COTS: MARKET, BY MEMORY, 2020–2023 (USD MILLION)
                    TABLE 82 COTS: MARKET, BY MEMORY, 2024–2029 (USD MILLION)
                    TABLE 83 COTS: MARKET, BY POWER MANAGEMENT, 2020–2023 (USD MILLION)
                    TABLE 84 COTS: MARKET, BY POWER MANAGEMENT, 2024–2029 (USD MILLION)
    9.3 CUSTOM-MADE 
           9.3.1 HIGH PREFERENCE IN DEFENSE MISSION-CRITICAL APPLICATIONS
                    TABLE 85 CUSTOM-MADE: RADIATION-HARDENED ELECTRONICS MARKET, BY COMPONENT, 2020–2023 (USD MILLION)
                    TABLE 86 CUSTOM-MADE: MARKET, BY COMPONENT, 2024–2029 (USD MILLION)
                    TABLE 87 CUSTOM-MADE: MARKET, BY MIXED SIGNAL IC, 2020–2023 (USD MILLION)
                    TABLE 88 CUSTOM-MADE: MARKET, BY MIXED SIGNAL IC, 2024–2029 (USD MILLION)
                    TABLE 89 CUSTOM-MADE: MARKET, BY PROCESSOR & CONTROLLER, 2020–2023 (USD MILLION)
                    TABLE 90 CUSTOM-MADE: MARKET, BY PROCESSOR & CONTROLLER, 2024–2029 (USD MILLION)
                    TABLE 91 CUSTOM-MADE: MARKET, BY MEMORY, 2020–2023 (USD MILLION)
                    TABLE 92 CUSTOM-MADE: MARKET, BY MEMORY, 2024–2029 (USD MILLION)
                    TABLE 93 CUSTOM-MADE: MARKET, BY POWER MANAGEMENT, 2020–2023 (USD MILLION)
                    TABLE 94 CUSTOM-MADE: MARKET, BY POWER MANAGEMENT, 2024–2029 (USD MILLION)
 
10 RADIATION-HARDENED ELECTRONICS MARKET, BY APPLICATION (Page No. - 129)
     10.1 INTRODUCTION 
             FIGURE 38 SPACE APPLICATION SEGMENT TO HOLD LARGEST SHARE AND REGISTER HIGHEST CAGR DURING FORECAST PERIOD
             TABLE 95 MARKET, BY APPLICATION, 2020–2023 (USD MILLION)
             TABLE 96 MARKET, BY APPLICATION, 2024–2029 (USD MILLION)
     10.2 SPACE 
             10.2.1 PROLIFERATION IN GLOBAL SPACE ECONOMY TO DRIVE GROWTH OPPORTUNITIES
                        TABLE 97 SPACE: MARKET, BY APPLICATION, 2020–2023 (USD MILLION)
                        TABLE 98 SPACE: MARKET, BY APPLICATION, 2024–2029 (USD MILLION)
                        TABLE 99 SPACE: MARKET, BY REGION, 2020–2023 (USD MILLION)
                        TABLE 100 SPACE: MARKET, BY REGION, 2024–2029 (USD MILLION)
             10.2.2 COMMERCIAL
                        10.2.2.1 Small satellites
                        10.2.2.2 New Space
                        10.2.2.3 Nanosatellites
             10.2.3 MILITARY
     10.3 AEROSPACE & DEFENSE 
             10.3.1 INCREASING FUNDING FOR MILITARY SECTOR IN EMERGING COUNTRIES TO DRIVE MARKET GROWTH
                        TABLE 101 AEROSPACE & DEFENSE: MARKET, BY APPLICATION, 2020–2023 (USD MILLION)
                        TABLE 102 AEROSPACE & DEFENSE: MARKET, BY APPLICATION, 2024–2029 (USD MILLION)
                        TABLE 103 AEROSPACE & DEFENSE: MARKET, BY REGION, 2020–2023 (USD MILLION)
                        TABLE 104 AEROSPACE & DEFENSE: MARKET, BY REGION, 2024–2029 (USD MILLION)
             10.3.2 WEAPONS AND MISSILES
             10.3.3 VEHICLES/AVIONICS
     10.4 NUCLEAR POWER PLANTS 
             10.4.1 RISE IN CONSTRUCTION OF NUCLEAR REACTORS FOR POWER GENERATION TO DRIVE MARKET GROWTH
                        TABLE 105 NUCLEAR POWER PLANTS: RADIATION-HARDENED ELECTRONICS MARKET, BY REGION, 2020–2023 (USD MILLION)
                        TABLE 106 NUCLEAR POWER PLANTS: MARKET, BY REGION, 2024–2029 (USD MILLION)
     10.5 MEDICAL 
             10.5.1 INTEGRATION OF EMI SHIELDING AND FILTERING IN IMPLANTABLE DEVICES TO BOOST GROWTH
             10.5.2 IMPLANTABLE MEDICAL DEVICES
                        TABLE 107 MEDICAL: MARKET, BY APPLICATION 2020–2023 (USD MILLION)
                        TABLE 108 MEDICAL: MARKET, BY APPLICATION, 2024–2029 (USD MILLION)
                        TABLE 109 MEDICAL: MARKET, BY REGION, 2020–2023 (USD MILLION)
                        TABLE 110 MEDICAL: MARKET, BY REGION, 2024–2029 (USD MILLION)
             10.5.3 RADIOLOGY
     10.6 OTHERS 
             TABLE 111 OTHER APPLICATIONS: MARKET, BY REGION, 2020–2023 (USD MILLION)
             TABLE 112 OTHER APPLICATIONS: MARKET, BY REGION, 2024–2029 (USD MILLION)
 
11 REGIONAL ANALYSIS (Page No. - 142)
     11.1 INTRODUCTION 
             FIGURE 39 REGIONAL SNAPSHOT: CHINA EXPECTED TO GROW AT HIGHEST CAGR DURING FORECAST PERIOD
             FIGURE 40 RADIATION-HARDENED ELECTRONICS MARKET, BY REGION
             TABLE 113 MARKET, BY REGION, 2020–2023 (USD MILLION)
             TABLE 114 MARKET, BY REGION, 2024–2029 (USD MILLION)
     11.2 NORTH AMERICA 
             FIGURE 41 NORTH AMERICA: MARKET SNAPSHOT
             TABLE 115 NORTH AMERICA: MARKET, BY COUNTRY, 2020–2023 (USD MILLION)
             TABLE 116 NORTH AMERICA: MARKET, BY COUNTRY, 2024–2029 (USD MILLION)
             11.2.1 US
                        11.2.1.1 Increase in space missions from government and private agencies to drive demand
             11.2.2 CANADA
                        11.2.2.1 Ongoing developments in satellites expected to drive market
             11.2.3 MEXICO
                        11.2.3.1 Growing economy and increasing urban mobility increase demand for satellites
             11.2.4 IMPACT OF RECESSION ON MARKET IN NORTH AMERICA
     11.3 EUROPE 
             FIGURE 42 EUROPE: RADIATION-HARDENED ELECTRONICS MARKET SNAPSHOT
             TABLE 117 EUROPE: MARKET, BY COUNTRY, 2020–2023 (USD MILLION)
             TABLE 118 EUROPE: MARKET, BY COUNTRY, 2024–2029 (USD MILLION)
             11.3.1 UK
                        11.3.1.1 Increasing initiatives by government and private entities in space sector to fuel market growth
             11.3.2 GERMANY
                        11.3.2.1 Proliferation in national space programs to boost demand for radiation-hardened electronics
             11.3.3 FRANCE
                        11.3.3.1 Increasing partnerships in space industry to increase competitiveness of France in European Union
             11.3.4 REST OF EUROPE
             11.3.5 IMPACT OF RECESSION ON MARKET IN EUROPE
     11.4 ASIA PACIFIC 
             FIGURE 43 ASIA PACIFIC: MARKET SNAPSHOT
             TABLE 119 ASIA PACIFIC: MARKET, BY COUNTRY, 2020–2023 (USD MILLION)
             TABLE 120 ASIA PACIFIC: MARKET, BY COUNTRY, 2024–2029 (USD MILLION)
             11.4.1 CHINA
                        11.4.1.1 Advancements in space missions expected to drive market
             11.4.2 INDIA
                        11.4.2.1 Increasing developments by ISRO to drive market
             11.4.3 JAPAN
                        11.4.3.1 Involvement of private space companies in government space programs to boost market
             11.4.4 SOUTH KOREA
                        11.4.4.1 Private-public investments in infrastructure, industrial, commercial, military, space, and defense projects – key driver
             11.4.5 REST OF ASIA PACIFIC
             11.4.6 IMPACT OF RECESSION ON MARKET IN ASIA PACIFIC
     11.5 REST OF THE WORLD (ROW) 
             TABLE 121 ROW: RADIATION-HARDENED ELECTRONICS MARKET, BY REGION, 2020–2023 (USD MILLION)
             TABLE 122 ROW: MARKET, BY REGION, 2024–2029 (USD MILLION)
             11.5.1 GULF COOPERATION COUNCIL (GCC)
                        11.5.1.1 Proliferation of satellite operations to drive market
             11.5.2 SOUTH AMERICA
                        11.5.2.1 Tie-ups with foreign agencies for space missions to propel market growth
             11.5.3 REST OF MIDDLE EAST AND AFRICA
                        11.5.3.1 Increasing investments by governments to boost market growth
             11.5.4 RECESSION IMPACT ON MARKET IN REST OF MIDDLE EAST AND AFRICA
 
12 COMPETITIVE LANDSCAPE (Page No. - 159)
     12.1 INTRODUCTION 
     12.2 KEY PLAYER STRATEGIES 
             TABLE 123 KEY PLAYER STRATEGIES
     12.3 MARKET REVENUE ANALYSIS 
             FIGURE 44 RADIATION-HARDENED ELECTRONICS MARKET: REVENUE ANALYSIS OF TOP FIVE PLAYERS, 2020–2022
     12.4 MARKET SHARE ANALYSIS 
             FIGURE 45 MARKET SHARE ANALYSIS, 2023
             TABLE 124 DEGREE OF COMPETITION, MARKET (2023)
             TABLE 125 MARKET RANKING ANALYSIS
     12.5 VALUATION AND FINANCIAL METRICS IN MARKET 
             FIGURE 46 EV/EBITDA OF KEY VENDORS
     12.6 BRAND/PRODUCT COMPARATIVE ANALYSIS 
             FIGURE 47 MARKET: TOP TRENDING BRAND/PRODUCTS
     12.7 COMPANY EVALUATION MATRIX 
             12.7.1 STARS
             12.7.2 EMERGING LEADERS
             12.7.3 PERVASIVE PLAYERS
             12.7.4 PARTICIPANTS
                        FIGURE 48 MARKET: TOP COMPANY EVALUATION QUADRANT, 2023
     12.8 RADIATION-HARDENED ELECTRONICS MARKET: COMPANY FOOTPRINT (15 COMPANIES) 
             TABLE 126 COMPANY FOOTPRINT
             TABLE 127 COMPANY COMPONENT FOOTPRINT (15 COMPANIES)
             TABLE 128 COMPANY APPLICATION FOOTPRINT (15 COMPANIES)
             TABLE 129 COMPANY REGION FOOTPRINT (15 COMPANIES)
             TABLE 130 COMPANY PRODUCT TYPE FOOTPRINT (15 COMPANIES)
             TABLE 131 COMPANY MANUFACTURING TECHNIQUE FOOTPRINT (15 COMPANIES)
     12.9 STARTUP/SME EVALUATION QUADRANT, 2023 
             12.9.1 PROGRESSIVE COMPANIES
             12.9.2 RESPONSIVE COMPANIES
             12.9.3 DYNAMIC COMPANIES
             12.9.4 STARTING BLOCKS
                        FIGURE 49 MARKET, STARTUP/SME EVALUATION QUADRANT, 2023
     12.1 COMPETITIVE BENCHMARKING 
             TABLE 132 RADIATION-HARDENED ELECTRONICS MARKET: KEY STARTUPS/SMES
             TABLE 133 MARKET: COMPETITIVE BENCHMARKING OF KEY STARTUPS/SMES
     12.11 COMPETITIVE SCENARIOS AND TRENDS 
             12.11.1 PRODUCT LAUNCHES/DEVELOPMENTS
                        TABLE 134 MARKET: PRODUCT LAUNCHES/DEVELOPMENTS, 2021–2024
             12.11.2 DEALS
                        TABLE 135 MARKET: DEALS, 2021–2024
             12.11.3 OTHERS
                        TABLE 136 MARKET: OTHER DEALS, 2021–2024
 
13 COMPANY PROFILES (Page No. - 182)
     13.1 KEY PLAYERS 
(Business Overview, Products/Solutions/Services Offered, Recent Developments, MnM view (Key strengths/Right to win, Strategic choices made, Weakness/competitive threats)*  
             13.1.1 MICROCHIP TECHNOLOGY INC.
                        TABLE 137 MICROCHIP TECHNOLOGY INC.: BUSINESS OVERVIEW
                        FIGURE 50 MICROCHIP TECHNOLOGY INC.: COMPANY SNAPSHOT
                        TABLE 138 MICROCHIP TECHNOLOGY INC.: PRODUCTS/SOLUTIONS/SERVICES OFFERED
                        TABLE 139 MICROCHIP TECHNOLOGY INC.: PRODUCT LAUNCHES
                        TABLE 140 MICROCHIP TECHNOLOGY INC.: DEALS
                        TABLE 141 MICROCHIP TECHNOLOGY INC.: OTHERS
             13.1.2 BAE SYSTEMS
                        TABLE 142 BAE SYSTEMS: BUSINESS OVERVIEW
                        FIGURE 51 BAE SYSTEMS: COMPANY SNAPSHOT
                        TABLE 143 BAE SYSTEMS: PRODUCTS/SOLUTIONS/SERVICES OFFERED
                        TABLE 144 BAE SYSTEMS: PRODUCT LAUNCHES
                        TABLE 145 BAE SYSTEMS: DEALS
                        TABLE 146 BAE SYSTEMS: OTHERS
             13.1.3 RENESAS ELECTRONICS CORPORATION
                        TABLE 147 RENESAS ELECTRONICS CORPORATION: BUSINESS OVERVIEW
                        FIGURE 52 RENESAS ELECTRONICS CORPORATION: COMPANY SNAPSHOT
                        TABLE 148 RENESAS ELECTRONICS CORPORATION: PRODUCTS/SOLUTIONS/SERVICES OFFERED
                        TABLE 149 RENESAS ELECTRONICS CORPORATION: PRODUCT LAUNCHES
                        TABLE 150 RENESAS ELECTRONICS CORPORATION: DEALS
                        TABLE 151 RENESAS ELECTRONICS CORPORATION: OTHERS
             13.1.4 INFINEON TECHNOLOGIES AG
                        TABLE 152 INFINEON TECHNOLOGIES AG: BUSINESS OVERVIEW
                        FIGURE 53 INFINEON TECHNOLOGIES AG: COMPANY SNAPSHOT
                        TABLE 153 INFINEON TECHNOLOGIES AG: PRODUCTS/SOLUTIONS/SERVICES OFFERED
                        TABLE 154 INFINEON TECHNOLOGIES AG: PRODUCT LAUNCHES
                        TABLE 155 INFINEON TECHNOLOGIES AG: DEALS
                        TABLE 156 INFINEON TECHNOLOGIES AG: OTHERS
             13.1.5 STMICROELECTRONICS
                        TABLE 157 STMICROELECTRONICS: BUSINESS OVERVIEW
                        FIGURE 54 STMICROELECTRONICS: COMPANY SNAPSHOT
                        TABLE 158 STMICROELECTRONICS: PRODUCTS/SOLUTIONS/SERVICES OFFERED
                        TABLE 159 STMICROELECTRONICS: PRODUCT LAUNCHES
                        TABLE 160 STMICROELECTRONICS: DEALS
             13.1.6 ADVANCED MICRO DEVICES, INC (AMD)
                        TABLE 161 ADVANCED MICRO DEVICES, INC: BUSINESS OVERVIEW
                        FIGURE 55 ADVANCED MICRO DEVICES, INC: COMPANY SNAPSHOT
                        TABLE 162 ADVANCED MICRO DEVICES, INC: PRODUCTS/SOLUTIONS/SERVICES OFFERED
                        TABLE 163 ADVANCED MICRO DEVICES, INC: PRODUCT LAUNCHES
                        TABLE 164 ADVANCED MICRO DEVICES, INC: DEALS
             13.1.7 TEXAS INSTRUMENTS INCORPORATED
                        TABLE 165 TEXAS INSTRUMENTS INCORPORATED: BUSINESS OVERVIEW
                        FIGURE 56 TEXAS INSTRUMENTS INCORPORATED: COMPANY SNAPSHOT
                        TABLE 166 TEXAS INSTRUMENTS INCORPORATED: PRODUCTS/SOLUTIONS/SERVICES OFFERED
                        TABLE 167 TEXAS INSTRUMENTS INCORPORATED: PRODUCT LAUNCHES
                        TABLE 168 TEXAS INSTRUMENTS INCORPORATED: DEALS
                        TABLE 169 TEXAS INSTRUMENTS INCORPORATED: DEALS
             13.1.8 HONEYWELL INTERNATIONAL INC.
                        TABLE 170 HONEYWELL INTERNATIONAL INC.: BUSINESS OVERVIEW
                        FIGURE 57 HONEYWELL INTERNATIONAL INC.: COMPANY SNAPSHOT
                        TABLE 171 HONEYWELL INTERNATIONAL INC.: PRODUCTS/SOLUTIONS/SERVICES OFFERED
                        TABLE 172 HONEYWELL INTERNATIONAL INC.: PRODUCT LAUNCHES
                        TABLE 173 HONEYWELL INTERNATIONAL INC.: DEALS
                        TABLE 174 HONEYWELL INTERNATIONAL INC.: OTHERS
             13.1.9 TELEDYNE TECHNOLOGIES INC.
                        TABLE 175 TELEDYNE TECHNOLOGIES INC.: BUSINESS OVERVIEW
                        FIGURE 58 TELEDYNE TECHNOLOGIES INC.: COMPANY SNAPSHOT
                        TABLE 176 TELEDYNE TECHNOLOGIES INC.: PRODUCTS/SOLUTIONS/SERVICES OFFERED
                        TABLE 177 TELEDYNE TECHNOLOGIES INC.: PRODUCT LAUNCHES
                        TABLE 178 TELEDYNE TECHNOLOGIES INC.: DEALS
                        TABLE 179 TELEDYNE TECHNOLOGIES INC.: OTHERS
             13.1.10 TTM TECHNOLOGIES, INC.
                        TABLE 180 TTM TECHNOLOGIES, INC.: BUSINESS OVERVIEW
                        FIGURE 59 TTM TECHNOLOGIES, INC.: COMPANY SNAPSHOT
                        TABLE 181 TTM TECHNOLOGIES, INC.: PRODUCTS/SOLUTIONS/SERVICES OFFERED
                        TABLE 182 TTM TECHNOLOGIES, INC.: OTHERS
     13.2 OTHER PLAYERS 
             13.2.1 COBHAM LIMITED
             13.2.2 ANALOG DEVICES, INC
             13.2.3 DATA DEVICE CORPORATION
             13.2.4 3D PLUS
             13.2.5 MERCURY SYSTEMS, INC.
             13.2.6 PCB PIEZOTRONICS, INC.
             13.2.7 VORAGO TECHNOLOGIES
             13.2.8 MICROPAC INDUSTRIES, INC.
             13.2.9 GSI TECHNOLOGY, INC.
             13.2.10 EVERSPIN TECHNOLOGIES INC
             13.2.11 SEMICONDUCTOR COMPONENTS INDUSTRIES, LLC (ON SEMICONDUCTOR)
             13.2.12 AITECH
             13.2.13 MICROELECTRONICS RESEARCH DEVELOPMENT CORPORATION
             13.2.14 SPACE MICRO INC
             13.2.15 TRIAD SEMICONDUCTOR
*Details on Business Overview, Products/Solutions/Services Offered, Recent Developments, MnM view (Key strengths/Right to win, Strategic choices made, Weakness/competitive threats)* might not be captured in case of unlisted companies.  
 
14 APPENDIX (Page No. - 253)
     14.1 DISCUSSION GUIDE 
     14.2 KNOWLEDGESTORE: MARKETSANDMARKETS’ SUBSCRIPTION PORTAL 
     14.3 CUSTOMIZATION OPTIONS 
     14.4 RELATED REPORTS 
     14.5 AUTHOR DETAILS 
 

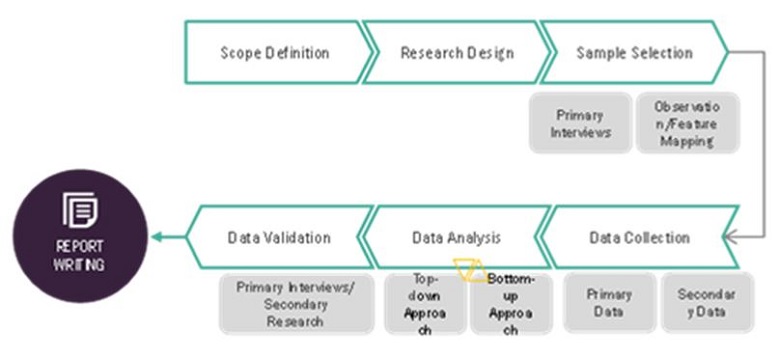
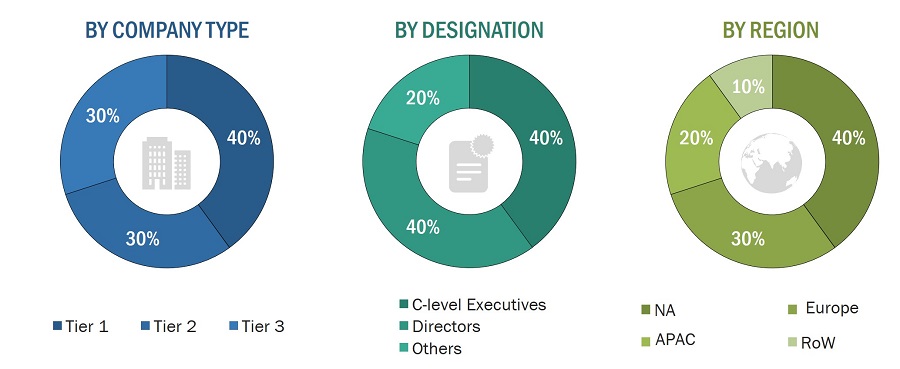
The study involved four major activities in estimating the size of the radiation-hardened electronics market. Exhaustive secondary research has been done to collect information on the market, peer market, and parent market. Validation of these findings, assumptions, and sizing with industry experts across the value chain through primary research has been the next step. Both top-down and bottom-up approaches have been employed to estimate the global market size. After that, market breakdown and data triangulation have been used to estimate the market sizes of segments and subsegments.

Secondary Research

Secondary sources that were referred to for this research study include corporate filings (such as annual reports, investor presentations, and financial statements), trade, business, and professional associations, white papers, certified publications, articles from recognized authors, directories, and databases. Secondary data was collected and analyzed to arrive at the overall market size, further validated by primary research.

Primary Research

Extensive primary research was conducted after understanding and analyzing the radiation-hardened electronics market scenario through the secondary research process. Several primary interviews were conducted with key opinion leaders from both the demand- and supply-side vendors across four major regions—North America, Asia Pacific, Europe, and RoW (including the Middle East, Africa, and South America). After interacting with industry experts, brief sessions were conducted with highly experienced independent consultants to reinforce the findings from our primary. This, along with the in-house subject matter experts’ opinions, has led us to the findings as described in the remainder of this report.
Radiation Hardened Electronics Market
 Size, and Share

To know about the assumptions considered for the study, download the pdf brochure

Market Size Estimation

In the complete market engineering process, both top-down and bottom-up approaches have been used, along with several data triangulation methods, to estimate and forecast the size of the market and its segments and subsegments listed in the report. Extensive qualitative and quantitative analyses have been carried out on the complete market engineering process to list the key information/insights pertaining to the radiation-hardened electronics market.

The key players in the market have been identified through secondary research, and their rankings in the respective regions have been determined through primary and secondary research. This entire procedure involved the study of the annual and financial reports of top players, as well as interviews with industry experts such as chief executive officers, vice presidents, directors, and marketing executives for both, quantitative and qualitative key insights. All percentage shares, splits, and breakdowns have been determined using secondary sources and verified through primary sources. All parameters that affect the markets covered in this research study have been accounted for, viewed in extensive detail, verified through primary research, and analyzed to obtain the final quantitative and qualitative data. This data has been consolidated and enhanced with detailed inputs and analysis from MarketsandMarkets and presented in this report.

Radiation Hardened Electronics Market: Bottom-Up Approach

Radiation Hardened Electronics Market
 Size, and Bottom-Up Approach

Data Triangulation

After arriving at the overall size of the radiation-hardened electronics market from the market size estimation process explained above, the total market has been split into several segments and subsegments. The market breakdown and data triangulation procedures have been employed, wherever applicable, to complete the overall market engineering process and arrive at the exact statistics for all segments and subsegments. The data was triangulated by studying various factors and trends from both the demand and supply sides. Along with this, the market size has been validated using the top-down and bottom-up approaches.

Market Definition

Radiation hardening is the development of electronic components and systems that are resistant to destruction or failures caused by ionizing radiation (particle radiation and high-energy electromagnetic radiation) occurring in outer space, high-altitude flights, around nuclear reactors, particle accelerators, during nuclear accidents, or nuclear warfare. Most semiconductor electronic components are susceptible to damage by radiation; radiation-hardened components are based on their hardened equivalents, with some design and manufacturing variations that reduce their susceptibility to damage by radiation.

Key Stakeholders

  • Associations and Regulatory Authorities Related to Radiation-hardened Electronics.
  • Government Bodies, Venture Capitalists, and Private Equity Firms
  • Original Equipment Manufacturers (OEMs)
  • Semiconductor Component Suppliers
  • Radiation-hardened Equipment Distributors and Sales Firms
  • Software Solution Providers
  • System Integrators for Radiation-hardened Electronic Components
  • Research Institutes and Organizations

Report Objectives

  • To define, describe, and forecast the radiation-hardened electronics market size by component, manufacturing techniques, product type, and application in terms of value.
  • To describe and forecast the size of the radiation-hardened electronics market across 4 regions, namely, North America, Europe, Asia Pacific, and the Rest of the World, along with their respective country-level market sizes.
  • To analyze the material selection and packaging types utilized in the market.
  • To provide detailed information regarding the drivers, restraints, opportunities, and challenges influencing the market growth
  • To provide a comprehensive overview of the value chain of the market ecosystem
  • To strategically analyze micromarkets1 with respect to individual growth trends, prospects, and contributions to the overall market size
  • To analyze opportunities for stakeholders by identifying high-growth segments of the radiation-hardened electronics market
  • To strategically profile the key players and comprehensively analyze their market positions in terms of their ranking and core competencies.
  • To analyze competitive developments, such as product launches, deals (mergers, acquisitions, joint ventures, and investments), and others (expansions), in the radiation-hardened electronics market

Available Customizations

With the given market data, MarketsandMarkets offers customizations according to the specific requirements of companies. The following customization options are available for the report:

Company Information

  • Detailed analysis and profiling of 25 market players
Custom Market Research Services

We will customize the research for you, in case the report listed above does not meet with your exact requirements. Our custom research will comprehensively cover the business information you require to help you arrive at strategic and profitable business decisions.

Request Customization

Instant Answers with GPT - Ask Now!

Ask real questions. Get complete answers !
Report Code
SE 2934
Published ON
Feb, 2024
Choose License Type
BUY NOW
  • SHARE
X
Request Customization
Speak to Analyst
Speak to Analyst
OR FACE-TO-FACE MEETING
PERSONALIZE THIS RESEARCH
  • Triangulate with your Own Data
  • Get Data as per your Format and Definition
  • Gain a Deeper Dive on a Specific Application, Geography, Customer or Competitor
  • Any level of Personalization
REQUEST A FREE CUSTOMIZATION
LET US HELP YOU!
  • What are the Known and Unknown Adjacencies Impacting the Radiation Hardened Electronics Market
  • What will your New Revenue Sources be?
  • Who will be your Top Customer; what will make them switch?
  • Defend your Market Share or Win Competitors
  • Get a Scorecard for Target Partners
CUSTOMIZED WORKSHOP REQUEST
+1-888-600-6441
  • Call Us
  • +1-888-600-6441 (Corporate office hours)
  • +1-888-600-6441 (US/Can toll free)
  • +44-800-368-9399 (UK office hours)
CONNECT WITH US
ABOUT TRUST ONLINE
©2024 MarketsandMarkets Research Private Ltd. All rights reserved
DMCA.com Protection Status Website Feedback