Radio Access Network Market by Communication Infrastructure (Small Cell, Macro Cell, RAN Equipment, DAS), Connectivity Technology (2G, 3G, 4G/LTE, 5G), Deployment Location (Urban, Rural, Residential, Retail Stores), and Geography - Global Forecast to 2023


Updated on : September 11 , 2023
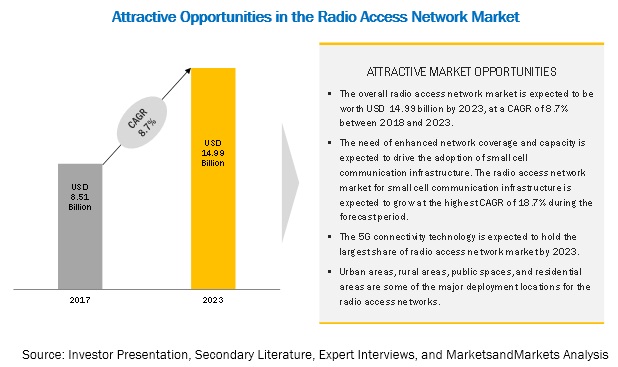
The radio access network market was valued USD 8.51 billion in 2017 and is projected to reach USD 14.99 billion by 2023, at a CAGR of 8.7% between 2018 and 2023.
By communication infrastructure, the radio access market for small cell is expected to grow at the highest growth rate during the forecast period
The radio access network market for small cell is expected to grow at the highest CAGR of 18.7% to be worth USD 6.45 billion in 2023. The small cells infrastructure is estimated to hold 43.0% share of the total market by 2023. The market for small cells is gaining traction due to its attractiveness in terms of cost-efficiency and easy deployment. Mobile operators are facing a challenge while providing high data transfer rate services. To accomplish this, the mobile network operators are mainly focusing on enhancing their network. To address these needs, operators are developing and deploying small cells at a faster pace and on a high scale. The demand for mobile data services is expected to grow exponentially during the forecast period, which would be driven by video streaming, photo sharing, and increasing use of online mobile applications. The adoption of small cells would increase at a faster pace to meet the increasing consumer demand, as small cells help increase the network capacity and therefore aids in network densification.
By connectivity technology, 5G is expected to hold the largest market size during the forecast period
The radio access network market for the 5G connectivity technology is expected to be valued at USD 7.02 billion by 2023, at the highest CAGR of 48.6% during the forecast period. The market for the 5G connectivity technology would be driven by the proliferating demand for wireless broadband services, which require fast and high-capacity networks. The development of the 5G connectivity technology has been undertaken to address the growing demand for high-speed data communication. Address the demand for high-speed data connectivity would lead to the need for the related network infrastructure, which would drive the radio access network market.
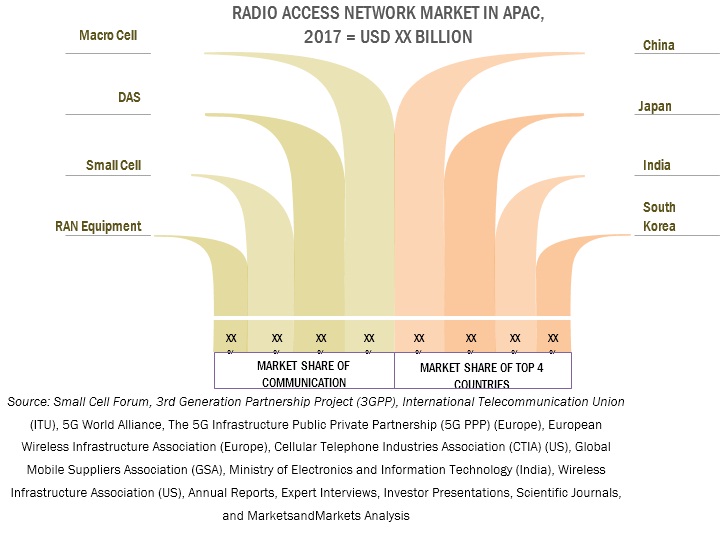
APAC is expected to grow at the highest rate during the forecast period.
The factors such as increasing automation in various sectors, adoption of Internet of Things (IoT), and increasing cellular M2M connections, and high demand for on-demand video services would drive the radio access network market in the region. The market in APAC is expected to grow at the highest growth rate during the forecast period. The region has become the center of attraction for major investments and business expansion opportunities. The companies such as ZTE (China) and Huawei (China) are heavily investing on the upcoming 5G technology and are initiating field trials together with some of the leading mobile service carriers, such as AT&T (US), China Mobile (China), SoftBank (Japan), and China Unicom (China). Moreover, the increasing number of devices connected with the advanced technologies such as the Internet of Things (IoT) and machine-to-machine communication would require faster connectivity, which is likely to lead to the high CAGR of the market in this region during the forecast period.
Radio Access Network Market Dynamics
Driver : Growing demand for improved network coverage
The network carriers are looking to improve the network coverage to meet the rising demand for the high-speed Internet and large network coverage for various emerging end-use applications, such as autonomous driving, augmented reality, and telemedicine. Applications such as autonomous driving require high network availability along with high speed and low latency of less than 1 millisecond. Initial the deployments of LTE networks were based on homogeneous networks, which consist of base stations that provide basic coverage, called macro base stations. However, now the concept of heterogeneous networks is gaining attention, which can be used to optimize performance for the unequal user or traffic distribution.
Heterogeneous networks consist of a mix of macro cells, remote radio heads, and low-power nodes, such as picocells, femtocells, and relays. With the introduction of heterogeneous networks, the concept of small cell is gaining traction as the carriers see it as the way to meet the network coverage and capacity in heavily populated areas having high traffic density. The growing demand for higher Internet bandwidth from the consumers would lead to the implementation of small cells and also drive the network provider companies. Moreover, the network infrastructure market would be driven by the increasing demand for mobile broadband technology, high-speed data transfer rate, and data and information processing.
Restraint: Spectrum crunch and delay in the standardization of spectrum allocation
Mobile networks are undergoing numerous technological changes, which is causing a tremendous increase in the data traffic. The growth in data traffic is primarily due to the increasing number of mobile subscribers, particularly smartphone users, who connect their devices to faster networks and consume high network bandwidth. To meet the consumer demand, mobile operators are investing in new generations of mobile technologies, such as 4G and 5G, and are establishing a greater number of cellular base stations. In addition to the network upgrades, mobile operators also need access to a broad spectrum. High demand for capacity is impacting the availability of spectrum and has created a crunch. Based on traffic growth estimates, 600–800 MHz of additional spectrum needs to be made available by 2020 for mobile broadband use to meet the increasing consumer demand. However, presently, the network operators must focus on cost-effective alternatives to maximize the use of limited spectrum.
In addition to solving the issue of spectrum crunch, spectrum allocation also needs to be standardized. For the development and implementation of infrastructure for mobile networks such as LTE and 5G, wireless operators should be given access to the spectrum that is already used for telecommunications services and government applications, among others. As of now, different regulations are being imposed by different government agencies across all regions for spectrum allocation. For instance, Ofcom (UK), a communications regulator in the UK, has suggested the allocation of 6 GHz frequency band for upcoming 5G network infrastructure, while Federal Communications Commission (FCC) has allocated frequencies from ~24 GHz for the same in the US. This irregularity in spectrum allocation and the delay for agreement on spectrum use are the factors hampering the development of advanced networks.
Opportunity : Increase in demand for network infrastructure due to Internet of Things (IOT)
The Internet of Things (IoT) allows physical and virtual objects to connect with each other and exchange data and information. IoT is an ever-growing network of physical objects that feature an IP address for the internet connectivity and communications occurring between these objects and with the other internet-enabled devices and systems. IoT is enhancing the technological landscape across all verticals, and the organizations are seeking ways to improve their operations amid the process of evolution. To reach a new level of efficiency, accuracy, and cost-savings, organizations need real-time visibility and intelligence in their organizational and operational data. The increasing demand for operational efficiency and cost-saving would make IoT a dominant model for various organizations in the future. According to Cisco (US), 500 billion devices and objects would be connected to the Internet by 2030, generating a large volume of data that would need proper management and analysis. This huge amount of data would lead to the increased demand for advanced network infrastructure for the expanding data capacity and coverage density with small cells and distributed antenna systems. In future, the network would have huge wireless components, and there will be many cell sites to serve the growing demand of customers.
Challenge: Interference in Cell Sites
Interference in cellular networks is the common problem with the radio access network. Interfere in cell sites are due to the improper conductivity of passive devices such as connectors, cables, or antennae. This internal interference can generate intermodulation signals at the same frequency band as mobile transmitters. Moreover, another cause of interference in cellular networks is frequency refarming. Refarming is the process governing the repurposing of frequency bands, which were traditionally allocated for 2G mobile services, for a new generation of mobile technologies such as Universal Mobile Telecommunications Systems (UMTS) and Long-Term Evolution (LTE). As the current mobile technology is evolving to LTE, the operators are using frequency refarming to deliver high data rates for mobile devices while maintaining the spectra of the technologies such as wideband code division multiple access (WCMDA) and global system for mobile communication (GSM). The frequency refarming helps increase the adoption of LTE gradually, but the co-existence of various technologies in a narrow spectrum leads to the reuse of frequencies, which leads to internal interferences in radio access network. The simultaneity in a limited spectrum has driven mobile operators to reuse it, which leads to inferences. The current interference management systems are not capable of handling the interference problem. This has been proven to be the major challenge for the deployment of network infrastructure.
Radio Access Network Market Report Scope
|
Report Metric |
Details |
| Estimated Market Size | USD 8.51 Billion |
| Projected Market Size 2023 | USD 14.99 Billion |
| Growth Rate | 8.7% CAGR |
|
Market size available for years |
2015–2023 |
|
Base year considered |
2017 |
|
Forecast period |
2018–2022 |
|
Forecast units |
Million/Billion (USD) |
|
Segments covered |
|
|
Geographies covered |
|
|
Companies covered |
|
|
Top Companies in North America |
|
| Key Market Driver | Growing demand for improved network coverage |
| Key Market Opportunity | Increase in demand for network infrastructure due to Internet of Things (IOT) |
| Largest Growing Region | Asia Pacific |
| Largest Market Share Segment | 5G connectivity technology |
| Highest CAGR Segment | Retail stores |
The research report categorizes the Radio Access Network market to forecast the revenues and analyze the trends in each of the following sub-segments:
Radio Access Network Market, By Communication Infrastructure
- Small Cell
- Macro Cell
- RAN Equipment
- DAS
Radio Access Network Market, By Connectivity Technology
- 2G
- 3G
- 4G/LTE
- 5G
Radio Access Network Market, By Deployment Location
- Urban Areas
- Public Spaces
- Rural Areas
- Residential Areas
- Retail Stores (Supercenters & Hypercenters)
- Highways
- Large Enterprises
- Airport/Rail/Bus terminals
- Small & Medium Enterprises
- Hotel/Motels
- Others (Education and Healthcare Institutions)
Acoustic Wave Sensor Market, By Region
- North America
- Europe
- Asia Pacific (APAC)
- RoW
Key Market Players:
Huawei (China), Ericsson (Sweden), Nokia Networks (Finland), ZTE (China), Samsung (South Korea), NEC (Japan), Cisco (US), Qualcomm (US), Intel (US), Fujitsu (Japan), Juniper Networks (US), Hewlett Packard Enterprise (US), Corning (US), AT&T (US), Verizon Communications (US), Huber+Suhner (Switzerland), CommScope (US), Airspan Networks (US), Qorvo (US), and LG electronics (South Korea).
Huawei is the frontrunner among the network infrastructure providers, primarily, on the back of its R&D investment, product portfolio, market perception, and geographic reach. The company has R&D centers in 21 countries including China, the US, Canada, the UK, India, Russia, and Turkey. It is one of the major suppliers of network products to the operators across the globe. Its equipment has been a major part of LTE rollouts in China, Europe, East Asia, and many emerging markets. In terms of key business strategies in the radio access network market, the company considers collaboration important for its growth, in addition to product launch and continuous enhancements in its existing products and investments in R&D. In November 2017, the company announced the launch of the TubeStar, which is a macro base station solution. The TubeStar solution features 2 m2 footprint, which is 90% lower than that of traditional macro base stations. Moreover, the company is focused on the development of 5G infrastructure and is actively participating in the deployment of 5G solutions.
Recent Developments:
- In November 2017, Huawei announced the launch of TubeStar, which is a macro base station solution. The TubeStar solution features 2 m2 footprint, which is 90% lower than that of traditional macro base stations (30–60 m2). The solution targets high cost of urban macro site deployment, difficult acquisition of the site, and poor efficiency of deployment..
- In October 2017, Fujitsu Laboratories (Japan) announced the development of mmWave circuit technology for base stations. The technology would consume the same level of power as a Wi-Fi access point and deliver the high-speed communications in excess of 10 Gbps, as required by 5G communication.
- In August 2017, Fujitsu and Microsoft Japan (Japan) strengthened their alliance to promote the implementation of a global communications platform. Microsoft Japan provided technical assistance for Fujitsu's internal implementation of a global communications platform. The platform would help transform the customers work styles.
- In February 2017, Nokia and Intel (US) partnered to launch the 5G acceleration labs for the commercialization of the technology in the US and Finland. With these labs, the companies aim to accelerate the testing of 5G networks as well as develop the solutions to address the need of the 5G network.
- In August 2017, Qualcomm collaborated with the Industrial Technology Research Institute (ITRI) (Taiwan) to accelerate delivery and commercialization of 5G NR small cell products and its related infrastructure all over the world.
Critical questions the report answers:
- Where will all these developments take the industry in the long term?
- What are the upcoming trends for the Radio Access Network market?
- Which segment provides the most opportunity for growth?
- Who are the leading vendors operating in this market?
- What are the opportunities for new market entrants?
To speak to our analyst for a discussion on the above findings, click Speak to Analyst
Table of Contents
1 Introduction (Page No. - 13)
1.1 Objectives of Study
1.2 Definition
1.3 Scope of Study
1.3.1 Markets Covered
1.3.2 Years Considered for Study
1.4 Currency
1.5 Limitations
1.6 Stakeholders
2 Research Methodology (Page No. - 17)
2.1 Introduction
2.1.1 Secondary and Primary Research
2.1.1.1 Key Industry Insights
2.1.2 Secondary Data
2.1.2.1 List of Major Secondary Sources
2.1.2.2 Secondary Sources
2.1.3 Primary Data
2.1.3.1 Breakdown of Primaries
2.1.3.2 Key Data From Primary Sources
2.2 Market Size Estimation
2.2.1 Bottom-Up Approach
2.2.1.1 Approach for Capturing the Market Share By Bottom-Up Analysis (Demand Side)
2.2.2 Top-Down Approach
2.2.2.1 Approach for Capturing the Market Share By Top-Down Analysis (Supply Side)
2.3 Market Breakdown and Data Triangulation
2.4 Research Assumptions
3 Executive Summary (Page No. - 27)
4 Premium Insights (Page No. - 32)
4.1 Attractive Opportunities in Radio Access Network Market
4.2 Market in APAC, By Communication Infrastructure and Country
4.3 Market, By Communication Infrastructure
4.4 Market, By Connectivity Technology
4.5 Market, By Deployment Location
4.6 Market, By Geography
5 Market Overview (Page No. - 37)
5.1 Introduction
5.2 Market Dynamics
5.2.1 Drivers
5.2.1.1 Increasing Mobile Data Traffic
5.2.1.2 Growing Demand for Improved Network Coverage
5.2.1.3 Increased Adoption of Smartphones and Technological Advancements in the Telecommunications Industry
5.2.2 Restraints
5.2.2.1 Spectrum Crunch and Delay in the Standardization of Spectrum Allocation
5.2.3 Opportunities
5.2.3.1 Development of 5G Network
5.2.3.2 Increase in Demand for Network Infrastructure Due to Internet of Things (IoT)
5.2.4 Challenges
5.2.4.1 Interference in Cell Sites
5.2.4.2 Compatibility Issues Between Traditional Network Infrastructure and Next-Generation Network Infrastructure
5.3 Value Chain Analysis
5.4 Key Trends in Radio Access Network Market
5.4.1 Focus of Companies on Product Launches and Developments
5.4.2 Advancement of Networks By Using Virtualization and Software Technologies
6 Radio Access Network Market, By Communication Infrastructure (Page No. - 44)
6.1 Introduction
6.2 Small Cell
6.2.1 Microcell
6.2.2 Picocell
6.2.3 Femtocell
6.3 Macro Cell
6.4 RAN Equipment
6.5 DAS
7 Radio Access Network Market, By Connectivity Technology (Page No. - 59)
7.1 Introduction
7.2 2G
7.3 3G
7.4 4G/LTE
7.5 5G
8 Radio Access Network Market, By Deployment Location (Page No. - 69)
8.1 Introduction
8.2 Urban Areas
8.3 Public Spaces
8.4 Rural Areas
8.5 Residential Areas
8.6 Retail Stores (Supercenters & Hypercenters)
8.7 Highways
8.8 Large Enterprises
8.9 Small and Medium Enterprises
8.10 Hotels/Motels
8.11 Airport/Rail/Bus Terminals
8.12 Others
9 Geographic Analysis (Page No. - 90)
9.1 Introduction
9.2 North America
9.2.1 US
9.2.2 Canada
9.2.3 Mexico
9.3 Europe
9.3.1 UK
9.3.2 Germany
9.3.3 France
9.3.4 Rest of Europe
9.4 Asia Pacific
9.4.1 China
9.4.2 Japan
9.4.3 South Korea
9.4.4 India
9.4.5 Rest of APAC
9.5 Rest of the World
9.5.1 Middle East & Africa
9.5.2 South America
10 Competitive Landscape (Page No. - 113)
10.1 Overview
10.2 Market Ranking Analysis, 2017
10.3 Competitive Situations and Trends
10.3.1 Product Launches and Developments
10.3.2 Partnerships and Collaborations
10.3.3 Alliances and Agreements
10.3.4 Acquisitions and Others
11 Company Profiles (Page No. - 120)
(Business Overview, Products Offered, Recent Developments, SWOT Analysis, and MnM View)*
11.1 Key Players
11.1.1 Huawei
11.1.2 Ericsson
11.1.3 Nokia Networks
11.1.4 ZTE
11.1.5 Samsung
11.1.6 NEC
11.1.7 Cisco
11.1.8 Qualcomm
11.1.9 Intel
11.1.10 Fujitsu
11.2 Other Key Players
11.2.1 Juniper Networks
11.2.2 Hewlett Packard Enterprise (HPE)
11.2.3 Corning
11.2.4 AT&T
11.2.5 Verizon Communications
11.2.6 Huber+Suhner
11.2.7 Commscope
11.2.8 Airspan Networks
11.2.9 Qorvo
11.2.10 LG Electronics
*Details on Business Overview, Products Offered, Recent Developments, SWOT Analysis, and MnM View Might Not Be Captured in Case of Unlisted Companies.
12 Appendix (Page No. - 152)
12.1 Insights From Industry Experts
12.2 Discussion Guide
12.3 Knowledge Store: Marketsandmarkets’ Subscription Portal
12.4 Introducing RT: Real-Time Market Intelligence
12.5 Available Customizations
12.6 Related Report
12.7 Author Details
List of Tables (69 Tables)
Table 1 Expected 5G Network Deployments Worldwide
Table 2 Radio Access Network Market, By Communication Infrastructure, 2015–2023 (USD Billion)
Table 3 Market for Small Cell, By Deployment Location, 2015–2023 (USD Million)
Table 4 Radio Access Network Market for Small Cell, By Region, 2015–2023 (USD Million)
Table 5 Market for Small Cell, By Connectivity Technology, 2015–2023 (USD Million)
Table 6 Types of Base Stations
Table 7 Market for Macro Cell, By Deployment Location, 2015–2023 (USD Million)
Table 8 Market for Macro Cell, By Region, 2015–2023 (USD Million)
Table 9 Market for Macro Cell, By Connectivity Technology, 2015–2023 (USD Million)
Table 10 Market for RAN Equipment, By Deployment Location, 2015–2023 (USD Million)
Table 11 Radio Access Network Market for RAN Equipment, By Region, 2015–2023 (USD Million)
Table 12 Market for RAN Equipment, By Connectivity Technology, 2015–2023 (USD Million)
Table 13 Market for DAS, By Deployment Location, 2015–2023 (USD Million)
Table 14 Radio Access Network Market for DAS, By Region, 2015–2023 (USD Million)
Table 15 Market for DAS, By Connectivity Technology, 2015–2023 (USD Million)
Table 16 Radio Access Network Market, By Connectivity Technology, 2015–2023 (USD Billion)
Table 17 Market for 2G, By Communication Infrastructure, 2015–2023 (USD Million)
Table 18 Market for 2G, By Region, 2015–2023 (USD Million)
Table 19 Radio Access Network Market for 3G, By Communication Infrastructure, 2015–2023 (USD Million)
Table 20 Market for 3G, By Region, 2015–2023 (USD Million)
Table 21 Market for 4G/LTE, By Communication Infrastructure, 2015–2023 (USD Million)
Table 22 Market for 4G/LTE, By Region, 2015–2023 (USD Million)
Table 23 Market for 5G, By Communication Infrastructure, 2015–2023 (USD Million)
Table 24 Market for 5G, By Region, 2015–2023 (USD Million)
Table 25 Market, By Deployment Location, 2015–2023 (USD Million)
Table 26 Market for Urban Areas, By Communication Infrastructure, 2015–2023 (USD Million)
Table 27 Market for Urban Areas, By Region, 2015–2023 (USD Million)
Table 28 Market for Public Spaces, By Communication Infrastructure, 2015–2023 (USD Million)
Table 29 Market for Public Spaces, By Region, 2015–2023 (USD Million)
Table 30 Radio Access Network Market for Rural Areas, By Communication Infrastructure, 2015–2023 (USD Million)
Table 31 Market for Rural Areas, By Region, 2015–2023 (USD Million)
Table 32 Market for Residential Areas, By Communication Infrastructure, 2015–2023 (USD Million)
Table 33 Market for Residential Areas, By Region, 2015–2023 (USD Million)
Table 34 Radio Access Network Market for Retail Stores, By Communication Infrastructure, 2015–2023 (USD Million)
Table 35 Market for Retail Stores, By Region, 2015–2023 (USD Million)
Table 36 Market for Highways, By Communication Infrastructure, 2015–2023 (USD Million)
Table 37 Market for Highways, By Region, 2015–2023 (USD Million)
Table 38 Market for Large Enterprises, By Communication Infrastructure, 2015–2023 (USD Million)
Table 39 Market for Large Enterprises, By Region, 2015–2023 (USD Million)
Table 40 Market for Small and Medium Enterprises, By Communication Infrastructure, 2015–2023 (USD Million)
Table 41 Market for Small and Medium Enterprises, By Geography, 2015–2023 (USD Million)
Table 42 Market for Hotels/Motels, By Communication Infrastructure, 2015–2023 (USD Million)
Table 43 Market for Hotels/Motels, By Region, 2015–2023 (USD Million)
Table 44 Market for Airport/Rail/Bus Terminals, By Communication Infrastructure, 2015–2023 (USD Million)
Table 45 Market for Airport/Rail/Bus Terminals, By Region, 2015–2023 (USD Million)
Table 46 Market for Others, By Communication Infrastructure, 2015–2023 (USD Million)
Table 47 Market for Others, By Region, 2015–2023 (USD Million)
Table 48 Market, By Region, 2015–2023 (USD Billion)
Table 49 North American Radio Access Network , By Country, 2015–2023 (USD Million)
Table 50 Market, By Deployment Location, 2015–2023 (USD Million)
Table 51 Market, By Communication Infrastructure, 2015–2023 (USD Million)
Table 52 Market, By Connectivity Technology 2015–2023 (USD Million)
Table 53 Market, By Country, 2015–2023 (USD Million)
Table 54 Market, By Deployment Location, 2015–2023 (USD Million)
Table 55 Market, By Communication Infrastructure, 2015–2023 (USD Million)
Table 56 Market, By Connectivity Technology, 2015–2023 (USD Million)
Table 57 Market in APAC, By Country, 2015–2023 (USD Million)
Table 58 Market in APAC, By Deployment Location, 2015–2023 (USD Million)
Table 59 Market in APAC, By Communication Infrastructure, 2015–2023 (USD Million)
Table 60 Market in APAC, By Connectivity Technology, 2015–2023 (USD Million)
Table 61 Market in RoW, By Region, 2015–2023 (USD Million)
Table 62 Radio Access Network Market in RoW, By Deployment Location, 2015–2023 (USD Million)
Table 63 Market in RoW, By Communication Infrastructure, 2015–2023 (USD Million)
Table 64 Market in RoW, By Connectivity Technology, 2015–2023 (USD Million)
Table 65 Ranking of Key Players in Market, 2017
Table 66 Product Launches and Developments (2015–2017)
Table 67 Partnerships and Collaborations (2015–2017)
Table 68 Alliance and Agreements (2016–2017)
Table 69 Acquisitions and Others (2015–2017)
List of Figures (52 Figures)
Figure 1 Radio Access Network Market: Research Design
Figure 2 Market Size Estimation Methodology: Bottom-Up Approach
Figure 3 Market Size Estimation Methodology: Top-Down Approach
Figure 4 Assumptions for Research Study
Figure 5 Market for Small Cell to Grow at Highest CAGR During Forecast Period
Figure 6 5G to Hold Largest Size of Market in 2023
Figure 7 Market for Retail Stores to Grow at Highest CAGR During Forecast Period
Figure 8 Market in APAC to Grow at Highest CAGR During Forecast Period
Figure 9 Increasing Demand for Mobile Data to Propel Growth of Market During Forecast Period
Figure 10 China Held Largest Share of Market in APAC in 2017
Figure 11 Macro Cell Held Largest Share of Market for Communication Infrastructure in 2017
Figure 12 5G Expected to Hold Largest Share of Market By 2023
Figure 13 Urban Areas Deployment Location to Hold Largest Size of Market By 2023
Figure 14 US Held Largest Share of Market in 2017
Figure 15 Continuous Increase in Demand for Improved Network Coverage Would Drive the Market
Figure 16 Increase in Global Mobile Data Traffic From 2016 to 2021
Figure 17 Wireless Network Infrastructure Ecosystem: Value Chain Analysis
Figure 18 Market, By Communication Infrastructure
Figure 19 Small Cell Expected to Hold Largest Size of Market By 2023
Figure 20 Residential Areas to Hold Largest Size of Market for Small Cell Share During the Forecast Period
Figure 21 Market for Macro Cells for Urban Areas to Grow at Higher CAGR During Forecast Period
Figure 22 Urban Areas Deployment Location to Hold Largest Share of Market for DAS During Forecast Period
Figure 23 5G Connectivity Technology to Hold Largest Size of Market By 2023
Figure 24 North America Held Largest Size of Market for 2G in 2017
Figure 25 Market for Radio Access Network Based on 4G/LTE for Small Cell to Grow at Highest CAGR During Forecast Period
Figure 26 Small Cell to Dominate Market for 5G Connectivity Technology During Forecast Period
Figure 27 Market, By Deployment Location
Figure 28 Urban Areas Held Largest Share of Market in 2017
Figure 29 Market for Urban Area Deployment in APAC to Grow at Highest CAGR During Forecast Period
Figure 30 Macro Cell Held Largest Size of Market for Rural Areas in 2017
Figure 31 North America to Hold Largest Size of Market for Residential Area Deployment During Forecast Period
Figure 32 Market for Retail Store Deployment for Small Cell to Grow at Highest CAGR During Forecast Period
Figure 33 North America to Hold Largest Size of Market for Highways Deployment During Forecast Period
Figure 34 Market for Small Cell for Small and Medium Enterprises to Grow at Highest CAGR During Forecast Period
Figure 35 North America to Hold Largest Size of Market for Hotels/Motels During Forecast Period
Figure 36 North America to Hold Largest Size of Market for Airport/Rail/Bus Terminals During Forecast Period
Figure 37 Market, By Geography
Figure 38 Snapshot: Market in North America
Figure 39 Snapshot: Market in Europe
Figure 40 Snapshot: Market in APAC
Figure 41 Companies Adopted Product Launch and Development as Key Growth Strategies Between 2015 and 2017
Figure 42 Product Launch and Development Was Key Strategy Adopted By Players Between 2015 and 2017
Figure 43 Huawei: Business Overview
Figure 44 Ericsson: Company Snapshot
Figure 45 Nokia Networks: Company Snapshot
Figure 46 ZTE : Company Snapshot
Figure 47 Samsung: Company Snapshot
Figure 48 NEC: Company Snapshot
Figure 49 Cisco: Company Snapshot
Figure 50 Qualcomm: Company Snapshot
Figure 51 Intel: Company Snapshot
Figure 52 Fujitsu: Company Snapshot


Growth opportunities and latent adjacency in Radio Access Network Market