Retro-Reflective Materials Market by Technology (Microprismatic, Glass & Ceramic Beads), Product Type (Films, Paints), Application (Traffic & Work Zone, Conspicuity, Fleet & Vehicle Registration, Personal Safety), and Region - Global Forecast to 2023


[127 Pages Reports] Retro-reflective materials are materials that have the property of reflecting light to its source with minimum scattering. When illuminated by a light source, they help in perceiving the objects in low light or dark conditions. The retro-reflective materials are based on glass beads, micro prismatic, and ceramic beads technologies.
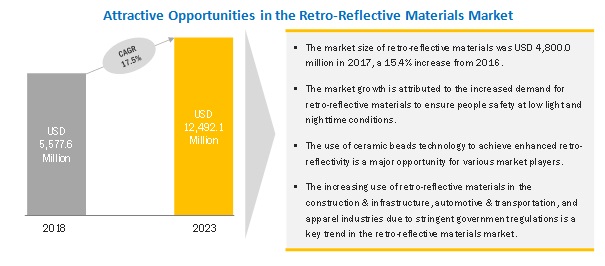
The retro-reflective materials market size is expected to reach USD 12,492.1 million by 2023, at a CAGR of 17.5% between 2018 and 2023. The demand for retro-reflective materials has gradually increased as these materials have no substitute, and they provide safety benefits. This demand for retro-reflective materials is also projected to grow, as the government organizations across the world are forming strict safety standards regarding the use of workwear that provides enhanced visibility in low light conditions.
By technology, micro prismatic technology to dominate the retro-reflective materials market
Based on technology, the retro-reflective materials market is segmented into micro prismatic, glass beads, and ceramic beads. The micro prismatic technology segment dominates the retro-reflective materials market. The use of this technology provides enhanced retro-reflectivity of materials. The micro prisms, when used in the retro-reflective materials, offer a minimum scattering of light and ensures maximum returning of the light back to its source.
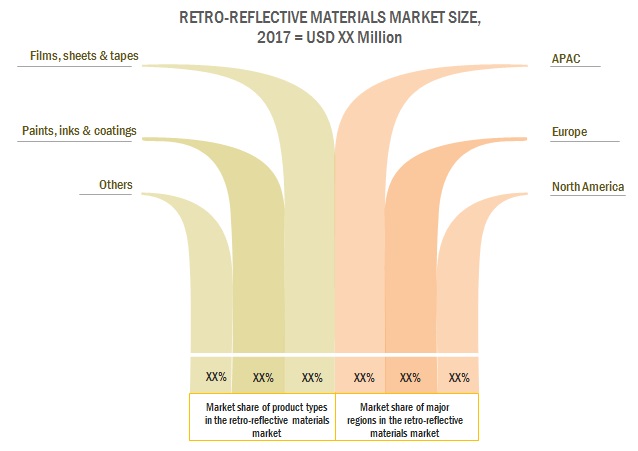
>By product type and region films, sheets & tapes were the largest product type of retro-reflective materials
Based on product types, the retro-reflective materials market is segmented into films, sheets & tapes, paints, inks & coatings, and others that include threads and fabrics. The films, sheets & tapes dominate the retro-reflective materials market in the product type segment. Films, sheets & tapes have a wide range of applications and are used in all the major industries such as apparel, construction & infrastructure, and automotive & transportation.
By application traffic control & work zone application to be the leading application of retro-reflective materials
The retro-reflective materials market is dominated by the traffic control & work zone application. Owing to the ability to provide enhanced visibility and safer navigation on roads in low light conditions, the use of retro-reflective materials has increased in the traffic control & work zone application. In the traffic control & work zone application, the use of retro-reflective materials is significant in various signboards, road markings, and work zone equipment.
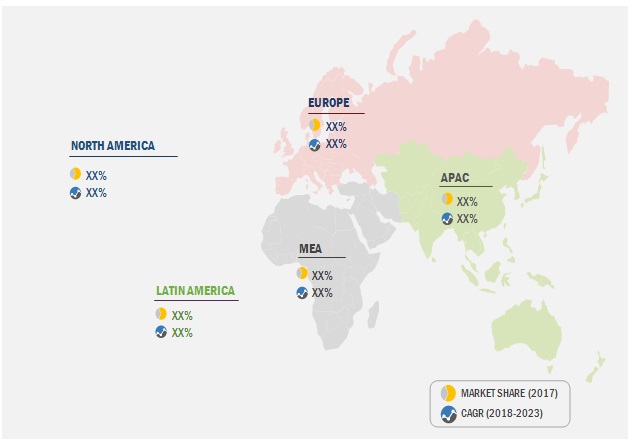
APAC to lead the retro-reflective materials during the forecast period
APAC is the largest market for retro-reflective materials. The high growth of industries such as automotive & transportation and construction & infrastructure has helped the region achieve a leading position in the global retro-reflective materials market. The region is also a potential market for retro-reflective materials, according to the key players such as 3M (US), ORAFOL (Germany), and Avery Dennison (US). The region has a high demand for retro-reflective materials for various purposes, such as safety apparels, road markings, signboards, and conspicuity markings, among others.
The essential strategies undertaken by the market players in the retro-reflective materials market are new product developments, acquisitions; partnerships; and expansions. The key players in the retro-reflective materials market are 3M (US), Avery Dennison (US), ORAFOL (Germany), Dominic Optical (China), Changzhou Hua R Sheng Reflective Material (China), Coats Group (UK), Nippon Carbide Industries (Japan), Paiho Group (Taiwan), Asian Paints PPG (India), and Reflomax (South Korea).
Market Dynamics
Driver: Large construction spending in developing economies
A significant share of revenue in the retro-reflective materials market is generated by the use of these materials in the construction & infrastructure industry, in applications such as road markings, signboards, and safety cones, among others. The construction & infrastructure industry is growing globally. For instance, according to the Indian Brand Equity Foundation (IBEF), 783 projects were undertaken by the Indian government in 2017, and the construction projects recorded a growth rate of 1.23% from 2016 to 2017. Such large projects undertaken by the government demand high consumption of retro-reflective paints for making markings on the highways to ensure traffic safety. These highways also require retro-reflective films, sheets & tapes for making signboards to navigate the drivers in low light or nighttime conditions. Such initiatives taken by the governments of the developing economies such as India, South Korea, and China, among others, have helped the retro-reflective materials market to grow gradually.
Restraint: Less awareness regarding safety products in developing economies
Stringent government regulations have been implemented by the governments of the developed economies in Europe and North America for the use of retro-reflective materials significantly in vehicle markings and safety apparel. These regulations imposed by the governments strictly monitor the service life of these materials. The retro-reflective materials are quickly replaced if they are found in torn, noticeably faded, soiled, cracked, burned, heavily abraded, or damaged conditions. However, in developing economies such as India, Brazil. Malaysia, Pakistan, and South Korea, the regulations are not yet that stringent as compared with the regulations in the developed economies. They mostly follow the standards imposed by the developed economies in Europe and North America for manufacturing safety vests, safety jackets, and vehicle markings. The shelf life and replacement of damaged retro-reflective products are also not taken seriously into consideration in the developing economies. The less awareness in the developing economies regarding safety products may pose a threat to the safety of people, thereby affecting the growth of the retro-reflective materials market.
Opportunity: Use of ceramic beads technology for enhanced retro-reflectivity
The retro-reflective materials market is dominated by the use of micro prismatic and glass beads technologies. The use of ceramic beads technology is an emerging trend in the retro-reflective materials market. The ceramic beads have a high reflective index and are more robust when compared with glass beads. They ensure enhanced retro-reflectivity in comparison to the glass beads. 3M (US), a leading player of the retro-reflective materials market, has increased its focus on the use of ceramic beads. 3M is using ceramic beads for pavement marking applications. The use of ceramic beads provides easy installation, durability, and enhanced performance in extreme weather conditions.
Challenge: Limited shelf life of retro-reflective products
Retro-reflective materials have a limited shelf-life. Retro-reflective products such as films, sheets & tapes provide performance durability of 2 to 10 years. However, continuous exposure of these films, sheets & tapes to high heat or extreme weather conditions further decreases their effective performance life. Also, the retro-reflective inks that are used on apparel have a shelf-life of only 12 months. These retro-reflective materials are, therefore, required to be changed periodically. This increases the purchase cost for end-users. The shelf-life of these materials, if improved, can increase the durability of the retro-reflective materials and can aid in the financial benefits of users.
Get online access to the report on the World's First Market Intelligence Cloud
- Easy to Download Historical Data & Forecast Numbers
- Company Analysis Dashboard for high growth potential opportunities
- Research Analyst Access for customization & queries
- Competitor Analysis with Interactive dashboard
- Latest News, Updates & Trend analysis
Request Sample Scope of the Report
Get online access to the report on the World's First Market Intelligence Cloud
- Easy to Download Historical Data & Forecast Numbers
- Company Analysis Dashboard for high growth potential opportunities
- Research Analyst Access for customization & queries
- Competitor Analysis with Interactive dashboard
- Latest News, Updates & Trend analysis

|
Report Metric |
Details |
|
Market size available for years |
2016�2023 |
|
Base year considered |
2017 |
|
Forecast period |
2018�2023 |
|
Forecast units |
Value (USD, million) |
|
Segments covered |
By technology, By product type, and By application |
|
Geographies covered |
North America, Europe, APAC, Latin America, MEA |
|
Companies covered |
3M (US), Avery Dennison (US), ORAFOL (Germany), Dominic Optical (China), Changzhou Hua R Sheng Reflective Material (China), Coats Group (UK), Nippon Carbide Industries (Japan), Paiho Group (Taiwan), Asian Paints PPG (India), and Reflomax (South Korea) |
This research report categorizes the retro-reflective materials market based on technology, product type, application, and region. It forecasts revenue growth and analyzes trends in each of these submarkets.
By Technology:
- Micro prismatic
- Glass Beads
- Ceramic Beads
By Product Type:
- Films, Sheets, & Tapes
- Paints, Inks, & Coatings
- Others
By Application:
- Traffic Control & Work Zone
- Conspicuity, & Fleet, & Vehicle Registration
- Personal Safety
- Others
By Region
- Asia Pacific (APAC)
- North America
- Europe
- Latin America
- Middle East & Africa (MEA)
Key Market Players
3M (US), Avery Dennison (US), ORAFOL (Germany), Changzhou Hua R Sheng Reflective Material (China), Coats Group (UK)
Recent Developments
- In October 2017, 3M acquired Scott Safety (US), which is a key manufacturer of innovative products that include self-contained breathing apparatus (SCBA) systems, gas and flame detection instruments, and other safety devices. The acquisition of this company has helped 3M broaden the product portfolio of its personal safety business division. Along with reflective materials, 3M also provides products and solutions such as head, eye, and face protection in the personal safety division.
- In August 2017, ORAFOL acquired a graphic distributor having a significant presence in Melbourne, Perth, and Adelaide (Australia). With such a vast presence, the acquired graphic distributor became the sole supplier of ORAFOL products catering to the retro-reflective and visual markets in Australia.
Key Questions Addressed by the Report
- What are the industry trends that would be seen over the next five years?
- Which vertical of the retro-reflective materials market is likely to lead the market during the forecast period?
- Which end-user segment is expected to witness the maximum growth during the forecast period?
- Which would be the leading region with the highest share in the retro-reflective materials market during the forecast period?
- How many companies implementing organic and inorganic strategies are expected to gain increased market share?
To speak to our analyst for a discussion on the above findings, click Speak to Analyst
Table of Contents
1 Introduction (Page No. - 13)
1.1 Objectives of the Study
1.2 Market Definition
1.3 Market Scope
1.3.1 Years Considered for the Study
1.4 Currency
1.5 Limitations
1.6 Stakeholders
2 Research Methodology (Page No. - 16)
2.1 Research Data
2.1.1 Secondary Data
2.1.1.1 Key Data From Secondary Sources
2.1.2 Primary Data
2.1.2.1 Key Data From Primary Sources
2.1.2.2 Key Industry Insights
2.1.2.3 Breakdown of Primary Interviews
2.2 Market Size Estimation
2.2.1 Bottom-Up Approach
2.2.2 Top-Down Approach
2.3 Data Triangulation
2.4 Research Assumptions
3 Executive Summary (Page No. - 23)
4 Premium Insights (Page No. - 27)
4.1 Attractive Opportunities in the Retro-Reflective Materials Market
4.2 Retro-Reflective Materials Market, By Technology
4.3 Retro-Reflective Materials Market, By Product Type and Region
4.4 Retro-Reflective Materials Market, By Application
4.5 Retro-Reflective Materials Market, By Country
5 Market Overview (Page No. - 30)
5.1 Market Dynamics
5.1.1 Drivers
5.1.1.1 Stringent Government Regulations Regarding Worker and Vehicle Safety
5.1.1.2 Increased Demand for Retro-Reflective Materials to Enhance Nighttime and Low Light Condition Visibility
5.1.1.3 Large Construction Spending in Developing Economies
5.1.2 Restraints
5.1.2.1 Low Retro-Reflectivity of Glass Beads
5.1.2.2 Less Awareness Regarding Safety Products in Developing Economies
5.1.3 Opportunities
5.1.3.1 Use of Ceramic Beads Technology for Enhanced Retro-Reflectivity
5.1.4 Challenges
5.1.4.1 Limited Shelf Life of Retro-Reflective Products
5.1.4.2 High Manufacturing Cost of Ceramic Beads and Microprismatic Technologies
5.2 Porter�s Five Forces Analysis
5.2.1 Threat of New Entrants
5.2.2 Threat of Substitutes
5.2.3 Bargaining Power of Suppliers
5.2.4 Bargaining Power of Buyers
5.2.5 Intensity of Competitive Rivalry
6 Macroeconomic Overview and Key Trends (Page No. - 37)
6.1 Introduction
6.2 Trends and Forecast of GDP
6.3 Per Capita GDP vs Per Capita Retro-Reflective Materials Demand
6.4 Trends of the Automotive Industry
6.5 Trends and Forecast of the Construction Industry
7 Retro-Reflective Materials Market, By Technology (Page No. - 46)
7.1 Introduction
7.2 Microprismatic Technology
7.3 Glass Beads Technology
7.4 Ceramic Beads Technology
8 Retro-Reflective Materials Market, By Product Type (Page No. - 51)
8.1 Introduction
8.2 Films, Sheets & Tapes
8.3 Paints, Inks & Coatings
8.4 Others
8.4.1 Retro-Reflective Threads
8.4.2 Retro-Reflective Fabrics
9 Retro-Reflective Materials Market, By Application (Page No. - 59)
9.1 Introduction
9.2 Traffic Control & Work Zone
9.2.1 APAC
9.2.2 Europe
9.2.3 North America
9.2.4 Latin America
9.2.5 Middle East & Africa
9.3 Conspicuity & Fleet & Vehicle Registration
9.3.1 APAC
9.3.2 Europe
9.3.3 North America
9.3.4 Latin America
9.3.5 Middle East & Africa
9.4 Personal Safety
9.4.1 APAC
9.4.2 Europe
9.4.3 North America
9.4.4 Latin America
9.4.5 Middle East & Africa
9.5 Others
9.5.1 APAC
9.5.2 Europe
9.5.3 North America
9.5.4 Latin America
9.5.5 Middle East & Africa
10 Retro-Reflective Materials Market, By Region (Page No. - 75)
10.1 Introduction
10.2 APAC
10.2.1 China
10.2.2 Japan
10.2.3 India
10.2.4 Australia & New Zealand
10.2.5 South Korea
10.3 North America
10.3.1 US
10.3.2 Canada
10.4 Europe
10.4.1 Germany
10.4.2 UK
10.4.3 France
10.4.4 Spain
10.4.5 Italy
10.4.6 Russia
10.5 Latin America
10.5.1 Brazil
10.5.2 Mexico
10.5.3 Argentina
10.6 Middle East & Africa (MEA)
10.6.1 Saudi Arabia
10.6.2 South Africa
10.6.3 UAE
11 Competitive Landscape (Page No. - 96)
11.1 Overview
11.2 Market Ranking of Key Players, 2017
11.3 Competitive Scenario
11.3.1 New Product Developments
11.3.2 Expansions
11.3.3 Acquisitions
11.3.4 Partnerships
12 Company Profiles (Page No. - 101)
12.1 3M
12.1.1 Business Overview
12.1.2 Products Offered
12.1.3 Recent Developments
12.1.4 SWOT Analysis
12.1.5 MnM View
12.2 Avery Dennison Corporation
12.2.1 Business Overview
12.2.2 Products Offered
12.2.3 SWOT Analysis
12.2.4 MnM View
12.3 Orafol Europe GmbH
12.3.1 Business Overview
12.3.2 Products Offered
12.3.3 Recent Developments
12.3.4 SWOT Analysis
12.3.5 MnM View
12.4 Dominic Optical Inc.
12.4.1 Business Overview
12.4.2 Products Offered
12.4.3 SWOT Analysis
12.4.4 MnM View
12.5 Changzhou Hua R Sheng Reflective Material Co., Ltd.
12.5.1 Business Overview
12.5.2 Products Offered
12.5.3 MnM View
12.6 Coats Group PLC
12.6.1 Business Overview
12.6.2 Products Offered
12.6.3 SWOT Analysis
12.6.4 MnM View
12.7 Nippon Carbide Industries Co., Inc.
12.7.1 Business Overview
12.7.2 Products Offered
12.7.3 MnM View
12.8 Paiho Group
12.8.1 Business Overview
12.8.2 Products Offered
12.8.3 MnM View
12.9 Asian Paints Ppg Pvt. Ltd.
12.9.1 Business Overview
12.9.2 Products Offered
12.9.3 MnM View
12.10 Reflomax
12.10.1 Business Overview
12.10.2 Products Offered
12.10.3 MnM View
12.11 Other Companies
12.11.1 JRC Reflex Sas
12.11.2 Aura Optical Systems, LP
12.11.3 American & Efird
12.11.4 Magnacolours
12.11.5 Halo Coatings
12.11.6 Reflectionight
12.11.7 Dongguan Yufon Textile Materials Co. Ltd
12.11.8 Yeshili Reflective Materials Co., Ltd.
12.11.9 Viz Reflectives
12.11.10 Unitika Sparklite Ltd.
13 Appendix (Page No. - 120)
13.1 Insights From Industry Experts
13.2 Discussion Guide
13.3 Knowledge Store: Marketsandmarkets Subscription Portal
13.4 Introducing RT: Real-Time Market Intelligence
13.5 Available Customizations
13.6 Related Reports
13.7 Author Details
List of Tables (72 Tables)
Table 1 Trends and Forecast of GDP, USD Billion (2017�2022)
Table 2 Per Capita GDP vs Per Capita Rettro-Reflective Materials Demand, 2018
Table 3 Automotive Production, Million Units (2011-2017)
Table 4 Contribution of the Construction Industry in North America, USD Billion (2015�2022)
Table 5 Contribution of the Construction Industry in Europe, USD Billion (2015�2022)
Table 6 Contribution of the Construction Industry in APAC, USD Billion (2015�2022)
Table 7 Contribution of the Construction Industry in the Middle East, USD Billion (2015�2022)
Table 8 Contribution of the Construction Industry in Latin America, USD Billion (2015�2022)
Table 9 Retro-Reflective Materials Market Size, By Technology, 2016�2023 (USD Million)
Table 10 Micrprismatic Technology-Based Retro-Reflective Materials Market Size, By Region, 2016�2023 (USD Million)
Table 11 Glass Beads Technology-Based Retro-Reflective Materials Market Size, By Region, 2016�2023 (USD Million)
Table 12 Ceramic Beads Technology-Based Retro-Reflective Materials Market Size, By Region, 2016�2023 (USD Million)
Table 13 Retro-Reflective Materials Market Size, By Product Type, 2016�2023 (USD Million)
Table 14 Retro-Reflective Films, Sheets & Tapes Market Size, By Region, 2016�2023 (USD Million)
Table 15 Retro-Reflective Paints, Inks & Coatings Market Size, By Region, 2016�2023 (USD Million)
Table 16 Other Retro-Reflective Product Types Market Size, By Region, 2016�2023 (USD Million)
Table 17 Retro-Reflective Materials Market Size, By Application, 2016�2023 (USD Million)
Table 18 Retro-Reflective Materials Market Size in Traffic Control & Work Zone Application, By Region, 2016�2023 (USD Million)
Table 19 APAC: Market Size in Traffic Control & Work Zone Application, By Country, 2016�2023 (USD Million)
Table 20 Europe: Market Size in Traffic Control & Work Zone Application, By Country, 2016�2023 (USD Million)
Table 21 North America: Market Size in Traffic Control & Work Zone Application, By Country, 2016�2023 (USD Million)
Table 22 Latin America: Market Size in Traffic Control & Work Zone Application, By Country, 2016�2023 (USD Million)
Table 23 MEA: Market Size in Traffic Control & Work Zone Application, By Country, 2016�2023 (USD Million)
Table 24 Retro-Reflective Materials Market Size in Conspicuity & Fleet & Vehicle Registration Application, By Region, 2016�2023 (USD Million)
Table 25 APAC: Market Size in Conspicuity & Fleet & Vehicle Registration Application, By Country, 2016�2023 (USD Million)
Table 26 Europe: Market Size in Conspicuity & Fleet & Vehicle Registration Application, By Country, 2016�2023 (USD Million)
Table 27 North America: Market Size in Conspicuity & Fleet & Vehicle Registration Application, By Country, 2016�2023 (USD Million)
Table 28 Latin America: Market Size in Conspicuity & Fleet & Vehicle Registration Application, By Country, 2016�2023 (USD Million)
Table 29 MEA: Market Size in Conspicuity & Fleet & Vehicle Registration Application, By Country, 2016�2023 (USD Million)
Table 30 Retro-Reflective Materials Market Size in Personal Safety Application, By Region, 2016�2023 (USD Million)
Table 31 APAC: Market Size in Personal Safety Application, By Country, 2016�2023 (USD Million)
Table 32 Europe: Market Size in Personal Safety Application, By Country, 2016�2023 (USD Million)
Table 33 North America: Market Size in Personal Safety Application, By Country, 2016�2023 (USD Million)
Table 34 Latin America: Market Size in Personal Safety Application, By Country, 2016�2023 (USD Million)
Table 35 MEA: Market Size in Personal Safety Application, By Country, 2016�2023 (USD Million)
Table 36 Retro-Reflective Materials Market Size in Other Applications, By Region, 2016�2023 (USD Million)
Table 37 APAC: Market Size in Other Applications, By Country, 2016�2023 (USD Million)
Table 38 Europe: Market Size in Other Applications, By Country, 2016�2023 (USD Million)
Table 39 North America: Market Size in Other Applications, By Country, 2016�2023 (USD Million)
Table 40 Latin America: Market Size in Other Applications, By Country, 2016�2023 (USD Million)
Table 41 MEA: Market Size in Other Applications, By Country, 2016�2023 (USD Million)
Table 42 Retro-Reflective Materials Market Size, By Region, 2016�2023 (USD Million)
Table 43 APAC: Market Size, By Application, 2016�2023 (USD Million)
Table 44 APAC: Market Size, By Product Type, 2016�2023 (USD Million)
Table 45 APAC: Market Size, By Technology, 2016�2023 (USD Million)
Table 46 China: Market Size, By Application, 2016�2023 (USD Million)
Table 47 Japan: Market Size, By Application, 2016�2023 (USD Million)
Table 48 India: Market Size, By Application, 2016�2023 (USD Million)
Table 49 APAC: Retro-Reflective Materials Market Size, By Country, 2016�2023 (USD Million)
Table 50 North America: Market Size, By Application, 2016�2023 (USD Million)
Table 51 North America: Market Size, By Product Type, 2016�2023 (USD Million)
Table 52 North America: Market Size, By Technology, 2016�2023 (USD Million)
Table 53 US: Retro-Reflective Materials Market Size, By Application, 2016�2023 (USD Million)
Table 54 Canada: Retro-Reflective Materials Market Size, By Application, 2016�2023 (USD Million)
Table 55 North America: Retro-Reflective Materials Market Size, By Country, 2016�2023 (USD Million)
Table 56 Europe: Market Size, By Application, 2016�2023 (USD Million)
Table 57 Europe: Market Size, By Product Type, 2016�2023 (USD Million)
Table 58 Europe: Market Size, By Technology, 2016�2023 (USD Million)
Table 59 Germany: Retro-Reflective Materials Market Size, By Application, 2016�2023 (USD Million)
Table 60 Europe: Retro-Reflective Materials Market Size, By Country, 2016�2023 (USD Million)
Table 61 Latin America: Market Size, By Application, 2016�2023 (USD Million)
Table 62 Latin America: Market Size, By Product Type, 2016�2023 (USD Million)
Table 63 Latin America: Market Size, By Technology, 2016�2023 (USD Million)
Table 64 Latin America: Market Size, By Country, 2016�2023 (USD Million)
Table 65 MEA: Market Size, By Application, 2016�2023 (USD Million)
Table 66 MEA: Market Size, By Product Type, 2016�2023 (USD Million)
Table 67 MEA: Market Size, By Technology, 2016�2023 (USD Million)
Table 68 MEA: Market Size, By Country, 2016�2023 (USD Million)
Table 69 New Product Developments, 2016�2018
Table 70 Expansions, 2016�2018
Table 71 Acquisitions, 2016�2018
Table 72 Partnerships, 2016�2018
List of Figures (43 Figures)
Figure 1 Retro-Reflective Materials: Market Segmentation
Figure 2 Retro-Reflective Materials Market: Research Design
Figure 3 Market Size Estimation: Bottom-Up Approach
Figure 4 Market Size Estimation: Top-Down Approach
Figure 5 Retro-Reflective Materials Market: Data Triangulation
Figure 6 Microprismatic to Be the Leading Technology for Retro-Reflective Materials
Figure 7 Films, Sheets & Tapes to Be the Leading Product Type of Retro-Reflective Materials
Figure 8 China to Be the Fastest-Growing Retro-Reflective Materials Market
Figure 9 Traffic Control & Work Zone to Be the Leading Application of Retro-Reflective Materials
Figure 10 APAC to Lead the Retro-Reflective Materials Market
Figure 11 Increased Demand to Ensure People Safety at Low Light and Dark Conditions to Drive the Retro-Reflective Materials Market
Figure 12 Microprismatic Technology to Dominate the Retro-Reflective Materials Market
Figure 13 Films, Sheets & Tapes Was the Largest Product Type of Retro-Reflective Materials
Figure 14 Traffic Control & Workzone Application to Be the Leading Application of Retro-Reflective Materials
Figure 15 China to Be the Fastest-Growing Retro-Reflective Materials Market
Figure 16 Factors Governing Retro-Reflective Materials Market
Figure 17 Retro-Reflective Materials Market: Porter�s Five Forces Analysis
Figure 18 Per Capita GDP vs Per Capita Retro-Reflective Materials Demand
Figure 19 Automotive Production in Key Countries, Million Units (2016 vs 2017)
Figure 20 Contribution of the Construction Industry in North America, USD Billion (2017 vs 2022)
Figure 21 Contribution of the Construction Industry in Europe, USD Billion (2017 vs 2022)
Figure 22 Contribution of the Construction Industry in APAC, USD Billion (2017 vs 2022)
Figure 23 Contribution of the Construction Industry in the Middle East, USD Billion (2017 vs 2022)
Figure 24 Contribution of the Construction Industry in Latin America, USD Billion (2017 vs 2022)
Figure 25 Microprismatic Technology to Dominate the Retro-Reflective Materials Market
Figure 26 APAC to Lead in the Microprismatic Technology Segment
Figure 27 Films, Sheets & Tapes to Be the Leading Product Type for Retro-Reflective Materials
Figure 28 APAC to Lead in the Films, Sheets & Tapes Segment
Figure 29 Traffic Control & Work Zone Application to Lead the Retro-Reflective Materials Market
Figure 30 Traffic Control & Work Zone to Be the Leading Application in APAC
Figure 31 Regional CAGR Snapshot: China to Lead the Retro-Reflective Materials Market
Figure 32 APAC: Retro-Reflective Materials Market Snapshot
Figure 33 North America: Retro-Reflective Materials Market Snapshot
Figure 34 Europe: Retro-Reflective Materials Market Snapshot
Figure 35 Companies Adopted New Product Developments as the Key Growth Strategy Between 2016 and 2018
Figure 36 3M: Company Snapshot
Figure 37 3M: SWOT Analysis
Figure 38 Avery Dennison: Company Snapshot
Figure 39 Avery Dennison: SWOT Analysis
Figure 40 Orafol: SWOT Analysis
Figure 41 Dominic Optical: SWOT Analysis
Figure 42 Coats Group: Company Snapshot
Figure 43 Coats Group: SWOT Analysis


Growth opportunities and latent adjacency in Retro-Reflective Materials Market