RF-Over-Fiber Market

RF-Over-Fiber Market Size, Share & Industry Growth Analysis Report by Component (Optical Cables, Amplifiers, Transceivers, Switches, Antennas, Connectors, Multiplexers), Frequency Band (L, S, C, X, Ku, Ka), Deployment (Underground, Aerial, Underwater), Application, Vertical - Global Forecast to 2029

Report Code: SE 6475 Dec, 2023, by marketsandmarkets.com

The global RF-over-Fiber market size is expected to be valued at USD 670 million in 2024 and is projected to reach USD 981 million by 2029; it is expected to grow at a CAGR of 7.9% from 2024 to 2029. Increasing demand for high-bandwidth communication solutions, fueled by the requirements of industries like telecommunications and defense for efficient data transfer, is driving the growth of the market.

This surge aligns with a significant opportunity arising from the growing adoption of Fiber-to-the-X (FTTX) architectures, where RFoF technology plays a pivotal role in delivering reliable and high-performance connectivity in Fiber-to-the-Home (FTTH) and other FTTX deployments. As global demand for faster and more robust internet access expands, RFoF stands poised to capitalize on this opportunity, serving as a critical component in modern fiber-optic communication infrastructure.
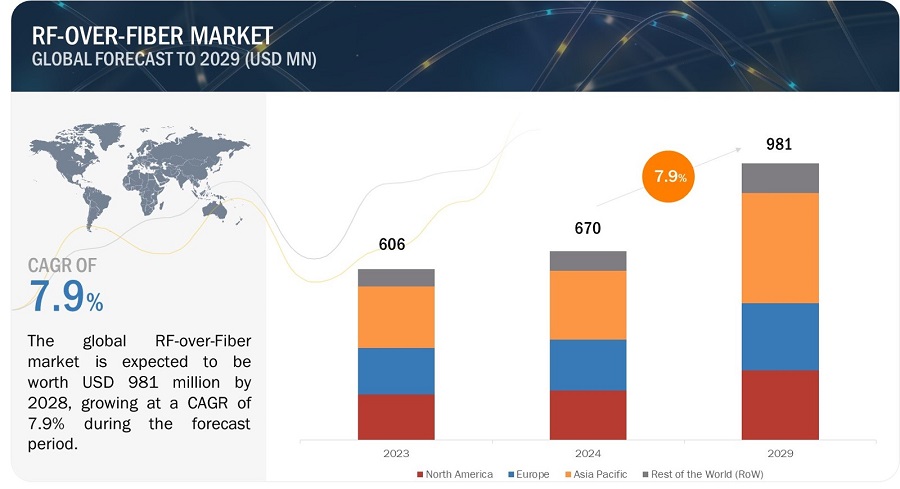
RF-Over-Fiber Market

RF-Over-Fiber Market

RF-Over-Fiber Market Forecast to 2029

To know about the assumptions considered for the study, Request for Free Sample Report

RF-over-Fiber Market Dynamics

Driver: Increasing demand for high-bandwidth communication

The RF-over-Fiber (RFoF) market is the escalating demand for high-bandwidth communication solutions. As industries, particularly telecommunications, IT, and defense, strive to meet the ever-growing requirements for data transfer rates, low latency, and reliable connectivity, RFoF technology emerges as a crucial enabler.

The surge in applications such as 5G networks, government and defense communication systems, and data-intensive operations necessitates advanced solutions capable of efficiently transmitting radio frequency signals over fiber-optic cables. RFoF addresses these demands, offering a reliable and high-performance communication infrastructure that positions it at the forefront of technological innovation in meeting the global need for enhanced bandwidth capabilities.

Restraint: High cost of installation and infrastructure required for RF-over-Fiber

The RF-over-Fiber market is the high cost associated with installation and the infrastructure required for its implementation. The deployment of RFoF technology involves substantial upfront expenses for installing fiber-optic cables and related components. The need for specialized equipment and skilled professionals to integrate RFoF systems adds to the overall cost of implementation.

This financial barrier can pose challenges for businesses, notably smaller enterprises or those operating on tight budgets, hindering widespread adoption. As cost-effective alternatives and advancements in competing technologies emerge, addressing the financial considerations associated with RFoF installations will mitigate this restraint and foster broader market acceptance.

Opportunity: Growing adoption of FTTX to fuel market growth

The RF-over-fiber market presents a significant opportunity driven by the growing adoption of Fiber-to-the-X (FTTX) architectures. As global demand for high-speed broadband and data services increases, FTTX, which includes Fiber-to-the-Home (FTTH), Fiber-to-the-Premises (FTTP), and other variants, becomes a key enabler.

RFoF technology plays a pivotal role in these deployments by efficiently transmitting radio frequency signals over fiber-optic cables, extending its application in providing high-performance connectivity to end-users. With the ongoing expansion of FTTX networks worldwide to meet the demands of residential and commercial users for faster and more reliable internet access, the RFoF market is poised to capitalize on this opportunity and witness substantial growth as an integral component of modern fiber-optic communication infrastructure.

Challenge: Challenging testing process for RF-over-Fiber Systems

A significant challenge for the RF-over-Fiber market is the intricate testing process associated with ensuring the robust performance of RFoF systems. Verifying and validating the integrity of radio frequency signals over fiber-optic cables requires sophisticated testing equipment and expertise, contributing to a complex and time-consuming testing phase. Factors such as signal loss, dispersion, and electromagnetic interference must be meticulously assessed to guarantee optimal system functionality.

The challenge is further amplified as RFoF technology finds applications in diverse sectors with varying requirements, necessitating customized testing procedures for specific use cases. Overcoming the testing complexities is crucial for the widespread adoption of RFoF, and ongoing advancements in testing methodologies and equipment will be pivotal in addressing this challenge and fostering the seamless integration of RFoF solutions across diverse industries.

Rf-Over-Fiber Market Ecosystem

The RF-over-Fiber market is dominated by established and financially sound manufacturers with extensive experience in the industry. These companies have diversified product portfolios, cutting-edge technologies, and strong global sales and marketing networks. Leading players in the market include Coherent Corp. from the US, HUBER+SUHNER from Switzerland, EMCORE Corporation from the US, G&H Group from the UK, SEIKOH GIKEN CO., LTD from Japan, and Broadcom from the US.
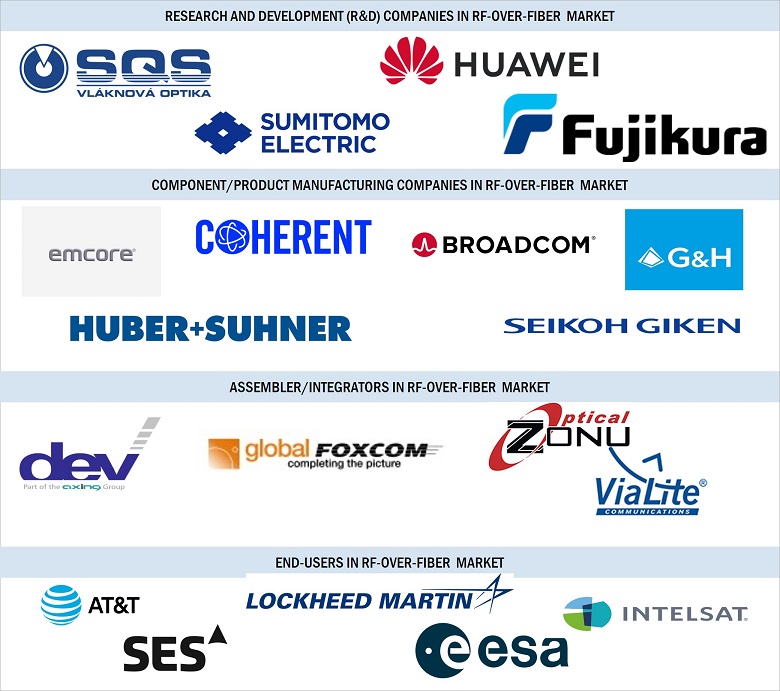
RF-Over-Fiber Marketby Ecosystem

Rf-Over-Fiber Market Segment Overview

Underground segment by deployment is expected to hold the second-highest market share during the forecast period.

The deployment of the RF-over-Fiber market underground, securing the second-highest share in the market, can be attributed to the increasing demand for reliable and secure communication solutions in critical infrastructure applications. Underground deployments are particularly crucial in sectors such as transportation, defense, and energy, where communication systems must operate seamlessly in challenging environments and ensure minimal signal interference.

RFoF technology, with its ability to transmit radio frequency signals over fiber-optic cables, offers a resilient solution for underground deployments by mitigating signal degradation and electromagnetic interference that can occur in subterranean conditions. Applications such as subway and tunnel communication systems, underground military installations, and energy exploration and distribution networks benefit from the robust and secure transmission capabilities of RFoF, driving its substantial market share in underground deployments. The technology's adaptability to challenging environments positions it as a key enabler for maintaining adequate communication infrastructure below the surface.

Based on application, the communication to hold the highest market share during the forecast period

Communication holds the highest share in the RF-over-Fiber market primarily due to the escalating demand for high-speed and reliable data transfer in various communication applications. As the telecommunications industry advances, especially with the widespread deployment of 5G networks, there is an increasing need for technologies that can efficiently transmit radio frequency signals over long distances without compromising signal integrity.

RFoF technology addresses this demand by leveraging fiber-optic cables to mitigate signal losses and ensure consistent and high-quality communication. Moreover, the application extends beyond traditional telecommunication to include satellite communication, broadcasting, and military communication systems, which rely on RFoF to deliver robust, low-latency, and high-bandwidth connectivity. The versatility of RFoF in meeting the intricate requirements of diverse communication applications positions it as a pivotal technology, driving its predominant share in the market.

IT & Telecommunication in RF-over-Fiber market to hold the highest market share

In the RF-over-Fiber (RFoF) market, the dominance of the Information Technology (IT) and telecommunication vertical can be attributed to the sector's insatiable demand for high-performance and reliable communication infrastructure.

IT and Telecommunication companies are at the forefront of technological advancements, constantly seeking solutions that provide enhanced bandwidth, reduced signal loss, and improved transmission capabilities. RFoF technology aligns seamlessly with these requirements, offering efficient signal transmission over fiber-optic cables, thereby addressing the growing demands of the industry for high-frequency and high-speed data transfer.

The deployment of 5G networks, the proliferation of data centers, and the increasing reliance on wireless communication technologies further underscore the critical role of RFoF in IT and telecommunication verticals, positioning it as an indispensable component for optimizing network performance and ensuring seamless connectivity.

Rf-Over-Fiber Market Growth

RF-over-Fiber market in Asia Pacific region to exhibit highest CAGR during the forecast period

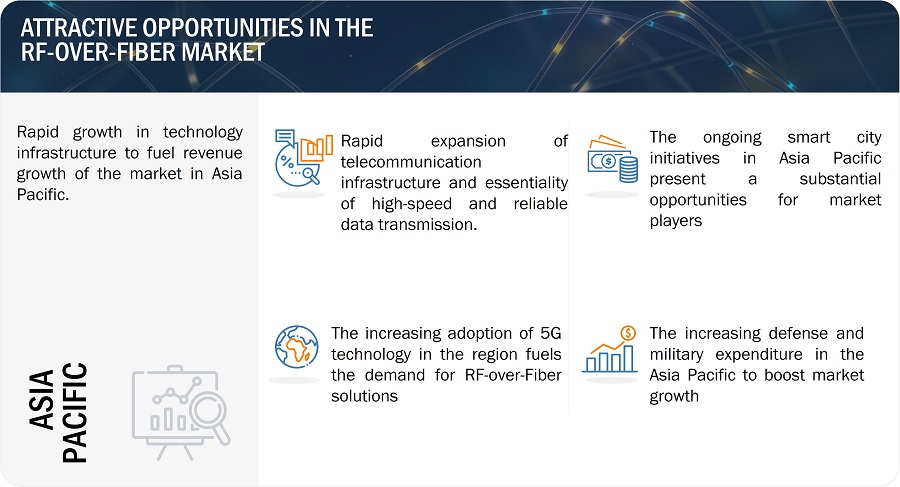
The Asia Pacific region is experiencing the highest CAGR in the RF-over-Fiber (RFoF) market due to a confluence of factors driving increased demand and adoption. The region's burgeoning telecommunications sector, characterized by rapid urbanization and a surge in mobile communication infrastructure, has heightened the need for efficient and reliable RFoF solutions.

Additionally, the increasing deployment of 5G networks, which demand higher data transfer rates and low latency, has fueled the demand for RFoF technology to transmit radio frequency effectively signals over fiber-optic cables. Furthermore, the proactive investments by governments and telecommunications companies in expanding network capabilities and enhancing communication infrastructure in countries across the Asia Pacific region contribute to the robust growth of the RFoF market, positioning it as a critical driver of technological advancement in the region.
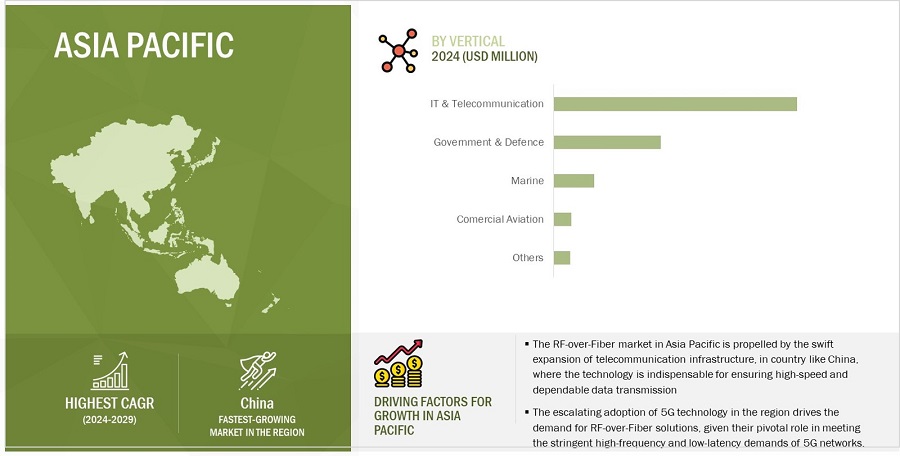
RF-Over-Fiber Market by Region

RF-Over-Fiber Market by Region

To know about the assumptions considered for the study, download the pdf brochure

Top RF-over-Fiber Companies -
Key Market Players

The RF-over-Fiber companies is dominated by players such as Coherent Corp. (US), HUBER+SUHNER (Switzerland), EMCORE Corporation (US), G&H Group (UK), SEIKOH GIKEN CO., LTD (Japan), Broadcom (US) and others.

RF-over-Fiber Market Report Scope

Report Metric

Details

Estimated Market Size USD 670 million
Projected Market Size USD 981 million
Growth Rate CAGR of 7.9%

Market size available for years

2020-2029

Base year considered

2023

Forecast period

2024-2029

Forecast units

Value (USD Million/Billion)

Segments Covered

By Component, By Frequency Band, By Deployment, By Application, By Vertical

Geographies covered

North America, Europe, Asia Pacific, and Rest of the world (RoW)

Companies covered

The major market players include Coherent Corp. (US), HUBER+SUHNER (Switzerland), EMCORE Corporation (US), G&H Group (UK), SEIKOH GIKEN CO., LTD (Japan), (Total of 25 players are profiled)

RF-Over-Fiber Market Highlights

The study categorizes the RF-over-Fiber market based on the following segments:

Segment

Subsegment

By Component

  • Optical Cables
  • Optical Amplifiers
  • Optical Transceivers
  • Optical Switches
  • Antennas
  • Others

By Frequency Band

  • L (Upto 2 GHz)
  • S (2-4 GHz)
  • C (4-8 GHz)
  • X (8-12 GHz)
  • Ku (12-18 GHz)
  • Ka (26.5-40 GHz)

By Deployment

  • Aerial
  • Underground
  • Underwater

By Application

  • Communication
  • Broadcast
  • Broadband
  • Radar
  • Navigation

By Vertical

  • IT & Telecommunication
  • Government & Defence
  • Marine
  • Comercial Aviation
  • Others

By Region

  • North America
  • Europe
  • Asia Pacific
  • RoW

Recent Developments in RF-over-Fiber Industry

  • In September 2023, Coherent Corp. introduced the pump laser module with 1200 mW output power in a 10-pin butterfly package, catering to the demands of erbium-doped fiber amplifiers (EDFAs) in optical networks. The advanced pump lasers address the evolving needs of the RF over the fiber market by supplying additional power crucial for amplifying a more significant number of channels in next-gen ultra-broadband optical transmission systems.
  • In January 2023, HUBER+SUHNER's MFBX Evo, featuring a modular design, promotes resource efficiency by allowing connector parts to be utilized in various connections, realizing economies of scale. The solution's high tolerance compensation between boards contributes to infinite design options, reducing the Total Cost of Ownership (TCO). With the capability to handle axial misalignment of ± 0.8mm and radial misalignment of ± 0.7mm at 17mm, the MFBX Evo offers flexibility without compromising excellent electrical values.
  • In October 2022, HUBER+SUHNER acquired UK-based Phoenix Dynamics Ltd., known for customized cable solutions and electro-mechanical assemblies in industrial markets. The acquisition aligned with HUBER+SUHNER's strategy to enhance component sales with tailored solutions, focusing on aerospace and defense. This move expanded the company's industry offerings and strengthened its capabilities in providing comprehensive connectivity solutions, including RF over fiber products.
  • In March 2022, EMCORE Corporation launched the MAKO-X C/X-Band RF over Fiber Transceiver, catering to military-grade applications like electronic warfare systems and high-dynamic-range functions within the 3.4 GHz to 8.4 GHz range. The ruggedized flange-mount module has undergone testing adhering to environmental MIL-STD-810G, as well as EMI & EMC MIL-STD-461F standards, ensuring robust performance in challenging conditions.
  • In February 2022, EMCORE Corporation recently acquired the L3Harris Space and Navigation Business. This move is expected to fuel growth and contribute additional revenue streams, potentially leading to increased innovation and integration of advanced technologies, which could indirectly benefit the RF over fiber market by leveraging synergies in navigation and communication technologies.

Frequently Asked Questions (FAQs) Addressed by the Report:

To speak to our analyst for a discussion on the above findings, click Speak to Analyst

TABLE OF CONTENTS
 
1 INTRODUCTION (Page No. - 22)
    1.1 STUDY OBJECTIVES 
    1.2 MARKET DEFINITION 
           1.2.1 INCLUSIONS AND EXCLUSIONS
    1.3 STUDY SCOPE 
           FIGURE 1 RF-OVER-FIBER MARKET SEGMENTATION
           1.3.1 REGIONS COVERED
           1.3.2 YEARS CONSIDERED
    1.4 CURRENCY CONSIDERED 
    1.5 LIMITATIONS 
    1.6 STAKEHOLDERS 
    1.7 SUMMARY OF CHANGES 
    1.8 RECESSION IMPACT 
 
2 RESEARCH METHODOLOGY (Page No. - 28)
    2.1 RESEARCH DATA 
           FIGURE 2 RF-OVER-FIBER MARKET: RESEARCH DESIGN
           2.1.1 PRIMARY AND SECONDARY RESEARCH
           2.1.2 SECONDARY DATA
                    2.1.2.1 Major secondary sources
                    2.1.2.2 Key data from secondary sources
           2.1.3 PRIMARY DATA
           2.1.4 BREAKDOWN OF PRIMARY INTERVIEWS
                    2.1.4.1 Key industry insights
                    2.1.4.2 Key data from primary sources
    2.2 MARKET SIZE ESTIMATION 
           FIGURE 3 PROCESS FLOW OF MARKET SIZE ESTIMATION
           2.2.1 BOTTOM-UP APPROACH
                    2.2.1.1 Approach to estimate market share using bottom-up analysis (demand side)
                               FIGURE 4 MARKET SIZE ESTIMATION: BOTTOM-UP APPROACH
           2.2.2 TOP-DOWN APPROACH
                    2.2.2.1 Approach to estimate market share using top-down analysis (supply side)
                               FIGURE 5 MARKET SIZE ESTIMATION: TOP-DOWN APPROACH
                               FIGURE 6 MARKET SIZE ESTIMATION: TOP-DOWN APPROACH (SUPPLY SIDE)— REVENUE GENERATED FROM RF-OVER-FIBER MARKET
    2.3 DATA TRIANGULATION 
           FIGURE 7 DATA TRIANGULATION
    2.4 RESEARCH ASSUMPTIONS 
           FIGURE 8 ASSUMPTIONS FOR RESEARCH STUDY
    2.5 RISK ASSESSMENT 
    2.6 PARAMETERS CONSIDERED TO ANALYZE IMPACT OF RECESSION ON MARKET 
    2.7 STUDY LIMITATIONS 
           FIGURE 9 LIMITATIONS OF RESEARCH STUDY
 
3 EXECUTIVE SUMMARY (Page No. - 41)
    FIGURE 10 OPTICAL CABLES TO BE LARGEST SEGMENT DURING FORECAST PERIOD
    FIGURE 11 C (4–8 GHZ) SEGMENT TO WITNESS HIGHEST GROWTH DURING FORECAST PERIOD
    FIGURE 12 AERIAL TO BE FASTEST-GROWING DEPLOYMENT SEGMENT DURING FORECAST PERIOD
    FIGURE 13 COMMUNICATION TO BE LARGEST APPLICATION SEGMENT DURING FORECAST PERIOD
    FIGURE 14 IT & TELECOMMUNICATIONS VERTICAL SEGMENT TO WITNESS HIGHEST GROWTH DURING FORECAST PERIOD
    FIGURE 15 ASIA PACIFIC HELD LARGEST SHARE OF RF-OVER-FIBER MARKET IN 2023
 
4 PREMIUM INSIGHTS (Page No. - 46)
    4.1 ATTRACTIVE OPPORTUNITIES FOR PLAYERS IN RF-OVER-FIBER MARKET 
           FIGURE 16 INCREASING DEMAND FOR RF-OVER-FIBER PRODUCTS IN BROADBAND APPLICATION TO DRIVE MARKET
    4.2 NORTH AMERICA: RF-OVER-FIBER MARKET, BY COUNTRY AND VERTICAL 
           FIGURE 17 US AND IT & TELECOMMUNICATIONS SEGMENT TO HOLD LARGEST SHARES OF NORTH AMERICAN MARKET IN 2024
    4.3 ASIA PACIFIC: RF-OVER-FIBER MARKET, BY FREQUENCY BAND 
           FIGURE 18 L (UP TO 2 GHZ) TO BE LARGEST SEGMENT OF ASIA PACIFIC MARKET IN 2029
    4.4 MARKET, BY REGION 
           FIGURE 19 RF-OVER-FIBER MARKET IN CHINA TO GROW AT HIGHEST CAGR DURING FORECAST PERIOD
 
5 MARKET OVERVIEW (Page No. - 49)
    5.1 INTRODUCTION 
    5.2 MARKET DYNAMICS 
           FIGURE 20 RF-OVER-FIBER MARKET: DRIVERS, RESTRAINTS, OPPORTUNITIES, AND CHALLENGES
           5.2.1 DRIVERS
                    FIGURE 21 MARKET: IMPACT ANALYSIS OF DRIVERS
                    5.2.1.1 Increased military and defense expenditure
                    5.2.1.2 Rise in demand for high-bandwidth communication
                    5.2.1.3 Rapid adoption of advanced network technologies
           5.2.2 RESTRAINTS
                    FIGURE 22 RF-OVER-FIBER MARKET: IMPACT ANALYSIS OF RESTRAINTS
                    5.2.2.1 High installation and infrastructure costs required for RF-over-Fiber
                    5.2.2.2 Vulnerability to physical damage and signal degradation
           5.2.3 OPPORTUNITIES
                    FIGURE 23 MARKET: IMPACT ANALYSIS OF OPPORTUNITIES
                    5.2.3.1 Rise in demand for high-speed and secure communication across expanding data center infrastructure
                    5.2.3.2 Increased adoption of Fiber-to-the-X architectures
                    5.2.3.3 Integration of fiber optic networks into smart city projects
           5.2.4 CHALLENGES
                    FIGURE 24 RF-OVER-FIBER MARKET: IMPACT ANALYSIS OF CHALLENGES
                    5.2.4.1 Testing of RF-over-Fiber systems during installation and maintenance
                    5.2.4.2 Signal distortion and performance degradation in RF-over-Fiber systems
    5.3 VALUE CHAIN ANALYSIS 
           FIGURE 25 RF-OVER-FIBER MARKET: VALUE CHAIN ANALYSIS
    5.4 ECOSYSTEM MAPPING 
           FIGURE 26 MARKET ECOSYSTEM
           TABLE 1 COMPANIES AND THEIR ROLES IN RF-OVER-FIBER ECOSYSTEM
    5.5 TRENDS/DISRUPTIONS IMPACTING CUSTOMERS’ BUSINESSES 
           FIGURE 27 TRENDS/DISRUPTIONS IMPACTING CUSTOMERS’ BUSINESSES
    5.6 PRICING ANALYSIS 
           5.6.1 AVERAGE SELLING PRICE TREND OF RF-OVER-FIBER COMPONENTS OFFERED BY THREE KEY PLAYERS
                    FIGURE 28 AVERAGE SELLING PRICE TREND OF RF-OVER-FIBER COMPONENTS OFFERED BY THREE KEY PLAYERS
                    TABLE 2 AVERAGE SELLING PRICE TREND OF RF-OVER-FIBER COMPONENTS OFFERED BY THREE KEY PLAYERS (USD)
           5.6.2 AVERAGE SELLING PRICE TREND OF RF-OVER-FIBER, BY COMPONENT
                    FIGURE 29 AVERAGE SELLING PRICE TREND OF RF-OVER-FIBER, BY COMPONENT (USD)
           5.6.3 AVERAGE SELLING PRICE TREND OF RF-OVER-FIBER OPTICAL CABLES, BY REGION
                    FIGURE 30 AVERAGE SELLING PRICE TREND OF RF-OVER-FIBER, BY REGION (USD)
    5.7 TECHNOLOGY ANALYSIS 
           5.7.1 PHOTONICS INTEGRATION
           5.7.2 OPTICAL SWITCHING AND BEAMFORMING
           5.7.3 ADVANCED MODULATION SCHEMES
           5.7.4 DIGITAL SIGNAL PROCESSING
           5.7.5 5G INTEGRATION AND NETWORK SLICING
    5.8 PORTER’S FIVE FORCES ANALYSIS 
           TABLE 3 RF-OVER-FIBER MARKET: PORTER’S FIVE FORCES ANALYSIS
           FIGURE 31 PORTER’S FIVE FORCES ANALYSIS
           5.8.1 THREAT OF NEW ENTRANTS
           5.8.2 THREAT OF SUBSTITUTES
           5.8.3 BARGAINING POWER OF SUPPLIERS
           5.8.4 BARGAINING POWER OF BUYERS
           5.8.5 INTENSITY OF COMPETITIVE RIVALRY
    5.9 KEY STAKEHOLDERS AND BUYING CRITERIA 
           5.9.1 KEY STAKEHOLDERS IN BUYING PROCESS
                    FIGURE 32 KEY STAKEHOLDERS IN BUYING PROCESS FOR TOP THREE VERTICALS
                    TABLE 4 INFLUENCE OF STAKEHOLDERS ON BUYING PROCESS FOR TOP THREE VERTICALS
           5.9.2 BUYING CRITERIA
                    FIGURE 33 KEY BUYING CRITERIA FOR TOP THREE VERTICALS
                    TABLE 5 KEY BUYING CRITERIA FOR TOP THREE VERTICALS
    5.10 CASE STUDY ANALYSIS 
           5.10.1 NEED FOR EFFECTIVE LONG-DISTANCE COMMUNICATION IN COMBAT ENVIRONMENTS
           5.10.2 OPTIMIZE FIBER USAGE AND MINIMIZE COSTS IN SCENARIOS WHERE END USERS DO NOT OWN PHYSICAL FIBER
           5.10.3 REPLACE EXISTING COPPER COAX INFRASTRUCTURE WITH OPTICAL INFRASTRUCTURE
           5.10.4 TRANSMIT RF SIGNALS OVER FIBER FOR RADIO TELESCOPE
           5.10.5 DISTRIBUTE GPS TIMING SIGNALS ACROSS MULTIPLE MANUFACTURING BUILDINGS
           5.10.6 RELOCATE ANTENNAS TO NEW LOCATION
    5.11 TRADE ANALYSIS 
           5.11.1 IMPORT SCENARIO
                    TABLE 6 IMPORT DATA FOR HS CODE 854470- COMPLIANT PRODUCTS, BY COUNTRY, 2018–2022 (USD MILLION)
           5.11.2 EXPORT SCENARIO
                    TABLE 7 EXPORT DATA FOR HS CODE 854470- COMPLIANT PRODUCTS, BY COUNTRY, 2018–2022 (USD MILLION)
    5.12 TARIFF ANALYSIS 
           TABLE 8 MFN TARIFF FOR HS CODE 854470 COMPLIANT PRODUCTS EXPORTED BY BRAZIL
           TABLE 9 MFN TARIFF FOR HS CODE 854470 COMPLIANT PRODUCTS EXPORTED BY BANGLADESH
    5.13 PATENT ANALYSIS 
           FIGURE 34 NUMBER OF PATENTS GRANTED IN MARKET, 2013–2022
           TABLE 10 RF-OVER-FIBER MARKET: LIST OF PATENTS, 2020–2023
    5.14 KEY CONFERENCES AND EVENTS, 2024–2025 
           TABLE 11 MARKET: LIST OF CONFERENCES AND EVENTS, 2024–2025
    5.15 REGULATORY LANDSCAPE AND STANDARDS 
           5.15.1 REGULATORY BODIES, GOVERNMENT AGENCIES, AND OTHER ORGANIZATIONS
                    TABLE 12 NORTH AMERICA: LIST OF REGULATORY BODIES, GOVERNMENT AGENCIES, AND OTHER ORGANIZATIONS
                    TABLE 13 EUROPE: LIST OF REGULATORY BODIES, GOVERNMENT AGENCIES, AND OTHER ORGANIZATIONS
                    TABLE 14 ASIA PACIFIC: LIST OF REGULATORY BODIES, GOVERNMENT AGENCIES, AND OTHER ORGANIZATIONS
                    TABLE 15 ROW: LIST OF REGULATORY BODIES, GOVERNMENT AGENCIES, AND OTHER ORGANIZATIONS
           5.15.2 STANDARDS AND REGULATIONS RELATED TO RF-OVER-FIBER
                    5.15.2.1 Standards
                    5.15.2.2 Regulations
 
6 RF-OVER-FIBER MARKET, BY COMPONENT (Page No. - 83)
    6.1 INTRODUCTION 
           FIGURE 35 OPTICAL CABLES SEGMENT TO DOMINATE RF-OVER-FIBER MARKET DURING FORECAST PERIOD
           TABLE 16 MARKET, BY COMPONENT, 2020–2023 (USD MILLION)
           TABLE 17 MARKET, BY COMPONENT, 2024–2029 (USD MILLION)
           TABLE 18 MARKET, BY COMPONENT, 2020–2023 (THOUSAND UNITS)
           TABLE 19 MARKET, BY COMPONENT, 2024–2029 (THOUSAND UNITS)
    6.2 OPTICAL CABLES 
           6.2.1 RISE IN NEED FOR HIGH-PERFORMANCE SIGNAL TRANSMISSION OVER LONG DISTANCES TO BOOST SEGMENT
           6.2.2 OPTICAL CABLES, BY FIBER TYPE
                    6.2.2.1 Glass optical fibers
                    6.2.2.2 Plastic optical fibers
           6.2.3 OPTICAL CABLES, BY MODE OF PROPAGATION
                    6.2.3.1 Single-mode optical cables
                    6.2.3.2 Multi-mode optical cables
           6.2.4 OPTICAL CABLES, BY MODE OF ASSEMBLY
                    6.2.4.1 Active optical cables (AOCs)
                    6.2.4.2 Passive optical cables (POCs)
    6.3 OPTICAL AMPLIFIERS 
           6.3.1 INCREASED REQUIREMENT FOR ENHANCED SIGNAL STRENGTH WITH EXTENDED TRANSMISSION DISTANCES TO DRIVE SEGMENT
           6.3.2 ERBIUM-DOPED FIBER AMPLIFIERS
           6.3.3 FIBER RAMAN AMPLIFIERS
           6.3.4 SEMICONDUCTOR OPTICAL AMPLIFIERS
    6.4 OPTICAL TRANSCEIVERS 
           6.4.1 RISE IN DEMAND FROM VARIOUS APPLICATIONS TO FUEL SEGMENT GROWTH
           6.4.2 SFF AND SFP
           6.4.3 SFP+ AND SFP28
           6.4.4 QSFP, QSFP+, QSFP14, & QSFP28
           6.4.5 CFP, CFP2, & CFP4
           6.4.6 XFP
           6.4.7 CXP
    6.5 OPTICAL SWITCHES 
           6.5.1 INCREASED ADOPTION FOR INSTANTANEOUS AND RELIABLE SIGNAL SWITCHING TO PROPEL SEGMENT
           6.5.2 ALL-OPTICAL SWITCHES
           6.5.3 ELECTRO-OPTICAL SWITCHES
    6.6 ANTENNAS 
           6.6.1 INCREASED REQUIREMENT OF ANTENNAS IN RADIO FREQUENCY SYSTEMS TO FOSTER SEGMENT GROWTH
    6.7 OTHERS 
           6.7.1 SPLITTERS
           6.7.2 CONNECTORS
                    6.7.2.1 LC connectors
                    6.7.2.2 MPO/MTP connectors
           6.7.3 FIBER OPTIC MULTIPLEXERS
                    6.7.3.1 CWDM
                    6.7.3.2 DWDM
           6.7.4 FIBER OPTIC ATTENUATORS
           6.7.5 CIRCULATORS
 
7 RF-OVER-FIBER MARKET, BY FREQUENCY BAND (Page No. - 101)
    7.1 INTRODUCTION 
           FIGURE 36 S (2–4 GHZ) SEGMENT TO WITNESS HIGHEST GROWTH DURING FORECAST PERIOD
           TABLE 20 RF-OVER-FIBER MARKET, BY FREQUENCY BAND, 2020–2023 (USD MILLION)
           TABLE 21 MARKET, BY FREQUENCY BAND, 2024–2029 (USD MILLION)
    7.2 L (UP TO 2 GHZ) 
           7.2.1 INCREASED DEMAND IN LONG-DISTANCE SIGNAL TRANSMISSION TO DRIVE SEGMENT
                    TABLE 22 L (UP TO 2 GHZ): RF-OVER-FIBER MARKET, BY APPLICATION, 2020–2023 (USD MILLION)
                    TABLE 23 L (UP TO 2 GHZ): MARKET, BY APPLICATION, 2024–2029 (USD MILLION)
                    TABLE 24 L (UP TO 2 GHZ): MARKET, BY REGION, 2020–2023 (USD MILLION)
                    TABLE 25 L (UP TO 2 GHZ): MARKET, BY REGION, 2024–2029 (USD MILLION)
    7.3 S (2–4 GHZ) 
           7.3.1 INCREASED APPLICATIONS IN RADAR AND SATELLITE COMMUNICATION TO PROPEL SEGMENT
                    TABLE 26 S (2–4 GHZ): RF-OVER-FIBER MARKET, BY APPLICATION, 2020–2023 (USD MILLION)
                    TABLE 27 S (2–4 GHZ): MARKET, BY APPLICATION, 2024–2029 (USD MILLION)
                    TABLE 28 S (2–4 GHZ): MARKET, BY REGION, 2020–2023 (USD MILLION)
                    TABLE 29 S (2–4 GHZ): MARKET, BY REGION, 2024–2029 (USD MILLION)
    7.4 C (4–8 GHZ) 
           7.4.1 GROWING RELEVANCE IN 5G NETWORKS AND TELECOMMUNICATIONS TO FUEL SEGMENT GROWTH
                    TABLE 30 C (4–8 GHZ): RF-OVER-FIBER MARKET, BY APPLICATION, 2020–2023 (USD MILLION)
                    TABLE 31 C (4–8 GHZ): MARKET, BY APPLICATION, 2024–2029 (USD MILLION)
                    TABLE 32 C (4–8 GHZ): MARKET, BY REGION, 2020–2023 (USD MILLION)
                    TABLE 33 C (4–8 GHZ): MARKET, BY REGION, 2024–2029 (USD MILLION)
    7.5 X (8–12 GHZ) 
           7.5.1 INCREASED DEPLOYMENT IN MILITARY AND WEATHER RADARS TO BOOST SEGMENT
                    TABLE 34 X (8–12 GHZ): RF-OVER-FIBER MARKET, BY APPLICATION, 2020–2023 (USD MILLION)
                    TABLE 35 X (8–12 GHZ): MARKET, BY APPLICATION, 2024–2029 (USD MILLION)
                    TABLE 36 X (8–12 GHZ): MARKET, BY REGION, 2020–2023 (USD MILLION)
                    TABLE 37 X (8–12 GHZ): MARKET, BY REGION, 2024–2029 (USD MILLION)
    7.6 KU (12–18 GHZ) 
           7.6.1 EXTENSIVE USE IN SATELLITE BROADCASTING AND WEATHER MONITORING TO PROPEL SEGMENT
                    TABLE 38 KU (12–18 GHZ): RF-OVER-FIBER MARKET, BY APPLICATION, 2020–2023 (USD MILLION)
                    TABLE 39 KU (12–18 GHZ): MARKET, BY APPLICATION, 2024–2029 (USD MILLION)
                    TABLE 40 KU (12–18 GHZ): MARKET, BY REGION, 2020–2023 (USD MILLION)
                    TABLE 41 KU (12–18 GHZ): MARKET, BY REGION, 2024–2029 (USD MILLION)
    7.7 KA (26.5–40 GHZ) 
           7.7.1 RISE IN DEMAND FOR ADVANCED COMMUNICATION SYSTEMS TO PROPEL SEGMENT
                    TABLE 42 KA (26.5–40 GHZ): RF-OVER-FIBER MARKET, BY APPLICATION, 2020–2023 (USD MILLION)
                    TABLE 43 KA (26.5–40 GHZ): MARKET, BY APPLICATION, 2024–2029 (USD MILLION)
                    TABLE 44 KA (26.5–40 GHZ): MARKET, BY REGION, 2020–2023 (USD MILLION)
                    TABLE 45 KA (26.5–40 GHZ): MARKET, BY REGION, 2024–2029 (USD MILLION)
 
8 RF-OVER-FIBER MARKET, BY DEPLOYMENT (Page No. - 114)
    8.1 INTRODUCTION 
           FIGURE 37 AERIAL SEGMENT TO DOMINATE MARKET DURING FORECAST PERIOD
           TABLE 46 RF-OVER-FIBER MARKET, BY DEPLOYMENT, 2020–2023 (USD MILLION)
           TABLE 47 MARKET, BY DEPLOYMENT, 2024–2029 (USD MILLION)
    8.2 AERIAL 
           8.2.1 INCREASED DEMAND FOR OTT MEDIA SERVICES TO FUEL SEGMENT GROWTH
                    TABLE 48 AERIAL: RF-OVER-FIBER MARKET, BY REGION, 2020–2023 (USD MILLION)
                    TABLE 49 AERIAL: MARKET, BY REGION, 2024–2029 (USD MILLION)
    8.3 UNDERGROUND 
           8.3.1 RAPID ADVANCEMENTS IN TELECOMMUNICATIONS INDUSTRY TO BOOST SEGMENT
                    TABLE 50 UNDERGROUND: RF-OVER-FIBER MARKET, BY REGION, 2020–2023 (USD MILLION)
                    TABLE 51 UNDERGROUND: MARKET, BY REGION, 2024–2029 (USD MILLION)
    8.4 UNDERWATER 
           8.4.1 RISE IN DEPLOYMENT OF SUBMARINE OPTICAL FIBER CABLES TO DRIVE SEGMENT
                    TABLE 52 UNDERWATER: RF-OVER-FIBER MARKET, BY REGION, 2020–2023 (USD MILLION)
                    TABLE 53 UNDERWATER: MARKET, BY REGION, 2024–2029 (USD MILLION)
 
9 RF-OVER-FIBER MARKET, BY APPLICATION (Page No. - 120)
    9.1 INTRODUCTION 
           FIGURE 38 COMMUNICATION SEGMENT TO DOMINATE MARKET DURING FORECAST PERIOD
           TABLE 54 RF-OVER-FIBER MARKET, BY APPLICATION, 2020–2023 (USD MILLION)
           TABLE 55 MARKET, BY APPLICATION, 2024–2029 (USD MILLION)
    9.2 COMMUNICATION 
           9.2.1 INCREASED DEMAND FOR HIGH-SPEED AND RELIABLE COMMUNICATION NETWORKS TO FUEL SEGMENT GROWTH
                    TABLE 56 COMMUNICATION: RF-OVER-FIBER MARKET, BY FREQUENCY BAND, 2020–2023 (USD MILLION)
                    TABLE 57 COMMUNICATION: MARKET, BY FREQUENCY BAND, 2024–2029 (USD MILLION)
           9.2.2 FTTX
           9.2.3 CELLULAR COMMUNICATION
           9.2.4 DAS SOLUTIONS
    9.3 BROADCAST 
           9.3.1 NEED OF HIGH BANDWIDTH TO BROADCAST HIGH-DEFINITION CONTENT TO FUEL SEGMENT GROWTH
                    TABLE 58 BROADCAST: RF-OVER-FIBER MARKET, BY FREQUENCY BAND, 2020–2023 (USD MILLION)
                    TABLE 59 BROADCAST: MARKET, BY FREQUENCY BAND, 2024–2029 (USD MILLION)
    9.4 BROADBAND 
           9.4.1 INCREASED DEMAND FOR OTT PLATFORMS TO BOOST SEGMENT
                    TABLE 60 BROADBAND: RF-OVER-FIBER MARKET, BY FREQUENCY BAND, 2020–2023 (USD MILLION)
                    TABLE 61 BROADBAND: MARKET, BY FREQUENCY BAND, 2024–2029 (USD MILLION)
    9.5 RADAR 
           9.5.1 EXTENSIVE USE IN MARINE COMMUNICATIONS TO PROPEL SEGMENT
                    TABLE 62 RADAR: RF-OVER-FIBER MARKET, BY FREQUENCY BAND, 2020–2023 (USD MILLION)
                    TABLE 63 RADAR: MARKET, BY FREQUENCY BAND, 2024–2029 (USD MILLION)
    9.6 NAVIGATION 
           9.6.1 SURGE IN DEMAND FOR HIGH-QUALITY SIGNAL TRANSMISSION IN DEFENSE AND SECURITY TO DRIVE SEGMENT
                    TABLE 64 NAVIGATION: RF-OVER-FIBER MARKET, BY FREQUENCY BAND, 2020–2023 (USD MILLION)
                    TABLE 65 NAVIGATION: MARKET, BY FREQUENCY BAND, 2024–2029 (USD MILLION)
 
10 RF-OVER-FIBER MARKET, BY VERTICAL (Page No. - 129)
     10.1 INTRODUCTION 
             FIGURE 39 IT & TELECOMMUNICATIONS SEGMENT TO DOMINATE MARKET DURING FORECAST PERIOD
             TABLE 66 RF-OVER-FIBER MARKET, BY VERTICAL, 2020–2023 (USD MILLION)
             TABLE 67 MARKET, BY VERTICAL, 2024–2029 (USD MILLION)
     10.2 IT & TELECOMMUNICATIONS 
             10.2.1 RISE IN DEMAND FOR HIGH-DEFINITION AND HIGH-BANDWIDTH NETWORKING TO FUEL SEGMENT GROWTH
                        TABLE 68 IT & TELECOMMUNICATIONS: RF-OVER-FIBER MARKET, BY REGION, 2020–2023 (USD MILLION)
                        TABLE 69 IT & TELECOMMUNICATIONS: MARKET, BY REGION, 2024–2029 (USD MILLION)
     10.3 GOVERNMENT & DEFENSE 
             10.3.1 NEED FOR HIGH BANDWIDTH IN CRITICAL COMMUNICATIONS TO BOOST SEGMENT
                        TABLE 70 GOVERNMENT & DEFENSE: RF-OVER-FIBER MARKET, BY REGION, 2020–2023 (USD MILLION)
                        TABLE 71 GOVERNMENT & DEFENSE: MARKET, BY REGION, 2024–2029 (USD MILLION)
     10.4 MARINE 
             10.4.1 NEED FOR ROBUST AND RESILIENT COMMUNICATION TO PROPEL SEGMENT
                        TABLE 72 MARINE: RF-OVER-FIBER MARKET, BY REGION, 2020–2023 (USD MILLION)
                        TABLE 73 MARINE: MARKET, BY REGION, 2024–2029 (USD MILLION)
     10.5 COMMERCIAL AVIATION 
             10.5.1 DEMAND FOR HIGH-SPEED AND RELIABLE COMMUNICATION IN AIRCRAFT TO DRIVE SEGMENT
                        TABLE 74 COMMERCIAL AVIATION: RF-OVER-FIBER MARKET, BY REGION, 2020–2023 (USD MILLION)
                        TABLE 75 COMMERCIAL AVIATION: MARKET, BY REGION, 2024–2029 (USD MILLION)
     10.6 OTHERS 
             TABLE 76 OTHERS: RF-OVER-FIBER MARKET, BY REGION, 2020–2023 (USD MILLION)
             TABLE 77 OTHERS: MARKET, BY REGION, 2024–2029 (USD MILLION)
 
11 RF-OVER-FIBER MARKET, BY REGION (Page No. - 137)
     11.1 INTRODUCTION 
             FIGURE 40 MARKET IN ASIA PACIFIC TO WITNESS HIGHEST GROWTH DURING FORECAST PERIOD
             TABLE 78 RF-OVER-FIBER MARKET, BY REGION, 2020–2023 (USD MILLION)
             TABLE 79 MARKET, BY REGION, 2024–2029 (USD MILLION)
     11.2 NORTH AMERICA 
             FIGURE 41 NORTH AMERICA: RF-OVER-FIBER MARKET SNAPSHOT
             TABLE 80 NORTH AMERICA: MARKET, BY COUNTRY, 2020–2023 (USD MILLION)
             TABLE 81 NORTH AMERICA: MARKET, BY COUNTRY, 2024–2029 (USD MILLION)
             TABLE 82 NORTH AMERICA: MARKET, BY FREQUENCY BAND, 2020–2023 (USD MILLION)
             TABLE 83 NORTH AMERICA: MARKET, BY FREQUENCY BAND, 2024–2029 (USD MILLION)
             TABLE 84 NORTH AMERICA: MARKET, BY DEPLOYMENT, 2020–2023 (USD MILLION)
             TABLE 85 NORTH AMERICA: MARKET, BY DEPLOYMENT, 2024–2029 (USD MILLION)
             TABLE 86 NORTH AMERICA: MARKET, BY VERTICAL, 2020–2023 (USD MILLION)
             TABLE 87 NORTH AMERICA: MARKET, BY VERTICAL, 2024–2029 (USD MILLION)
             11.2.1 US
                        11.2.1.1 Increased infrastructure spending to fuel market growth
             11.2.2 CANADA
                        11.2.2.1 Rapid adoption of advanced technologies to propel market
             11.2.3 MEXICO
                        11.2.3.1 Increased investments in technological upgrades to boost market
             11.2.4 NORTH AMERICA: RECESSION IMPACT
     11.3 EUROPE 
             FIGURE 42 EUROPE: RF-OVER-FIBER MARKET SNAPSHOT
             TABLE 88 EUROPE: MARKET, BY COUNTRY, 2020–2023 (USD MILLION)
             TABLE 89 EUROPE: MARKET, BY COUNTRY, 2024–2029 (USD MILLION)
             TABLE 90 EUROPE: MARKET, BY FREQUENCY BAND, 2020–2023 (USD MILLION)
             TABLE 91 EUROPE: MARKET, BY FREQUENCY BAND, 2024–2029 (USD MILLION)
             TABLE 92 EUROPE: MARKET, BY DEPLOYMENT, 2020–2023 (USD MILLION)
             TABLE 93 EUROPE: PLOYMENT, 2024–2029 (USD MILLION)
             TABLE 94 EUROPE: MARKET, BY VERTICAL, 2020–2023 (USD MILLION)
             TABLE 95 EUROPE: MARKET, BY VERTICAL, 2024–2029 (USD MILLION)
             11.3.1 GERMANY
                        11.3.1.1 Growing focus on development of advanced optical fiber infrastructure to boost market
             11.3.2 UK
                        11.3.2.1 Rise in broadband connectivity to drive market
             11.3.3 FRANCE
                        11.3.3.1 Surge in demand for optical networking to boost market
             11.3.4 REST OF EUROPE
             11.3.5 EUROPE: RECESSION IMPACT
     11.4 ASIA PACIFIC 
             FIGURE 43 ASIA PACIFIC: RF-OVER-FIBER MARKET SNAPSHOT
             TABLE 96 ASIA PACIFIC: MARKET, BY COUNTRY, 2020–2023 (USD MILLION)
             TABLE 97 ASIA PACIFIC: MARKET, BY COUNTRY, 2024–2029 (USD MILLION)
             TABLE 98 ASIA PACIFIC: MARKET, BY FREQUENCY BAND, 2020–2023 (USD MILLION)
             TABLE 99 ASIA PACIFIC: MARKET, BY FREQUENCY BAND, 2024–2029 (USD MILLION)
             TABLE 100 ASIA PACIFIC: MARKET, BY DEPLOYMENT, 2020–2023 (USD MILLION)
             TABLE 101 ASIA PACIFIC:  MARKET, BY DEPLOYMENT, 2024–2029 (USD MILLION)
             TABLE 102 ASIA PACIFIC: MARKET, BY VERTICAL, 2020–2023 (USD MILLION)
             TABLE 103 ASIA PACIFIC: MARKET, BY VERTICAL, 2024–2029 (USD MILLION)
             11.4.1 CHINA
                        11.4.1.1 Rapid adoption of advanced communication technologies to boost demand
             11.4.2 JAPAN
                        11.4.2.1 Significant growth in number of 4G/LTE connections to drive market
             11.4.3 SOUTH KOREA
                        11.4.3.1 Increased demand for 5G technology to boost market
             11.4.4 REST OF ASIA PACIFIC
             11.4.5 ASIA PACIFIC: RECESSION IMPACT
     11.5 ROW 
             TABLE 104 ROW: RF-OVER-FIBER MARKET, BY REGION, 2020–2023 (USD MILLION)
             TABLE 105 ROW: MARKET, BY COUNTRY, 2024–2029 (USD MILLION)
             TABLE 106 ROW: MARKET, BY FREQUENCY BAND, 2020–2023 (USD MILLION)
             TABLE 107 ROW: MARKET, BY FREQUENCY BAND, 2024–2029 (USD MILLION)
             TABLE 108 ROW: MARKET, BY DEPLOYMENT, 2020–2023 (USD MILLION)
             TABLE 109 ROW: MARKET, BY DEPLOYMENT, 2024–2029 (USD MILLION)
             TABLE 110 ROW: MARKET, BY VERTICAL, 2020–2023 (USD MILLION)
             TABLE 111 ROW: MARKET, BY VERTICAL, 2024–2029 (USD MILLION)
             11.5.1 SOUTH AMERICA
                        11.5.1.1 Various initiatives to enhance communication infrastructure across different sectors to drive market
             11.5.2 MIDDLE EAST & AFRICA
                        11.5.2.1 Rapid expansion of telecommunications networks to support market
             11.5.3 ROW: RECESSION IMPACT
 
12 COMPETITIVE LANDSCAPE (Page No. - 162)
     12.1 OVERVIEW 
     12.2 STRATEGIES ADOPTED BY KEY PLAYERS 
             TABLE 112 RF-OVER-FIBER MARKET: OVERVIEW OF STRATEGIES ADOPTED BY KEY PLAYERS
             12.2.1 PRODUCT/SERVICE PORTFOLIO
             12.2.2 REGIONAL FOCUS
             12.2.3 ORGANIC/INORGANIC GROWTH STRATEGIES
     12.3 MARKET SHARE ANALYSIS, 2022 
             FIGURE 44 MARKET SHARE ANALYSIS OF KEY PLAYERS, 2022
             TABLE 113 MARKET SHARE ANALYSIS, 2022
     12.4 REVENUE ANALYSIS, 2018–2022 
             FIGURE 45 REVENUE ANALYSIS OF KEY PLAYERS, 2018–2022
     12.5 COMPANY EVALUATION MATRIX, 2022 
             12.5.1 STARS
             12.5.2 EMERGING LEADERS
             12.5.3 PERVASIVE PLAYERS
             12.5.4 PARTICIPANTS
                        FIGURE 46 RF-OVER-FIBER MARKET: COMPANY EVALUATION MATRIX, 2022
             12.5.5 COMPANY FOOTPRINT
                        TABLE 114 COMPANY FOOTPRINT, BY APPLICATION
                        TABLE 115 COMPANY FOOTPRINT, BY VERTICAL
                        TABLE 116 COMPANY FOOTPRINT, BY REGION
                        TABLE 117 OVERALL COMPANY FOOTPRINT
     12.6 START-UPS/ SMESEVALUATION MATRIX, 2022 
                        TABLE 118 RF-OVER-FIBER MARKET: LIST OF KEY START-UPS/SMES
             12.6.1 COMPETITIVE BENCHMARKING
                        TABLE 119 COMPANY FOOTPRINT, BY APPLICATION
                        TABLE 120 COMPANY FOOTPRINT, BY VERTICAL
                        TABLE 121 COMPANY FOOTPRINT, BY REGION
             12.6.2 PROGRESSIVE COMPANIES
             12.6.3 RESPONSIVE COMPANIES
             12.6.4 DYNAMIC COMPANIES
             12.6.5 STARTING BLOCKS
                        FIGURE 47 RF-OVER-FIBER MARKET: START-UPS/SMES EVALUATION MATRIX, 2022
     12.7 COMPETITIVE SCENARIOS AND TRENDS 
             12.7.1 PRODUCT LAUNCHES
                        TABLE 122 MARKET: PRODUCT LAUNCHES, 2020–2023
             12.7.2 DEALS
                        TABLE 123 MARKET: DEALS, 2020–2023
 
13 COMPANY PROFILES (Page No. - 183)
(Business overview, Products/Services/Solutions offered, Recent developments & MnM View)*  
     13.1 KEY PLAYERS 
             13.1.1 COHERENT CORP.
                        TABLE 124 COHERENT CORP.: COMPANY OVERVIEW
                        FIGURE 48 COHERENT CORP.: COMPANY SNAPSHOT
                        TABLE 125 COHERENT CORP.: PRODUCTS/SERVICES/SOLUTIONS OFFERED
                        TABLE 126 COHERENT CORP.: PRODUCT LAUNCHES
             13.1.2 HUBER+SUHNER
                        TABLE 127 HUBER+SUHNER: COMPANY OVERVIEW
                        FIGURE 49 HUBER+SUHNER: COMPANY SNAPSHOT
                        TABLE 128 HUBER+SUHNER: PRODUCTS/SERVICES/SOLUTIONS OFFERED
                        TABLE 129 HUBER+SUHNER: PRODUCT LAUNCHES
                        TABLE 130 HUBER+SUHNER: DEALS
             13.1.3 EMCORE CORPORATION
                        TABLE 131 EMCORE CORPORATION: COMPANY OVERVIEW
                        FIGURE 50 EMCORE CORPORATION: COMPANY SNAPSHOT
                        TABLE 132 EMCORE CORPORATION: PRODUCTS/SERVICES/SOLUTIONS OFFERED
                        TABLE 133 EMCORE CORPORATION: PRODUCT LAUNCHES
                        TABLE 134 EMCORE CORPORATION: DEALS
             13.1.4 G&H GROUP
                        TABLE 135 G&H GROUP: COMPANY OVERVIEW
                        FIGURE 51 G&H GROUP: COMPANY SNAPSHOT
                        TABLE 136 G&H GROUP: PRODUCTS/SERVICES/SOLUTIONS OFFERED
                        TABLE 137 G&H GROUP: DEALS
             13.1.5 SEIKOH GIKEN CO., LTD
                        TABLE 138 SEIKOH GIKEN CO., LTD: COMPANY OVERVIEW
                        FIGURE 52 SEIKOH GIKEN CO., LTD: COMPANY SNAPSHOT
                        TABLE 139 SEIKOH GIKEN CO., LTD: PRODUCTS/SERVICES/SOLUTIONS OFFERED
                        TABLE 140 SEIKOH GIKEN CO., LTD: OTHERS
             13.1.6 BROADCOM
                        TABLE 141 BROADCOM: COMPANY OVERVIEW
                        FIGURE 53 BROADCOM: COMPANY SNAPSHOT
                        TABLE 142 BROADCOM: PRODUCTS/SERVICES/SOLUTIONS OFFERED
                        TABLE 143 BROADCOM: PRODUCT LAUNCHES
             13.1.7 DEV SYSTEMTECHNIK GMBH
                        TABLE 144 DEV SYSTEMTECHNIK GMBH: COMPANY OVERVIEW
                        TABLE 145 DEV SYSTEMTECHNIK GMBH: PRODUCTS/SERVICES/SOLUTIONS OFFERED
                        TABLE 146 DEV SYSTEMTECHNIK GMBH: PRODUCT LAUNCHES
                        TABLE 147 DEV SYSTEMTECHNIK GMBH: DEALS
             13.1.8 GLOBAL FOXCOM
                        TABLE 148 GLOBAL FOXCOM: COMPANY OVERVIEW
                        TABLE 149 GLOBAL FOXCOM: PRODUCTS/SERVICES/SOLUTIONS OFFERED
             13.1.9 OPTICAL ZONU CORPORATION
                        TABLE 150 OPTICAL ZONU CORPORATION: COMPANY OVERVIEW
                        TABLE 151 OPTICAL ZONU CORPORATION: PRODUCTS/SERVICES/SOLUTIONS OFFERED
                        TABLE 152 OPTICAL ZONU CORPORATION: PRODUCT LAUNCHES
             13.1.10 VIALITE
                        TABLE 153 VIALITE: COMPANY OVERVIEW
                        TABLE 154 VIALITE: PRODUCTS/SERVICES/SOLUTIONS OFFERED
*Details on Business overview, Products/Services/Solutions offered, Recent developments & MnM View might not be captured in case of unlisted companies.  
     13.2 OTHER PLAYERS 
             13.2.1 APIC CORPORATION
             13.2.2 GLENAIR
             13.2.3 TERAXION
             13.2.4 RF-LAMBDA
             13.2.5 QUINTECH ELECTRONICS & COMMUNICATIONS, INC.
             13.2.6 MICROWAVE PHOTONIC SYSTEMS, INC.
             13.2.7 OCTANE WIRELESS
             13.2.8 RFOPTIC
             13.2.9 DIAMOND SA
             13.2.10 WISYCOM
             13.2.11 THOR BROADCAST
             13.2.12 SYNTONICS LLC
             13.2.13 ATLANTIC MICROWAVE
             13.2.14 INTELIBS, INC.
             13.2.15 RF SPIN, S.R.O.
 
14 APPENDIX (Page No. - 228)
     14.1 DISCUSSION GUIDE 
     14.2 KNOWLEDGESTORE: MARKETSANDMARKETS’ SUBSCRIPTION PORTAL 
     14.3 CUSTOMIZATION OPTIONS 
     14.4 RELATED REPORTS 
     14.5 AUTHOR DETAILS 


The study involved four major activities in estimating the current size of the RF-over-Fiber market. Exhaustive secondary research was done to collect information on the market, peer, and parent markets. The next step was to validate these findings, assumptions, and sizing with industry experts across the value chain through primary research. Both top-down and bottom-up approaches were employed to estimate the complete market size. After that, market breakdown and data triangulation were used to estimate the market size of segments and subsegments.

Secondary Research

Various secondary sources have been referred to in the secondary research process for identifying and collecting information important for this study. The secondary sources include annual reports, press releases, and investor presentations of companies; white papers; journals and certified publications; and articles from recognized authors, websites, directories, and databases. Secondary research has been conducted to obtain key information about the industry’s supply chain, the market’s value chain, the total pool of key players, market segmentation according to the industry trends (to the bottom-most level), regional markets, and key developments from market- and technology-oriented perspectives. The secondary data has been collected and analyzed to determine the overall market size, further validated by primary research.

List of major secondary sources

Sources

Web Link

The Optical Society (OSA)

https://www.osa.org/en-us/home/

IEEE Communications Society (ComSoc)

https://www.comsoc.org/

IEEE Photonics Society

https://www.photonicssociety.org/

The Fiber Optic Association, Inc.

https://www.thefoa.org/

The Fiber Optic Sensing Association (FOSA)

https://www.fiberopticsensing.org/

Journal of Optical Communications and Networking

https://www.osapublishing.org/jocn/journal/jocn

European Optical Society

https://www.myeos.org/

The Optical Society (OSA)

https://www.osa.org/en-us/home/

Primary Research

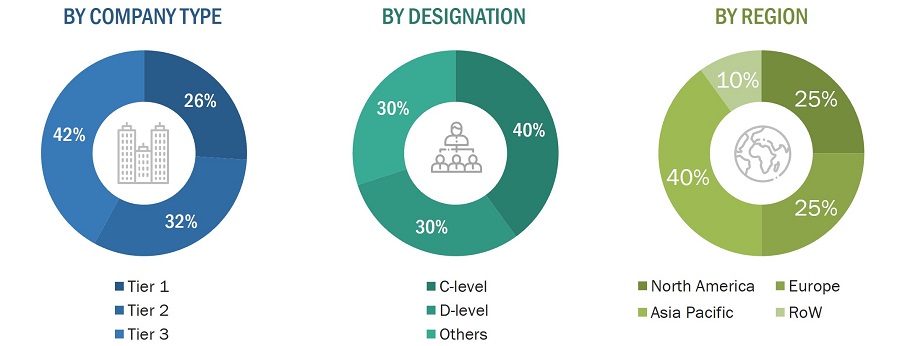
Extensive primary research was conducted after gaining knowledge about the current scenario of the RF-over-Fiber market through secondary research. Several primary interviews were conducted with experts from both the demand and supply sides across four major regions—North America, Europe, Asia Pacific and RoW. This primary data was collected through questionnaires, emails, and telephonic interviews.
RF-Over-Fiber Market Size, and Share

To know about the assumptions considered for the study, download the pdf brochure

Market Size Estimation

In the complete market engineering process, both top-down and bottom-up approaches have been used, along with several data triangulation methods, to perform market estimation and forecasting for the overall market segments and subsegments listed in this report. Key players in the market have been identified through secondary research, and their market shares in the respective regions have been determined through primary and secondary research. This entire procedure includes the study of annual and financial reports of the top market players and extensive interviews for key insights (quantitative and qualitative) with industry experts (CEOs, VPs, directors, and marketing executives).

All percentage shares, splits, and breakdowns have been determined using secondary sources and verified through primary sources. All the parameters affecting the markets covered in this research study have been accounted for, viewed in detail, verified through primary research, and analyzed to obtain the final quantitative and qualitative data. This data has been consolidated and supplemented with detailed inputs and analysis from MarketsandMarkets and presented in this report. The following figure represents this study’s overall market size estimation process.

Bottom-Up Approach

The bottom-up approach was used to arrive at the overall size of the RF-over-Fiber market from the revenues of the key players and their shares in the market. The overall market size was calculated based on the revenues of the key players identified in the market.

  • Identifying entities in the RF-over-Fiber value chain influencing the entire RF-over-Fiber industry
  • Analyzing each entity along with related major companies identifying technology providers for the implementation of products and services
  • Estimating the market for these RF-over-Fiber end users
  • Tracking ongoing and upcoming implementation of RF-over-Fiber developments by various companies and forecasting the market based on these developments and other critical parameters
  • Arriving at the market size by analyzing RF-over-Fiber companies based on their countries and then combining it to get the market estimate by region
  • Verifying estimates and crosschecking them by a discussion with key opinion leaders, which include CXOs, directors, and operation managers

RF-Over-Fiber Market Size, and Bottom-Up Approach

Top-Down Approach

In the top-down approach, the overall market size has been used to estimate the size of individual markets (mentioned in the market segmentation) through percentage splits from secondary and primary research.

The most appropriate immediate parent market size has been used to implement the top-down approach to calculate the market size of specific segments. The top-down approach has been implemented for the data extracted from the secondary research to validate the market size obtained.

Each company’s market share has been estimated to verify the revenue shares used earlier in the top-down approach. This study has determined and confirmed the overall parent market and individual market sizes by the data triangulation method and data validation through primaries. The data triangulation method in this study is explained in the next section.

  • Focusing initially on topline investments by market players in the RF-over-Fiber ecosystem
  • Calculating the market size based on the revenue generated by market players through the sales of RF-over-Fiber components
  • Mapping the use of RF-over-Fiber in different component types
  • Building and developing the information related to the revenue generated by market players through key products
  • Estimating the geographic split using secondary sources considering factors, such as the number of players in a specific country and region, the role of major players in the development of innovative products, and adoption and penetration rates in a particular country for various components, frequency band, deployment, application, vertical.

RF-Over-Fiber Market Size, and Top-Down Approach

Data Triangulation

After arriving at the overall market size from the estimation process explained above, the overall market has been split into several segments and subsegments. The data triangulation procedure has been employed wherever applicable to complete the overall market engineering process and arrive at the exact statistics for all segments and subsegments. The data has been triangulated by studying various factors and trends from both the demand and supply sides. Additionally, the market size has been validated using top-down and bottom-up approaches.

Market Definition

RF over Fiber (RFoF) is an analog data transmission technology over optical fibers, where radio signals modulate light signals for wireless access. These signals are transmitted optically, typically between a central station and base stations, and are later converted back to RF for transmission through the air. RFoF technology is recognized for its low signal attenuation, making it ideal for long-distance wireless signal transmission via optical links, particularly in applications such as broadband and broadcasting. A typical RFoF system includes an RF source, optical transmitter, amplitude modulator, receiver, and fiber optic cables.

Key Stakeholders

  • Raw material and manufacturing equipment suppliers
  • Electronic design automation (EDA) and design tool vendors
  • Component manufacturers
  • Original equipment manufacturers (OEMs)
  • Integrated device manufacturers (IDMs)
  • Original design manufacturers (ODMs)
  • ODM and OEM technology solution providers
  • Assembly, testing, and packaging vendors
  • Technology, service, and solution providers
  • Intellectual property (IP) core and licensing providers
  • Suppliers and distributors
  • Government and other regulatory bodies
  • Technology investors
  • Research institutes and organizations

Report Objectives

  • To describe and forecast the RF-over-Fiber market, in terms of value, based on component, frequency band, deployment, application and, vertical.
  • To forecast the market size, in terms of value, for various segments with regard to 4 main regions, namely, North America, Europe, Asia Pacific (APAC), and the Rest of the World (RoW)
  • To provide detailed information regarding the major factors influencing the growth of the RF-over-Fiber market (drivers, restraints, opportunities, and industry-specific challenges)
  • To analyze the micromarkets with respect to individual growth trends, prospects, and contributions to the total market
  • To study the complete value chain and allied industry segments, and perform a value chain analysis of the RF-over-Fiber landscape
  • To analyze the opportunities in the market for various stakeholders by identifying the high-growth segments of the RF-over-Fiber market
  • To profile the key players and comprehensively analyze their market position in terms of ranking and core competencies, along with detailing the competitive landscape for the market leaders
  • To analyze competitive developments, such as partnerships and joint ventures, mergers and acquisitions, new product developments, expansions, and research and development, in the RF-over-Fiber market
  • To track and analyze competitive developments, such as partnerships, collaborations, agreements, joint ventures, mergers and acquisitions, expansions, product/service launches, and other developments in the market.

Available Customizations

With the given market data, MarketsandMarkets offers customizations according to the specific requirements of companies. The following customization options are available for the report:

  • Detailed analysis and profiling of additional market players (up to 5)
  • Additional country-level analysis of the RF-over-Fiber market

Product Analysis

  • Product matrix, which provides a detailed comparison of the product portfolio of each company in the RF-over-Fiber market.
Custom Market Research Services

We will customize the research for you, in case the report listed above does not meet with your exact requirements. Our custom research will comprehensively cover the business information you require to help you arrive at strategic and profitable business decisions.

Request Customization
Report Code
SE 6475
Published ON
Dec, 2023
Choose License Type
BUY NOW
  • SHARE
X
Request Customization
Speak to Analyst
Speak to Analyst
OR FACE-TO-FACE MEETING
PERSONALIZE THIS RESEARCH
  • Triangulate with your Own Data
  • Get Data as per your Format and Definition
  • Gain a Deeper Dive on a Specific Application, Geography, Customer or Competitor
  • Any level of Personalization
REQUEST A FREE CUSTOMIZATION
LET US HELP YOU!
  • What are the Known and Unknown Adjacencies Impacting the RF-Over-Fiber Market
  • What will your New Revenue Sources be?
  • Who will be your Top Customer; what will make them switch?
  • Defend your Market Share or Win Competitors
  • Get a Scorecard for Target Partners
CUSTOMIZED WORKSHOP REQUEST
+1-888-600-6441
  • Call Us
  • +1-888-600-6441 (Corporate office hours)
  • +1-888-600-6441 (US/Can toll free)
  • +44-800-368-9399 (UK office hours)
CONNECT WITH US
ABOUT TRUST ONLINE
©2024 MarketsandMarkets Research Private Ltd. All rights reserved
DMCA.com Protection Status Website Feedback