Rubber Process Oil Market by Type (Naphthenic, Paraffinic, Treated Distillate Aromatic Extract, DAE, MES, RAE and TRAE), and Region (North America, Europe, Asia Pacific, Middle East & Africa, and South America) - Global Forecast to 2023


[135 Pages Report] Rubber Process Oil Market is projected to grow from USD 1.85 billion in 2017 to USD 2.33 billion by 2023, at a CAGR of 4.1%, from 2018 to 2023.
The objectives of this study are:
- To define, describe, and forecast the rubber process oil market, in terms of value and volume, based on type and region
- To forecast the size of the rubber process oil market, in terms of value, for five key regions, namely, Asia Pacific, North America, Europe, the Middle East & Africa, and South America, along with their key countries
- To strategically analyze micro markets with respect to individual growth trends, prospects, and contribution to the overall market
- To analyze opportunities in the rubber process oil market for stakeholders and provide competitive landscape of the market
- To strategically profile key players operating in the rubber process oil market and comprehensively analyze their core competencies
- To analyze competitive developments, such expansions, new product launches, and agreements adopted by leading players in the rubber process oil market
The years considered for the study are as follows:
- Base Year-2017
- Estimated Year-2018
- Projected Year-2023
- Forecast Period-2018 to 2023
- For the company profiles in the report, 2017 has been considered the base year. In certain cases, wherein information is unavailable for the base year, the years prior to it have been considered.
Research Methodology
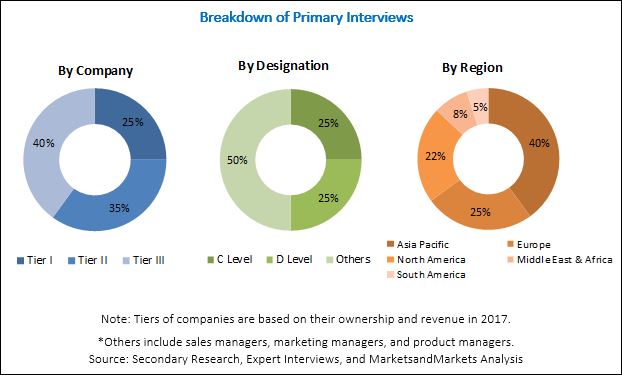
The research methodology used to estimate and forecast the size of the rubber process oil market begins with capturing data from the revenues of key vendors. This data has been obtained from various secondary sources, such as Hoovers, Bloomberg, Factiva, and various other government and private websites. The offerings of suppliers have been taken into consideration to determine the segmentation of the rubber process oil market. After arriving at the overall market size, it has been split into several segments and subsegments, which have been later verified through primary research by conducting extensive interviews with key personnel, such as chief executive officers, vice presidents, directors, and executives of leading companies operating in the rubber process oil market. Data triangulation and market breakdown procedures have been employed to complete the overall market engineering process and arrive at the exact statistics for all segments and subsegments of the rubber process oil market. The breakdown of profiles of primary interviews has been depicted in the figure below.
To know about the assumptions considered for the study, download the pdf brochure
The rubber process oil market has a diversified ecosystem of upstream players, which includes raw material suppliers, along with downstream stakeholders, vendors of rubber process oil, end users, and government organizations. Royal Dutch Shell plc (Netherlands), Chevron Corporation (US), Petronas Lubricants Belgium NV (Belgium), Nynas AB (Sweden), ORGKHIM Biochemical Holding (Russia), Repsol S.A. (Spain), and Hindustan Petroleum Corporation Limited (India) are some of the leading players operating in the rubber process oil market.
Target Audience
- Manufacturers of rubber process oil
- Traders, distributors, and suppliers of rubber process oil
- Government and research organizations
- Associations and industrial bodies
- R&D institutions
- Environment supporting agencies
- End-use industries of rubber process oil
- Investment banks & private equity firms
�This study answers several questions for the stakeholders, primarily the market segments that they need to focus upon during the next two to five years, so that they can prioritize their efforts and investments accordingly.�
Get online access to the report on the World's First Market Intelligence Cloud
- Easy to Download Historical Data & Forecast Numbers
- Company Analysis Dashboard for high growth potential opportunities
- Research Analyst Access for customization & queries
- Competitor Analysis with Interactive dashboard
- Latest News, Updates & Trend analysis
Request Sample Scope of the Report
:
Get online access to the report on the World's First Market Intelligence Cloud
- Easy to Download Historical Data & Forecast Numbers
- Company Analysis Dashboard for high growth potential opportunities
- Research Analyst Access for customization & queries
- Competitor Analysis with Interactive dashboard
- Latest News, Updates & Trend analysis

This research report categorizes the rubber process oil market based on type and region. It forecasts revenues as well as analyzes trends in each of the following submarkets.
Rubber Process Oil Market, By Type
- Naphthenic
- TDAE
- Paraffinic
- MES
- DAE
- RAE & TRAE
Rubber Process Oil Market, By Region
- Asia Pacific
- North America
- Europe
- Middle East & Africa
- South America
The following customization options are available for the report
MarketsandMarkets offers customizations as per the specific needs of companies with the given market data. The following customization options are available for the report:
- Further breakdown of Rest of Asia Pacific, Rest of Europe, and Rest of Middle East & Africa in kilotons
- Detailed analysis and profiling of the additional market players (up to five)
The rubber process oil market is projected to grow from USD 1.91 billion in 2018 to USD 2.33 billion by 2023, at a CAGR of 4.1 %, from 2018 to 2023. The growth of the rubber process oil market can be attributed to the increased consumption of rubber process oils in the manufacturing of tires. The growing number of automobiles across the globe has contributed to the increasing demand for tires, thereby leading to the growth of the rubber process oil market.
The rubber process oil can be classified into Naphthenic, TDAE, Paraffinic, MES, DAE, and RAE & TRAE. The TDAE segment is projected to grow at the highest CAGR, in terms of value, between 2018 and 2023. The formulation and implementation of regulations banning the use of DAE in the European region have led to an increase in the consumption of TDAE in the region.
Asia Pacific is the leading market of rubber process oils, followed by North America and European regions. The growth of the Asia Pacific rubber process oil market can be attributed to increase in the sales of automobiles in the region that is expected to boost the consumption of rubber process oils in the tire and rubber market of the region. Various leading players have adopted the strategies of expansions, new product launches, and agreements, to meet the growing demand for rubber process oil.
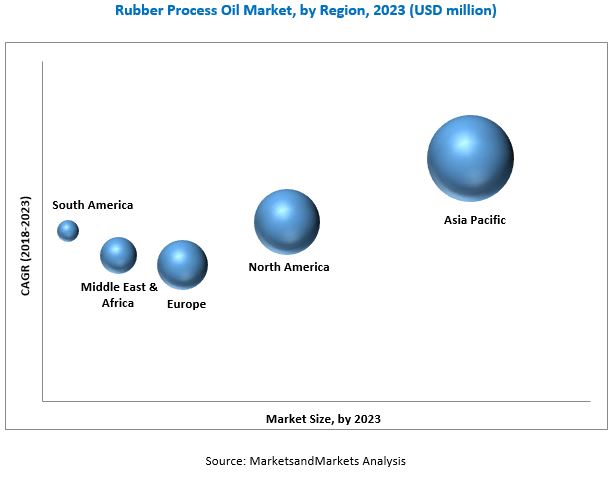
The formulation and issuance of several regulatory guidelines by different governing bodies across the globe to encourage the manufacturing of environmentally-friendly products are expected to hamper the growth of the rubber process oil market, globally. In terms of value, the Asia Pacific region is estimated to account for the largest share of the rubber process oil market in 2018. The growth of the Asia Pacific rubber process oil market can be attributed to increase in the sales of automobiles in the region that is expected to boost the consumption of rubber process oils in the tire and rubber market of the region. The US and China are the largest consumers of rubber process oils, globally. Most of the tire manufacturing companies prefer local suppliers of rubber process oils to ensure their smooth and uninterrupted supply.
Royal Dutch Shell plc (Netherlands), Chevron Corporation (US), Petronas Lubricants Belgium NV (Belgium), Nynas AB (Sweden), ORGKHIM Biochemical Holding (Russia), Repsol S.A. (Spain), and Hindustan Petroleum Corporation Limited (India) are among the leading players operating in the rubber process oil market. These companies have adopted various strategies, such as expansions, new product launches, and agreements to meet the growing demand for rubber process oil as well as increase their market presence.
To speak to our analyst for a discussion on the above findings, click Speak to Analyst
Table of Contents
1 Introduction (Page No. - 14)
1.1 Objectives of the Study
1.2 Market Definition
1.3 Market Scope
1.3.1 Years Considered for the Study
1.4 Currency
1.5 Stakeholders
1.6 Limitations
2 Research Methodology (Page No. - 17)
2.1 Research Data
2.1.1 Secondary Data
2.1.1.1 Key Data From Secondary Sources
2.1.2 Primary Data
2.1.2.1 Key Data From Primary Sources
2.1.2.2 Key Industry Insights
2.1.2.3 Breakdown of Primary Interviews
2.2 Market Size Estimation
2.3 Data Triangulation
2.4 Assumptions
3 Executive Summary (Page No. - 25)
4 Premium Insights (Page No. - 28)
4.1 Attractive Opportunities in Rubber Process Oil Market
4.2 Rubber Process Oil Market, By Type
4.3 Rubber Process Oil Market, By Region
5 Market Overview (Page No. - 31)
5.1 Introduction
5.2 Regulations
5.3 Market Dynamics
5.3.1 Drivers
5.3.1.1 Growing Tire Manufacturing Industry Across the Globe
5.3.1.2 Increasing Demand and Consumption of Rubber Process Oils in the Asia Pacific Region
5.3.1.3 Growing Use of Solution Styrene-Butadiene Rubber (S-SBR) in Tires of Automobiles
5.3.1.4 Growing Demand for Low-Viscosity Oils for Use in Vehicles
5.3.2 Restraints
5.3.2.1 Implementation on the European Union Directive Banning the Use Polycyclic Aromatic Hydrocarbons in the Tire Manufacturing
5.3.2.2 Increased Use of Soybean Oil as an Alternative for Rubber Process Oil in Tire Manufacturing
5.3.3 Opportunities
5.3.3.1 Increasing Demand for Green Rubber Process Oils Across the Globe
5.3.4 Challenges
5.3.4.1 Fluctuating Prices of Crude Oil
5.4 Porter�s Five Forces Analysis
5.4.1 Bargaining Power of Suppliers
5.4.2 Bargaining Power of Buyers
5.4.3 Threat of Substitutes
5.4.4 Threat of New Entrants
5.4.5 Intensity of Competitive Rivalry
6 Rubber Process Oil Market, By Type (Page No. - 40)
6.1 Introduction
6.2 Treated Distillate Aromatic Extracted (TDAE)
6.3 Distillate Aromatic Extract
6.4 Mild Extracted Solvate
6.5 Residual Aromatic Extract (RAE) and Treated Residual Aromatic Extract (TRAE)
6.6 Paraffinic
6.7 Naphthenic
7 Rubber Process Oil Market, By Region (Page No. - 53)
7.1 Introduction
7.2 Asia Pacific
7.2.1 China
7.2.2 India
7.2.3 Japan
7.2.4 South Korea
7.2.5 Indonesia
7.2.6 Thailand
7.2.7 Rest of Asia Pacific
7.3 North America
7.3.1 US
7.3.2 Canada
7.3.3 Mexico
7.4 Europe
7.4.1 Russia
7.4.2 Germany
7.4.3 UK
7.4.4 France
7.4.5 Spain
7.4.6 Italy
7.4.7 Rest of Europe
7.5 Middle East & Africa
7.5.1 Saudi Arabia
7.5.2 UAE
7.5.3 Iran
7.5.4 Rest of Middle East & Africa
7.6 South America
7.6.1 Brazil
7.6.2 Argentina
7.6.3 Colombia
7.6.4 Rest of South America
8 Competitive Landscape (Page No. - 97)
8.1 Overview
8.2 Market Ranking of Key Players
8.3 Competitive Scenario
8.3.1 Expansions
8.3.2 New Product Launches
8.3.3 Acquisitions
8.3.4 Agreements
9 Company Profiles (Page No. - 102)
(Business Overview, Products Offered, Recent Developments, SWOT Analysis, MnM View)*
9.1 Nynas AB
9.2 Apar Industries Limited
9.3 Panama Petrochem Ltd.
9.4 Hollyfrontier Refining & Marketing LLC
9.5 Behran Oil Company
9.6 Gandhar Oil Refinery (India) Limited
9.7 Hindustan Petroleum Corporation Limited (HPCL)
9.8 Total S.A.
9.9 Indian Oil Corporation Limited
9.10 Unipetrol Group
9.11 Idemitsu Kosan Co., Ltd.
9.12 Repsol S.A.
9.13 Orgkhim Biochemical Holding
*Details on Business Overview, Products Offered, Recent Developments, SWOT Analysis, MnM View Might Not Be Captured in Case of Unlisted Companies.
9.14 Other Key Players
9.14.1 CPC Corporation
9.14.2 Shell Global
9.14.3 Eagle Petrochem
9.14.4 Lodha Petro
9.14.5 WBF Pte Ltd.
9.14.6 Southwestern Petroleum Corporation
9.14.7 Cross Oil Refining & Marketing, Inc.
9.14.8 Kite International
9.14.9 Iranol
9.14.10 Vintrol Lubes Pvt. Ltd.
9.14.11 Petro Gulf Fzc
9.14.12 Witmans Industries Pvt. Ltd.
9.14.13 Sterlite Lubricants Pvt. Ltd.
9.14.14 Gulf Petroleum Ltd.
9.14.15 Wellbank Global Pte Ltd.
9.14.16 Ergon North & South America
10 Appendix (Page No. - 140)
10.1 Discussion Guide
10.2 Knowledge Store: Marketsandmarkets� Subscription Portal
10.3 Available Customizations
10.4 Related Reports
10.5 Author Details
List of Tables (93 Tables)
Table 1 Rubber Process Oil Market Snapshot
Table 2 Car and Commercial Vehicles Production, By Country, 2017
Table 3 Comparison of Different Types of Rubber Process Oils
Table 4 Rubber Process Oil Market, By Type, 2016�2023 (USD Million)
Table 5 Rubber Process Oil Market, By Type, 2016�2023 (Kilotons)
Table 6 TDAE Rubber Process Oil Market, By Region, 2016�2023 (USD Million)
Table 7 TDAE Rubber Process Oil Market, By Region, 2016�2023 (Kilotons)
Table 8 DAE Rubber Process Oil Market, By Region, 2016�2023 (USD Million)
Table 9 DAE Rubber Process Oil Market, By Region, 2016�2023 (Kilotons)
Table 10 MES Rubber Process Oil Market, By Region, 2016�2023 (USD Million)
Table 11 MES Rubber Process Oil Market, By Region, 2016�2023 (Kilotons)
Table 12 RAE & TRAE Rubber Process Oil Market, By Region, 2016�2023 (USD Million)
Table 13 RAE & TRAE Rubber Process Oil Market, By Region, 2016�2023 (Kilotons)
Table 14 Paraffinic Rubber Process Oil Market, By Region, 2016�2023 (USD Million)
Table 15 Paraffinic Rubber Process Oil Market, By Region, 2016�2023 (Kilotons)
Table 16 Naphthenic Rubber Process Oil Market, By Region, 2016�2023 (USD Million)
Table 17 Naphthenic Rubber Process Oil Market, By Region, 2016�2023 (Kilotons)
Table 18 Rubber Process Oil Market, By Region, 2016-2023 (USD Million)
Table 19 Rubber Process Oil Market, By Region, 2016-2023 (Kiloton)
Table 20 Asia Pacific By Market, By Type, 2016�2023 (USD Million)
Table 21 Asia Pacific By l Market, By Type, 2016�2023 (Kilotons)
Table 22 Asia Pacific By Market, By Country, 2016�2023 (USD Million)
Table 23 Asia Pacific By Market, By Country, 2016�2023 (Kilotons)
Table 24 China By Market, By Type, 2016�2023 (USD Million)
Table 25 China By Market, By Type, 2016�2023 (Kilotons)
Table 26 India By Market, By Type, 2016�2023 (USD Million)
Table 27 India By Market, By Type, 2016�2023 (Kilotons)
Table 28 Japan By Market, By Type, 2016�2023 (USD Million)
Table 29 Japan By Market, By Type, 2016�2023 (Kilotons)
Table 30 South Korea By Market, By Type, 2016�2023 (USD Million)
Table 31 South Korea By Market, By Type, 2016�2023 (Kilotons)
Table 32 Indonesia By Market, By Type, 2016�2023 (USD Million)
Table 33 Indonesia By Market, By Type, 2016�2023 (Kilotons)
Table 34 Thailand By Market, By Type, 2016�2023 (USD Million)
Table 35 Thailand By Market, By Type, 2016�2023 (Kilotons)
Table 36 Rest of Asia Pacific By Market, By Type, 2016�2023 (USD Million)
Table 37 Rest of Asia Pacific By Market, By Type, 2016�2023 (Kilotons)
Table 38 North America By Market, By Type, 2016�2023 (USD Million)
Table 39 North America By Market, By Type, 2016�2023 (Kilotons)
Table 40 North America By Market, By Country, 2016�2023 (USD Million)
Table 41 North America By Market, By Country, 2016�2023 (Kilotons)
Table 42 US By Market, By Type, 2016�2023 (USD Million)
Table 43 US By Market, By Type, 2016�2023 (Kilotons)
Table 44 Canada By Market, By Type, 2016�2023 (USD Million)
Table 45 Canada By Market, By Type, 2016�2023 (Kilotons)
Table 46 Mexico By Market, By Type, 2016�2023 (USD Million)
Table 47 Mexico By Market, By Type, 2016�2023 (Kilotons)
Table 48 Europe By Market, By Type, 2016�2023 (USD Million)
Table 49 Europe By Market, By Type, 2016�2023 (Kilotons)
Table 50 Europe By Market, By Country, 2016�2023 (USD Million)
Table 51 Europe By Market, By Country, 2016�2023 (Kilotons)
Table 52 Russia By Market, By Type, 2016�2023 (USD Million)
Table 53 Russia By Market, By Type, 2016�2023 (Kilotons)
Table 54 Germany By Market, By Type, 2016�2023 (USD Million)
Table 55 Germany By Market, By Type, 2016�2023 (Kilotons)
Table 56 UK By Market, By Type, 2016�2023 (USD Million)
Table 57 UK By Market, By Type, 2016�2023 (Kilotons)
Table 58 France By Market, By Type, 2016�2023 (USD Million)
Table 59 France By Market, By Type, 2016�2023 (Kilotons)
Table 60 Spain By Market, By Type, 2016�2023 (USD Million)
Table 61 Spain By Market, By Type, 2016�2023 (Kilotons)
Table 62 Italy By Market, By Type, 2016�2023 (USD Million)
Table 63 Italy By Market, By Type, 2016�2023 (Kilotons)
Table 64 Rest of Europe By Market, By Type, 2016�2023 (USD Million)
Table 65 Rest of Europe By Market, By Type, 2016�2023 (Kilotons)
Table 66 Middle East & Africa By Market, By Type, 2016�2023 (USD Million)
Table 67 Middle East & Africa By Market, By Type, 2016�2023 (Kilotons)
Table 68 Middle East & Africa By Market, By Country, 2016�2023 (USD Million)
Table 69 Middle East & Africa By Market, By Country, 2016�2023 (Kilotons)
Table 70 Saudi Arabia By Market, By Type, 2016�2023 (USD Million)
Table 71 Saudi Arabia By Market, By Type, 2016�2023 (Kilotons)
Table 72 UAE By Market, By Type, 2016�2023 (USD Million)
Table 73 UAE By Market, By Type, 2016�2023 (Kilotons)
Table 74 Iran By Market, By Type, 2016�2023 (USD Million)
Table 75 Iran By Market, By Type, 2016�2023 (Kilotons)
Table 76 Rest of Middle East & Africa By Market, By Type, 2016�2023 (USD Million)
Table 77 Rest of Middle East & Africa By Market, By Type, 2016�2023 (Kilotons)
Table 78 South America By Market, By Type, 2016�2023 (USD Million)
Table 79 South America By Market, By Type, 2016�2023 (Kilotons)
Table 80 South America By Market, By Country, 2016�2023 (USD Million)
Table 81 South America By Market, By Country, 2016�2023 (Kilotons)
Table 82 Brazil By Market, By Type, 2016�2023 (USD Million)
Table 83 Brazil By Market, By Type, 2016�2023 (Kilotons)
Table 84 Argentina By Market, By Type, 2016�2023 (USD Million)
Table 85 Argentina By Market, By Type, 2016�2023 (Kilotons)
Table 86 Colombia By Market, By Type, 2016�2023 (USD Million)
Table 87 Colombia By Market, By Type, 2016�2023 (Kilotons)
Table 88 Rest of South America By Market, By Type, 2016�2023 (USD Million)
Table 89 Rest of South America By Market, By Type, 2016�2023 (Kilotons)
Table 90 Expansions, January 2015�July 2018
Table 91 New Product Launches, January 2015�July 2018
Table 92 Acquisitions, January 2015�July 2018
Table 93 Agreements, January 2015�July 2018
List of Figures (37 Figures)
Figure 1 Rubber Process Oil Market: Research Design
Figure 2 Bottom-Up Approach
Figure 3 Top-Down Approach
Figure 4 Rubber Process Oil Market: Data Triangulation
Figure 5 Based on Type, Naphthenic Segment Expected to Lead Rubber Process Oil Market Between 2018 and 2023
Figure 6 Asia Pacific Region Expected to Lead Rubber Process Oil Market in 2018
Figure 7 Increasing Demand From Global Tire Industry Offers Lucrative Growth Opportunities for Rubber Process Oil Market
Figure 8 Naphthenic Segment Expected to Lead Process Oil Market From 2018 to 2023
Figure 9 Asia Pacific Rubber Process Oil Market Expected to Grow at the Highest CAGR From 2018 to 2023
Figure 10 Rubber Process Oil Market Dynamics
Figure 11 Global Average Crude Oil Prices Per Barrel, 2010�2030
Figure 12 Rubber Process Oil Market: Porter�s Five Forces Analysis
Figure 13 Naphthenic Segment Expected to Lead Rubber Process Oil Market From 2018 to 2023
Figure 14 Asia Pacific TDAE Rubber Process Oil Market Projected to Grow at Highest CAGR From 2018 to 2023
Figure 15 Asia Pacific Region Projected to Lead the DAE Rubber Process Oil Market From 2018 to 2023
Figure 16 Asia Pacific Region Projected to Be the Largest Market for MES From 2018 to 2023
Figure 17 Asia Pacific RAE & TRAE Rubber Process Oil Market Projected to Grow at A Highest CAGR From 2018 to 2023
Figure 18 Asia Pacific Paraffinic Rubber Process Oil Market Projected to Grow at the Highest CAGR From 2018 to 2023
Figure 19 Asia Pacific Naphthenic Rubber Process Oil Market Projected to Grow at the Highest CAGR From 2018 to 2023
Figure 20 China Rubber Process Oil Market Projected to Grow at the Highest CAGR From 2018 to 2023
Figure 21 Asia Pacific is the Leading Market in Rubber Process Oil Market Projected to Grow at the Highest CAGR From 2018 to 2023
Figure 22 North America Rubber Process Oil Market
Figure 23 Europe Rubber Process Oil Market
Figure 24 Middle East & Africa Rubber Process Oil Market
Figure 25 South America Rubber Process Oil Market
Figure 26 Companies Adopted Organic Growth Strategies Between January 2015 and July 2018 to Strengthen Their Position in Rubber Process Oil Market
Figure 27 Nynas AB Expected to Lead Rubber Process Oil Market in 2018
Figure 28 Nynas AB: Company Snapshot
Figure 29 Apar Industries Limited: Company Snapshot
Figure 30 Panama Petrochem Ltd: Company Snapshot
Figure 31 Gandhar Oil Refinery (India) Limited: Company Snapshot
Figure 32 Hindustan Petroleum Corporation Limited: Company Snapshot
Figure 33 Total S.A.: Company Snapshot
Figure 34 Indian Oil Corporation Limited: Company Snapshot
Figure 35 Unipetrol Group: Company Snapshot
Figure 36 Idemitsu Kosan Co., Ltd.: Company Snapshot
Figure 37 Repsol S.A.: Company Snapshot


Growth opportunities and latent adjacency in Rubber Process Oil Market