Process Equipment Market for Seed Industry by Type (Cleaners, Dryers, Coaters, Graders, Separators, and Polishers), Crop Type (Cereals & Grains, Oilseeds & Pulses, and Fruits & Vegetables), Method, and Region - Global Forecast to 2022


[148 Pages Report] Process equipment market for seed industry includes processed seed market and seed processing equipment market. The processed seed market was valued at USD 51.63 Billion in 2016 and is projected to reach USD 91.32 Billion by 2022, growing at a CAGR of 10.2% from 2017, in terms of value. The seed processing equipment market was valued at USD 1.84 Billion in 2016 and is projected to reach USD 3.25 Billion by 2022 and growing with a CAGR of 10.2% from 2017. The objectives of this study are to define, segment, and project the size of the processed seed market based on crop type, method, and region, and seed processing equipment market based on type and region.
For More details on this research, Request Free Sample Report
The report also aims to do the following:
- To provide detailed information about the major factors influencing the growth of the process equipment market for seed industry (drivers, restraints, opportunities, and industry-specific challenges)
- To analyze the opportunities in the market for stakeholders and provide details of the competitive landscape for market leaders
- To analyze the competitive environment of the process equipment market for seed industry
- To provide the analysis of the research & development spending and funding activities in the process equipment market for seed industry
- To project the size of the market, in terms of value in the key regions, namely, North America, Europe, Asia Pacific, South America, and the Rest of the World (RoW)
- To strategically profile the key players and comprehensively analyze their core competencies
- To analyze the competitive developments�mergers, acquisitions, expansions, investments, divestments, agreements, joint ventures, partnerships, collaborations, and new product launches�in the process equipment market for seed industry
The periodization considered for the study are as follows:
- Base year: 2016
- Forecast period: 2017 to 2022
The report process equipment market for seed includes the estimation of market size for value (USD billion/million), and volume (KT). Both, top-down and bottom-up approaches have been used to estimate and validate the size of the process equipment market for seed industry and to estimate the size of various other dependent submarkets in the overall market. Key players in the market have been identified through secondary research (FAO, Bloomberg Businessweek, Factiva, and companies� annual reports), and their market share has been determined through primary and secondary research. All percentage shares, splits, and breakdowns have been determined using secondary sources and verified through primary sources.
To know about the assumptions considered for the study, download the pdf brochure
Market Ecosystem: Process Equipment Market for Seed
The various contributors involved in the value chain of the proceed seed market include manufacturers, suppliers, distributors, intermediaries, and customers, and agricultural product manufacturers [such as Bayer (Germany), The Dow Chemical Company (US), Monsanto (US), Syngenta (Switzerland), KWS Group (Germany)] and seed processing equipment market such as Cimbria (Denmark), PETKUS Technologie (Germany), Lewis M. Carter Manufacturing (US), Westrup (Denmark), and Alvan Blanch Development Company (UK).
Target Audience
- Associations and industry bodies
- Commercial research & development (R&D) institutions
- Processed seed manufacturers and suppliers
- Seed processing equipment manufacturers and suppliers
- Raw material suppliers and distributors
- Traders, distributors, and retailers
- Agricultural institutes, associations, and government agencies
- Commercial growers
- Researchers
- Industry experts
Get online access to the report on the World's First Market Intelligence Cloud
Request Sample Scope of the Report

The process equipment market for seed industry is segmented as follows:
Processed Seed Market
On the basis of Crop Type:
- Cereals & grains
- Oilseeds & pulses
- Fruits & vegetables
- Others (alfalfa, clovers, flower seeds, and turf grasses)
On the basis of Method:
- Mechanical
- Biological
- Chemical
On the basis of Region:
- North America
- Europe
- Asia Pacific
- South America
- RoW (the Middle East & Africa)
Seed Processing Equipment Market
On the basis Type
- Cleaners
- Dryers
- Coaters
- Graders
- Separators
- Polishers
- Others (screeners and debearders.)
On the basis of Region:
- North America
- Europe
- Asia Pacific
- South America
- RoW (The Middle East and Africa)
Available Customizations
With the given market data, MarketsandMarkets offers customizations according to the client-specific needs.
The following customization options are available for the report:
Product Analysis
- Product matrix, which gives a detailed comparison of the product portfolio of each company
Application Analysis
- Application analysis, which gives a detailed analysis of other applications of process equipment market for seed industry
Regional Analysis
- Further breakdown of the Rest of South America process equipment market for seed industry into South American countries
- Further breakdown of the Rest of Asia Pacific process equipment market for seed industry into key contributing countries
- Company Information
- Detailed analysis and profiling of additional market players (up to five)
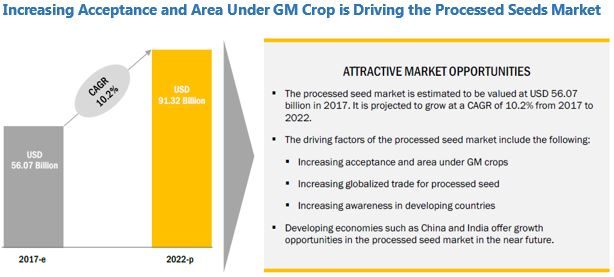
Process equipment market for seed industry includes processed seed market and seed processing equipment market. The processed seed market is estimated at USD 56.07 Billion in 2017 and is projected to reach USD 91.32 Billion by 2022, at a CAGR of 10.2% from 2017. On the other hand, the seed processing equipment market is projected to reach USD 3.25 Billion by 2022 from USD 2.00 Billion in 2017. Seed processing is crucial to make seeds ready for sowing. The necessity to increase food production and shrinking arable land has increased the demand for processed seeds, and consequently, seed processing equipment. Higher acceptance and area under GM crop, the rise in globalized trade for processed seed, and growth in awareness in developing countries are other factors driving the growth of process equipment market for seed.
For More details on this research, Request Free Sample Report
The processed seed market, on the basis of crop type, is projected to witness the highest growth rate in the fruits & vegetables segment, during the forecast period. The mechanical segment is estimated to dominate the processed seed market on the basis of method, through the same period. In the seed processing equipment market, on the basis of type, the coaters segment is projected to be the fastest-growing segment through the forecast years.
The cereals & grains segment dominated the processed seed market in 2016, globally, followed by oilseeds & pulses. Cereals & grains account a major portion of the staple diet of the population and animal feed diet as a primary source of energy. The North American region accounted for the largest market share for the mechanically processed seeds in 2016, and this trend is projected to continue over the next five years. The cleaners accounted for the largest share in the seed processing equipment market and the trend is projected to continue during the forecast period. Asia Pacific was the major market for this segment in 2016.
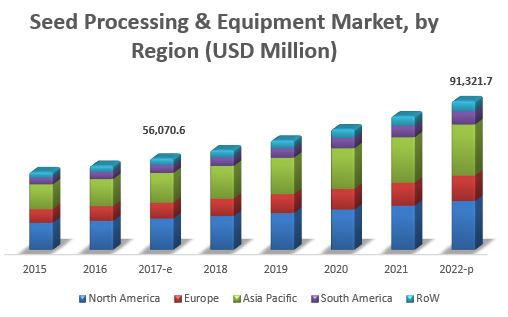
The North American region dominated the processed seed market and is projected to grow at a significant rate from 2017 to 2022, both in terms of value and volume. The US is projected to be the fastest-growing market in the region. The country is the largest producer of processed seed in the region. The processed seed market in the country is majorly driven by factors such as high usage of processed seed, technological advancements in farming, and the increased use of genetically modified crops. Multinational corporations in the US played a major role in the advancement of the process equipment market for seed industry, with continuously evolving technological innovations in agricultural and food systems.
The Asia Pacific region dominated the seed processing equipment market and is projected to grow at a significant rate from 2017 to 2022, in terms of value. China is projected to be the fastest-growing market in the region. China is estimated to be the largest producer and consumer of processed seeds and seed processing equipment in the region, in 2016. The increase in production of fruits & vegetables is a key factor for the growth in China�s agricultural exports that leads to an increase in the demand for commercial seed and seed processing equipment. However, the high prices of processed seeds is a major restraint for the growth of this market.
The processed seed market is organized and is dominated by few large players such as Bayer (Germany), The Dow Chemical Company (US), Monsanto (US), Syngenta (Switzerland), and KWS Group (Germany), while the seed processing equipment market is competitive and fragmented, with large-scale seed equipment manufacturers such as Cimbria (Denmark), PETKUS Technologie (Germany), Lewis M. Carter Manufacturing (US), Westrup (Denmark), and Alvan Blanch Development Company (UK), which have been profiled in the report. These leading players have adopted various strategies such as investments & expansions, new product launches, mergers & acquisitions, agreements, partnerships, joint ventures, and divestments to explore new and untapped markets, expanding in local areas of emerging markets, and developing a new customer base for long-term client relationships. This has not only enabled the key players to expand their geographical reach, but has also reinforced their market position by gaining a larger share in terms of revenue and product portfolios.
Small-scale players have also adopted these strategies to expand their businesses globally by investing in the establishment of manufacturing facilities and technical service centers in various regions. This inorganic growth strategy enables them to improve their technical expertise through intensive R&D infrastructure offered by bigger players.
To speak to our analyst for a discussion on the above findings, click Speak to Analyst
Table of Contents
1 Introduction (Page No. - 14)
1.1 Objectives of the Study
1.1.1 Market Intelligence
1.1.2 Competitive Intelligence
1.2 Market Definition
1.3 Market Scope
1.4 Years Considered for the Study
1.5 Currency Considered
1.6 Unit Considered
1.7 Stakeholders
2 Research Methodology (Page No. - 19)
2.1 Research Data
2.1.1 Secondary Research
2.1.2 Primary Research
2.1.2.1 Key Industry Insights
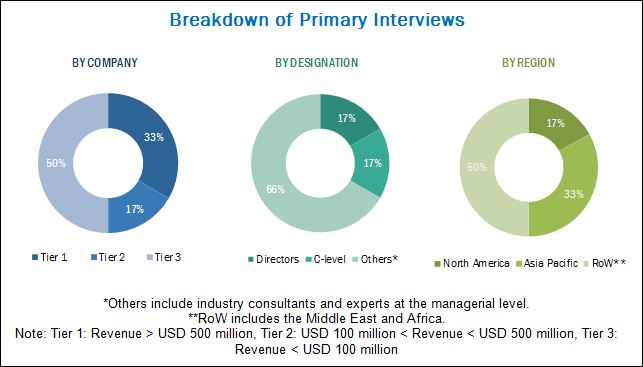
2.1.2.2 Breakdown of Primaries
2.2 Market Size Estimation
2.3 Market Breakdown & Data Triangulation
2.4 Assumptions and Limitations
2.4.1 Assumptions
2.4.2 Limitations
3 Executive Summary (Page No. - 26)
4 Premium Insights (Page No. - 31)
4.1 Opportunities in the Processed Seeds Market
4.2 Seed Processing Equipment Market, By Region, 2017 vs 2022
4.3 Processed Seeds Market, By Crop Type & Region
4.4 North America: Processed Seeds Market, By Method & Country
4.5 Processed Seeds Market, By Method & Region
4.6 Seed Processing Equipment Market, By Type & Region (USD Million)
5 Market Overview (Page No. - 35)
5.1 Introduction
5.2 Evolution of the Commercial Seed Market
5.3 Macro Indicators
5.3.1 Necessity to Increase Food Production
5.3.2 Shrinking Arable Land
5.4 Process Equipment Market for Seed: Market Dynamics
5.4.1 Drivers
5.4.1.1 Increasing Acceptance and Area Under GM Crop
5.4.1.2 Increasing Global Trade for Processed Seed
5.4.1.3 Increasing Awareness in Developing Countries
5.4.2 Restraints
5.4.2.1 High Price of Processed Seeds
5.4.3 Opportunities
5.4.3.1 Improving Seed Replacement Rate in Developing Countries
5.4.3.2 Arrival of New Technologies With Potential Advantages on Existing Conventional Crops
5.4.4 Challenges
5.4.4.1 Regulations in GM Crop
5.5 Value Chain Analysis
5.6 Supply Chain Analysis
6 Processed Seeds Market, By Crop Type (Page No. - 47)
6.1 Introduction
6.2 Cereals & Grains
6.3 Oilseeds & Pulses
6.4 Fruits & Vegetables
6.5 Other Crop Type
7 Processed Seeds Market, By Method (Page No. - 56)
7.1 Introduction
7.2 Mechanical
7.3 Biological
7.4 Chemical
8 Seed Processing Equipment Market, By Type (Page No. - 62)
8.1 Introduction
8.2 Cleaners
8.3 Dryers
8.4 Coaters
8.5 Graders
8.6 Separators
8.7 Polishers
8.8 Other Types
9 Process Equipment Market for Seed Industry, By Region (Page No. - 71)
9.1 Introduction
9.2 North America
9.2.1 US
9.2.2 Canada
9.2.3 Mexico
9.3 Europe
9.3.1 France
9.3.2 Germany
9.3.3 Italy
9.3.4 Spain
9.3.5 UK
9.3.6 Rest of Europe
9.4 Asia Pacific
9.4.1 China
9.4.2 India
9.4.3 Japan
9.4.4 Australia
9.4.5 Rest of Asia Pacific
9.5 South America
9.5.1 Brazil
9.5.2 Argentina
9.5.3 Rest of South America
9.6 Rest of the World (RoW)
9.6.1 Africa
9.6.2 Middle East
10 Competitive Landscape (Page No. - 110)
10.1 Overview
10.2 Market Ranking Analysis
10.2.1 Processed Seeds Market: Market Ranking Analysis
10.2.2 Seed Processing Equipment Market: Market Ranking Analysis
10.2.3 Investments & Expansions
10.2.4 New Product Launches
10.2.5 Mergers & Acquisitions
10.2.6 Agreements, Partnerships & Joint Ventures
10.2.7 Divestments
11 Company Profiles (Page No. - 115)
(Business Overview, Products Offered, Recent Developments, SWOT Analysis, MnM View)*
11.1 Introduction
11.2 Processed Seeds Manufacturers
11.2.1 Bayer
11.2.2 The DOW Chemical Company
11.2.3 Monsanto
11.2.4 Syngenta
11.2.5 KWS Group
11.3 Seed Processing Equipment Manufacturers
11.3.1 Cimbria A/S
11.3.2 PETKUS Technologie
11.3.3 Lewis M. Carter Manufacturing
11.3.4 Westrup
11.3.5 Alvan Blanch Development Company
*Details on Business Overview, Products Offered, Recent Developments, SWOT Analysis, MnM View Might Not Be Captured in Case of Unlisted Companies.
12 Appendix (Page No. - 138)
12.1 Industry Experts
12.2 Discussion Guide
12.3 Knowledge Store: Marketsandmarkets� Subscription Portal
12.4 Other Developments
12.4.1 Investments & Expansions, 2012�2017
12.4.2 Mergers & Aquisitions, 2012�2017
12.4.3 Agreements, Partnerships, and Joint Ventures, 2012�2017
12.5 Introducing RT: Real-Time Market Intelligence
12.6 Available Customizations
12.7 Related Reports
12.8 Author Details
List of Tables (96 Tables)
Table 1 USD Exchange Rates Considered for Study, 2014�2016
Table 2 Global Import and Export of Seed, 2014�2015 (USD Million)
Table 3 India: Seed Replacement Rate for Major Vegetables & Fruits
Table 4 Processed Seeds Market Size, By Crop Type, 2015�2022 (USD Billion)
Table 5 Processed Seeds Market Size, By Crop Type, 2015�2022 (KT)
Table 6 Processed Cereal & Grain Seeds Market Size, By Region, 2015�2022 (USD Billion)
Table 7 Processed Cereal & Grain Seeds Market Size, By Region, 2015�2022 (KT)
Table 8 Processed Cereal & Grain Seeds Market Size, By Crop, 2015�2022 (USD Billion)
Table 9 Processed Oilseeds & Pulses Market Size, By Region, 2015�2022 (USD Billion)
Table 10 Processed Oilseeds & Pulses Market Size, By Region, 2015�2022 (KT)
Table 11 Processed Oilseeds & Pulses Market Size, By Crop, 2015�2022 (USD Billion)
Table 12 Processed Fruit & Vegetable Seeds Market Size, By Region, 2015�2022 (USD Billion)
Table 13 Processed Fruit & Vegetable Seeds Market Size, By Region, 2015�2022 (KT)
Table 14 Processed Fruit & Vegetable Seeds Market Size, By Crop, 2015�2022 (USD Billion)
Table 15 Other Processed Seeds Market Size, By Region, 2015�2022 (USD Billion)
Table 16 Other Processed Seeds Market Size, By Region, 2015�2022 (KT)
Table 17 Processed Seeds Market Size, By Method, 2015�2022 (USD Million)
Table 18 Processed Seeds Market Size, By Method, 2015�2022 (KT)
Table 19 Mechanically Processed Seeds Market Size, By Region, 2015�2022 (USD Million)
Table 20 Mechanically Processed Seeds Market Size, By Region, 2015�2022 (KT)
Table 21 Biologically Processed Seeds Market Size, By Region, 2015�2022 (USD Million)
Table 22 Biologically Processed Seeds Market Size, By Region, 2015�2022 (KT)
Table 23 Chemically Processed Seeds Market Size, By Region, 2015�2022 (USD Million)
Table 24 Chemically Processed Seeds Market Size, By Region, 2015�2022 (KT)
Table 25 Seed Processing Equipment Market Size, By Type, 2015�2022 (USD Million)
Table 26 Seed Cleaners Market Size, By Region, 2015�2022 (USD Million)
Table 27 Seed Dryers Market Size, By Region, 2015�2022 (USD Million)
Table 28 Seed Coaters Market Size, By Region, 2015�2022 (USD Million)
Table 29 Seed Graders Market Size, By Region, 2015�2022 (USD Million)
Table 30 Seed Separators Market Size, By Region, 2015�2022 (USD Million)
Table 31 Seed Polishers Market Size, By Region, 2015�2022 (USD Million)
Table 32 Other Seed Processing Equipment Market Size, By Region, 2015�2022 (USD Million)
Table 33 Processed Seeds Market Size, By Region, 2015�2022 (USD Billion)
Table 34 Processed Seeds Market Size, By Region, 2015�2022 (KT)
Table 35 Seed Processing Equipment Market Size, By Region, 2015�2022 (USD Million)
Table 36 North America: Processed Seeds Market Size, By Country, 2015�2022 (USD Billion)
Table 37 North America: Seed Processing Equipment Market Size, By Country, 2015�2022 (USD Million)
Table 38 North America: Processed Seeds Market Size, By Crop Type, 2015�2022 (USD Billion)
Table 39 North America: Processed Seeds Market Size, By Crop Type, 2015�2022 (KT)
Table 40 North America: Processed Seeds Market Size, By Method, 2015�2022 (USD Billion)
Table 41 North America: Processed Seeds Market Size, By Method, 2015�2022 (KT)
Table 42 North America: Seed Processing Equipment Market Size, By Type, 2015�2022 (USD Million)
Table 43 US: Processed Seeds Market Size, By Crop Type, 2015�2022 (USD Million)
Table 44 Canada: Processed Market Size, By Crop Type, 2015�2022 (USD Billion)
Table 45 Mexico: Processed Market Size, By Crop Type, 2015�2022 (USD Million)
Table 46 Europe: Processed Seeds Market Size, By Country/Region, 2015�2022 (USD Billion)
Table 47 Europe: Seed Processing Equipment Market Size, By Country/Region, 2015�2022 (USD Billion)
Table 48 Europe: Processed Seeds Market Size, By Crop Type, 2015�2022 (USD Billion)
Table 49 Europe: Processed Seeds Market Size, By Crop Type, 2015�2022 (KT)
Table 50 Europe: Processed Seeds Market Size, By Method, 2015�2022 (USD Billion)
Table 51 Europe: Processed Seeds Market Size, By Method, 2015�2022 (KT)
Table 52 Europe: Seed Processing Equipment Market Size, By Type, 2015�2022 (USD Million)
Table 53 France: Processed Market Size, By Crop Type, 2015�2022 (USD Million)
Table 54 Germany: Processed Seeds Market Size, By Crop Type, 2015�2022 (USD Million)
Table 55 Italy: Processed Seeds Market Size, By Crop Type, 2015�2022 (USD Million)
Table 56 Spain: Seed Processing & Equipment Market Size, By Crop Type, 2015�2022 (USD Million)
Table 57 UK: Processed Seeds Market Size, By Crop Type, 2015�2022 (USD Million)
Table 58 Rest of Europe: Processed Seeds Market Size, By Crop Type, 2015�2022 (USD Million)
Table 59 Asia Pacific: Processed Seeds Market Size, By Country, 2015-2022 (USD Billion)
Table 60 Asia Pacific: Seed Processing Equipment Market Size, By Country, 2015-2022 (USD Million)
Table 61 Asia Pacific: Processed Seeds Market Size, By Crop Type, 2015-2022 (USD Billion)
Table 62 Asia Pacific: Processed Seeds Market Size, By Crop Type, 2015-2022 (KT)
Table 63 Asia Pacific: Processed Seeds Market Size, By Method, 2015-2022 (USD Billion)
Table 64 Asia Pacific: Processed Seeds Market Size, By Method, 2015-2022 (KT)
Table 65 Asia Pacific: Seed Processing Equipment Market Size, By Type, 2015-2022 (USD Million)
Table 66 China: Processed Seeds Market Size, By Crop Type, 2015�2022 (USD Million)
Table 67 India: Processed Seeds Market Size, By Crop Type, 2015�2022 (USD Million)
Table 68 Japan: Processed Seeds Market Size, By Crop Type, 2015�2022 (USD Million)
Table 69 Australia: Processed Seeds Market Size, By Crop Type, 2015�2022 (USD Million)
Table 70 Rest of Asia Pacific: Processed Seeds Market Size, By Crop Type, 2015�2022 (USD Million)
Table 71 South America: Processed Seeds Market Size, By Country, 2015-2022 (USD Billion)
Table 72 South America: Seed Processing Equipment Market Size, By Country, 2015-2022 (USD Million)
Table 73 South America: Processed Seeds Market Size, By Crop Type, 2015-2022 (USD Billion)
Table 74 South America: Processed Seeds Market Size, By Crop Type, 2015-2022 (KT)
Table 75 South America: Processed Seeds Market Size, By Method, 2015-2022 (USD Billion)
Table 76 South America: Processed Seeds Market Size, By Method, 2015-2022 (KT)
Table 77 South America: Seed Processing Equipment Market Size, By Type, 2015-2022 (USD Million)
Table 78 Brazil: Processed Seeds Market Size, By Crop Type, 2015�2022 (USD Million)
Table 79 Argentina: Processed Seeds Market Size, By Crop Type, 2015�2022 (USD Million)
Table 80 Rest of South America: Processed Seeds Market Size, By Crop Type, 2015�2022 (USD Million)
Table 81 RoW: Processed Seeds Market Size, By Region, 2015-2022 (USD Billion)
Table 82 RoW: Seed Processing Equipment Market Size, By Region, 2015-2022 (USD Million)
Table 83 RoW: Processed Seeds Market Size, By Crop Type, 2015-2022 (USD Billion)
Table 84 RoW: Processed Seeds Market Size, By Crop Type, 2015-2022 (KT)
Table 85 RoW: Processed Seeds Market Size, By Method, 2015-2022 (USD Billion)
Table 86 RoW: Processed Seeds Market Size, By Method, 2015-2022 (KT)
Table 87 RoW: Seed Processing Equipment Market Size, By Type, 2015-2022 (USD Million)
Table 88 Africa: Processed Seeds Market Size, By Crop Type, 2015�2022 (USD Million)
Table 89 Middle East: Processed Seeds Market Size, By Crop Type, 2015-2022 (USD Million)
Table 90 Top Five Companies in the Processed Seeds Market, 2016
Table 91 Top Five Companies in the Seed Processing Equipment Market, 2016
Table 92 Investments & Expansions, 2012�2017
Table 93 New Product Launches, 2012�2017
Table 94 Mergers & Acquisitions, 2012�2017
Table 95 Agreements, Partnerships & Joint Ventures, 2012�2017
Table 96 Divestments, 2012�2017
List of Figures (46 Figures)
Figure 1 Processed Seeds Market: Segmentation
Figure 2 Seed Processing Equipment Market: Segmentation
Figure 3 Seed Processing Market: Regional Segmentation
Figure 4 Seed Processing & Equipment Market: Research Design
Figure 5 Seed Processing Market Size Estimation Methodology: Bottom-Up Approach
Figure 6 Seed Processing Equipment Market Size Estimation Methodology: Bottom-Up Approach
Figure 7 Processed Seeds Market Size Estimation Methodology: Top-Down Approach
Figure 8 Seed Processing Equipment Market Size Estimation Methodology: Top-Down Approach
Figure 9 Data Triangulation Methodology
Figure 10 Processed Seeds Market Size, By Crop Type, 2017 vs 2022
Figure 11 Seed Processing Equipment Market Size, By Type, 2017 vs 2022
Figure 12 Processed Seeds Market Size, By Method, 2017 vs 2022
Figure 13 Processed Seeds Market Size, By Region, 2016
Figure 14 Seed Processing Equipment Market Size, By Region, 2016
Figure 15 Increasing Acceptance and Area Under GM Crop is Driving the Processed Seeds Market
Figure 16 Asia Pacific Segment is Estimated to Record the Largest Share Across All Regions
Figure 17 Cereals & Grains Segment is Estimated to Dominate in 2017
Figure 18 Mechanical Segment and the Us to Account for the Largest Share in North America in 2017
Figure 19 Mechanical Segment Estimated to Be the Largest Across All Regions in 2017
Figure 20 Asia Pacific Estimated to Lead in 2017
Figure 21 Global Population, 1966�2030 (Billion)
Figure 22 Decreasing Agricultural Land, 2004�2014 (% of Land Area)
Figure 23 Global Arable Land, 1995�2015 (Million Ha)
Figure 24 Decreasing Per Capita Arable Land, 1994�2014 (Ha/Person)
Figure 25 Seed Processing Market: Drivers, Restraints, Opportunities, and Challenges
Figure 26 Increasing Share of GM Seeds in the Seed Market
Figure 27 Increasing Area Under Cultivation of GM Crops, 1996�2016 (Million Hectares)
Figure 28 Seed Replacement Rates in India, 2006�2014
Figure 29 Seed Processing and Equipment Market: Value Chain Analysis
Figure 30 Seed Processing and Equipment Market: Supply Chain Analysis
Figure 31 Fruits & Vegetables Segment is Projected to Grow at the Highest CAGR During the Forecast Period
Figure 32 North America Dominated the Processed Cereal & Grain Seeds Market Throughout the Forecast Period
Figure 33 Biological Segment is Projected to Grow at the Highest CAGR During the Forecast Period
Figure 34 Coaters Segment is Expected to Grow at the Highest CAGR Throughout the Forecast Period
Figure 35 Asia Pacific Dominated Seed Cleaners Market Throughout the Forecast Period
Figure 36 Asia Pacific Dominated the Seed Processing Equipment Market Throughout the Forecast Period
Figure 37 Geographic Snapshot (2017�2022): China, India, and Spain Emerging as New Hotspots in the Processed Seeds Market, in Terms of Value
Figure 38 North America Seed Processing & Equipment Market: A Snapshot
Figure 39 Asia Pacific: Seed Processing & Equipment Market Snapshot
Figure 40 Key Developments By Leading Players in the Seed Processing and Equipment Market During 2012�2017
Figure 41 Bayer: Company Snapshot
Figure 42 The DOW Chemical Company: Company Snapshot
Figure 43 Monsanto: Company Snapshot
Figure 44 Syngenta: Company Snapshot
Figure 45 KWS Group: Company Snapshot
Figure 46 KWS Group: SWOT Analysis


Growth opportunities and latent adjacency in Process Equipment Market