Service Procurement Market by Solution (Contingent Workforce Management, Freelancer Management, Services Governance, MSA Management), Service, Deployment Type, Organization Size, Industry Vertical, and Region - Global Forecast to 2022


[121 Pages Report] The service procurement market was valued at USD 539.6 Million in 2016 and is projected to reach USD 1,011.6 Million by 2022. The global service procurement solutions market is expected to grow at a Compound Annual Growth Rate (CAGR) of 11.8% during the forecast period. The forecast period has been considered from 2017 to 2022, while 2016 is considered as the base year for estimating the market study.
Objectives of the Study:
The main objective of this report is to define, describe, and forecast the service procurement market on the basis of segments (component, deployment type, organization size, vertical, and region). The report provides detailed information regarding the major factors (drivers, restraints, opportunities, and industry-specific challenges) influencing the growth of the market. The report forecasts the market size with respect to 5 main geographic regions, namely, North America, Europe, Asia Pacific (APAC), Middle East and Africa (MEA), and Latin America. The report profiles key players and comprehensively analyzes their core competencies. This report also tracks and analyzes competitive developments, such as mergers and acquisitions, new product developments, and R&D activities in the global market.
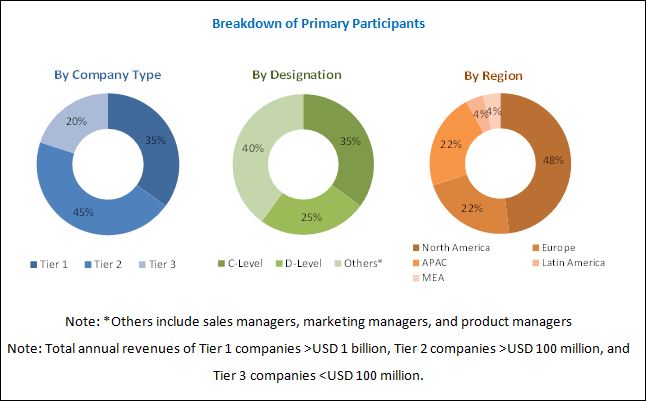
The research methodology used to estimate and forecast service procurement market begins with the collection and analysis of data on key vendor product offerings and business strategies from secondary sources, such as OneSource Business Browser, D&B Hoovers, 10K Wizard, Bloomberg, Thomson StreetEvents, Factiva, IT service providers, technology providers, press releases and investor presentations of companies, white papers, technology journals, certified publications, articles from recognized authors, directories, and databases. The vendor offerings have also been taken into consideration to determine the market segmentation. The bottom-up procedure was employed to arrive at the total market size of the market from the revenue of the key market software tool providers and service providers. After arriving at the overall market size, the total market was split into several segments and subsegments, which were then verified through primary research by conducting extensive interviews with key people, such as Chief Executive Officers (CEOs), Vice Presidents (VPs), directors, and executives.
To know about the assumptions considered for the study, download the pdf brochure
Industry Ecosystem
The service procurement ecosystem comprises vendors, such as SAP Fieldglass (US), Beeline (US), DCR Workforce (US), PRO Unlimited (US), PeopleFluent (US), Provade (US), PIXID (France), Upwork (US), Field Nation (US), WorkMarket (US), Superior Group (US), Enlighta (US), and TargetRecruit (US).
Key Target Audience
- Services procurement solutions providers
- Workforce management providers
- Freelancer service providers
- Human resources providers
- Analytics vendors
- Project accounting solution providers
- Supplier Relationship Management providers
- Supplier Contract Management providers
- Value-added resellers
Get online access to the report on the World's First Market Intelligence Cloud
Request Sample Scope of the Report

|
Report Metric |
Details |
|
Market size available for years |
2017�2022 |
|
Base year considered |
2016 |
|
Forecast period |
2017�2022 |
|
Forecast unit |
Value (USD Million) |
|
Segments covered |
Solution, Service, Deployment Type, Organization Size, Industry Vertical, and Region |
|
Geographies covered |
North America, Europe, Asia Pacific (APAC), Latin America, and Middle East and Africa (MEA) |
|
Companies covered |
SAP Fieldglass (US), Beeline (US), DCR Workforce (US), PRO Unlimited (US), PeopleFluent (US), Provade (US), PIXID (France), Upwork (US), Field Nation (US), WorkMarket (US), Superior Group (US), Enlighta (US), and TargetRecruit (US) |
The research report categorizes the service procurement market to forecast the revenues and analyze the trends in each of the following submarkets:
By Component
- Solutions
- Contingent Workforce Management
- Freelancer Management
- Statement of Work Procurement
- Services Governance and MSA Management
- Analytics and Reporting
- Resource Sourcing and Tracking
- Services
- Deployment and Integration
- Support and Maintenance
- Consulting
By Deployment Type
- On-premises
- Cloud
By Organization Size
- Small and Medium-sized Enterprises (SMEs)
- Large enterprises
By Industry Vertical
- Banking, Financial Services, and Insurance
- Telecom and IT
- Manufacturing
- Retail and Consumer goods
- Government
- Healthcare and Life Sciences
- Transportation and Logistics
- Energy and Utilities
- Others (Education and Media & Entertainment)
By Region
- North America
- Europe
- MEA
- APAC
- Latin America
Available Customizations
With the given market data, MarketsandMarkets offers customizations as per the company�s specific needs. The following customization options are available for the report:
Product Analysis
- Product matrix that gives a detailed comparison of the product portfolio of each company
Geographic Analysis
- Further breakdown of the North American Service procurement market into countries
- Further breakdown of the European market into countries
- Further breakdown of the APAC market into countries
- Further breakdown of the MEA market into countries
- Further breakdown of the Latin American market into countries
Company Information
- Detailed analysis and profiling of additional market players
The service procurement market is expected to grow from USD 579.5 Million in 2017 to USD 1,011.6 Million by 2022, at a Compound Annual Growth Rate (CAGR) of 11.8% during the forecast period. Several factors such as the increasing number of freelancers in the job market, growing impetus on workforce analytics, and effective management of spending on contractual workers, are driving the growth of the market. Moreover, an increasing adoption rate of services procurement solutions by several industry verticals, such as telecom, manufacturing, BFSI, and information technology, is expected to boost the market growth.
Services procurement solutions facilitate organizations to hire human resources and automate various service governance activities in managing the life cycle of external workforce. The solutions help organizations better manage spend and gain control of its operations. The trend of services procurement from Managed Service Providers (MSP) is growing among most of the industry verticals, and the usage of mobile devices and cloud deployment is transforming the service procurement market.
Services procurement solutions help organizations make decisions using a comprehensive analysis and reporting of information generated throughout the life cycle of the external workforce. The growing requirement for automation, need for data-driven businesses, and the increasing use of social media and smartphones for enhanced collaboration and spend management are expected to drive the demand for services procurement solutions.
The evolution of services procurement technologies has transformed various MSP and vendor management for organizations that depend on considerable external workforce for carrying out various projects. The automation of various processes, such as timesheet approval and generation of statement of work procurement. The services procurement solutions help organizations to control and reduce expenditure by helping them increase the employee visibility and MSP management.
The service procurement market is expected to gain more traction, due to more opportunities, with the advancement of mobile devices and workforce analytics. Organizations are offering services procurement solutions empowered with mobile applications to approve timesheets for managers and govern resources to gain control over the spend. Organizations across the world are expected to adopt these solutions to hire contractors, consultants, and other external workforce.
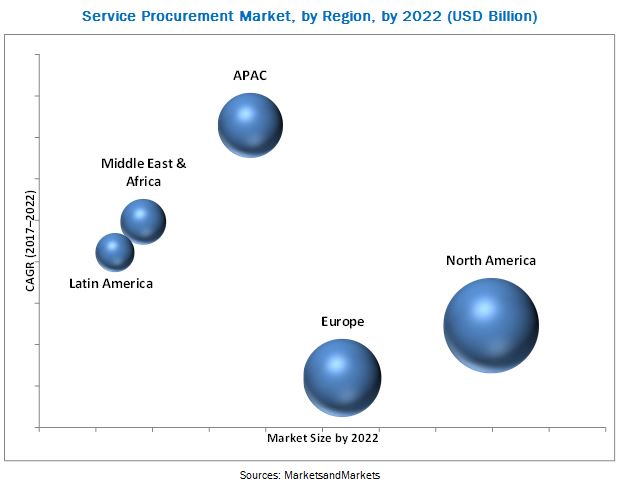
North America is expected to be the largest revenue generating region for vendors of services procurement solutions over the next 5 years, followed by Europe. This is mainly due to the presence of developed economies, such as Canada and the US, and the focus on innovations obtained from R&D and technologies. Asia Pacific (APAC) is expected to be the fastest-growing region in the service procurement market. The market�s growth in the emerging economics of APAC and the Middle East and Africa (MEA) is expected to be high due to the rapid adoption of emerging trends, such as mobility and the cloud. The MEA and Latin American regions are gradually adopting the services procurement solutions, which empowers organization in these regions to manage the external workforce efficiently while leveraging the benefits of the cost-effective solutions.
Major global vendors of services procurement solutions are SAP Fieldglass (US), Beeline (US), DCR Workforce (US), PRO Unlimited (US), PeopleFluent (US), Provade (US), PIXID (France), Upwork (US), Field Nation (US), WorkMarket (US), Superior Group (US), Enlighta (US), and TargetRecruit (US). These vendors have adopted various organic and inorganic growth strategies, such as new product launches, partnerships and collaborations, and mergers and acquisitions, to enhance their position in the service procurement market.
To speak to our analyst for a discussion on the above findings, click Speak to Analyst
Table of Contents
1 Introduction (Page No. - 13)
1.1 Objectives of the Study
1.2 Market Definition
1.3 Market Scope
1.4 Years Considered for the Study
1.5 Stakeholders
2 Research Methodology (Page No. - 16)
2.1 Research Data
2.1.1 Secondary Data
2.1.2 Primary Data
2.1.2.1 Breakdown of Primaries
2.1.2.2 Key Industry Insights
2.2 Market Size Estimation
2.3 Research Assumptions
2.4 Limitations
3 Executive Summary (Page No. - 22)
4 Premium Insights (Page No. - 25)
4.1 Attractive Market Opportunities in the Service Procurement Market
4.2 Market By Component
4.3 Market By Deployment Type
4.4 Market By Organization Size
4.5 Market By Industry Vertical and Region
5 Market Overview (Page No. - 28)
5.1 Introduction
5.2 Market Dynamics
5.2.1 Drivers
5.2.1.1 Effective Management of Spending on Contractual Workers
5.2.1.2 Increase in the Number of Freelancers in the Market
5.2.1.3 Growing Focus on Workforce Analytics
5.2.2 Restraints
5.2.2.1 Temporary Workers� Access to Corporate Facilities and Systems
5.2.2.2 Lack of Online Order Management
5.2.3 Opportunities
5.2.3.1 Increasing Number of Temporary Workers in the Services Sector
5.2.3.2 Increase in Solution Adoption Among Service Providers
5.2.4 Challenges
5.2.4.1 Selection Process of Services is Complex
5.2.4.2 Different Pricing Models
5.3 Services Procurement Solutions: Use Cases
5.3.1 Use Case #1
5.3.2 Use Case #2
5.3.3 Use Case #3
6 Service Procurement Market, By Component (Page No. - 32)
6.1 Introduction
6.2 Solutions
6.2.1 Contingent Workforce Management
6.2.2 Freelancer Management
6.2.3 Statement of Work Procurement
6.2.4 Services Governance and Master Service Agreement Management
6.2.5 Analytics and Reporting
6.2.6 Resource Sourcing and Tracking
6.3 Services
6.3.1 Deployment and Integration
6.3.2 Support and Maintenance
6.3.3 Consulting
7 Service Procurement Market, By Deployment Type (Page No. - 42)
7.1 Introduction
7.2 On-Premises
7.3 Cloud
8 Market By Organization Size (Page No. - 46)
8.1 Introduction
8.2 Large Enterprises
8.3 Small and Medium-Sized Enterprises
9 Service Procurement Market, By Industry Vertical (Page No. - 50)
9.1 Introduction
9.2 Banking, Financial Services, and Insurance
9.3 Telecom and IT
9.4 Manufacturing
9.5 Retail and Consumer Goods
9.6 Government
9.7 Healthcare and Life Sciences
9.8 Transportation and Logistics
9.9 Energy and Utilities
9.10 Others
10 Service Procurement Market, By Region (Page No. - 61)
10.1 Introduction
10.2 North America
10.3 Europe
10.4 Asia Pacific
10.5 Middle East and Africa
10.6 Latin America
11 Competitive Landscape (Page No. - 79)
11.1 Overview
11.2 Market Ranking
11.3 Competitive Scenario
11.3.1 New Product Launches
11.3.2 Business Expansions
11.3.3 Acquisitions
11.3.4 Partnerships
12 Company Profiles (Page No. - 84)
12.1 SAP Fieldglass
(Business Overview, Products Offered, Recent Developments, SWOT Analysis, and MnM View)
12.2 Beeline
12.3 DCR Workforce
12.4 PRO Unlimited
12.5 Peoplefluent
12.6 Provade
12.7 Upwork
12.8 Field Nation
12.9 Workmarket
12.10 Superior Group
12.11 Enlighta
12.12 Pixid
*Details on Business Overview, Products Offered, Recent Developments, SWOT Analysis, and MnM View Might Not Be Captured in Case of Unlisted Companies.
12.13 Key Innovators
12.13.1 Targetrecruit
13 Appendix (Page No. - 112)
13.1 Key Industry Insights
13.2 Discussion Guide
13.3 Knowledge Store: Marketsandmarkets� Subscription Portal
13.4 Introducing RT: Real-Time Market Intelligence
13.5 Available Customizations
13.6 Related Reports
13.7 Author Details
List of Tables (64 Tables)
Table 1 Service Procurement Market Size, By Component, 2015�2022 (USD Million)
Table 2 Solutions: Market Size, 2015�2022 (USD Million)
Table 3 Contingent Workforce Management Market Size, By Region, 2015�2022 (USD Million)
Table 4 Freelancer Management Market Size, By Region, 2015�2022 (USD Million)
Table 5 Statement of Work Procurement Market Size, By Region, 2015�2022 (USD Million)
Table 6 Services Governance and Master Service Agreement Management Market Size, By Region, 2015�2022 (USD Million)
Table 7 Analytics and Reporting Market Size, By Region, 2015�2022 (USD Million)
Table 8 Resource Sourcing and Tracking Market Size, By Region, 2015�2022 (USD Million)
Table 9 Services: Market Size, 2015�2022 (USD Million)
Table 10 Deployment and Integration Market Size, By Region, 2015�2022 (USD Million)
Table 11 Support and Maintenance Market Size, By Region, 2015�2022 (USD Million)
Table 12 Consulting Market Size, By Region, 2015�2022 (USD Million)
Table 13 Service Procurement Market Size, By Deployment Type, 2015�2022 (USD Million)
Table 14 On-Premises: Market Size, By Region, 2015�2022 (USD Million)
Table 15 Cloud: Market Size, By Region, 2015�2022 (USD Million)
Table 16 Market Size, By Organization Size, 2015�2022 (USD Million)
Table 17 Large Enterprises: Market Size, By Region, 2015�2022 (USD Million)
Table 18 Small and Medium-Sized Enterprises: Market Size, By Region, 2015�2022 (USD Million)
Table 19 Service Procurement Market Size, By Industry Vertical, 2015�2022 (USD Million)
Table 20 Banking, Financial Services, and Insurance: Market Size, By Region, 2015�2022 (USD Million)
Table 21 Telecom and IT: Market Size, By Region, 2015�2022 (USD Million)
Table 22 Manufacturing: Market Size, By Region, 2015�2022 (USD Million)
Table 23 Retail and Consumer Goods: Market Size, By Region, 2015�2022 (USD Million)
Table 24 Government: Market Size, By Region, 2015�2022 (USD Million)
Table 25 Healthcare and Life Sciences: Market Size, By Region, 2015�2022 (USD Million)
Table 26 Transportation and Logistics: Market Size, By Region, 2015�2022 (USD Million)
Table 27 Energy and Utilities: Market Size, By Region, 2015�2022 (USD Million)
Table 28 Others: Market Size, By Region, 2015�2022 (USD Million)
Table 29 Service Procurement Market Size, By Region, 2015�2022 (USD Million)
Table 30 North America: Market Size, By Component, 2015�2022 (USD Million)
Table 31 North America: Market Size, By Solution, 2015�2022 (USD Million)
Table 32 North America: Market Size, By Service, 2015�2022 (USD Million)
Table 33 North America: Market Size, By Deployment Type, 2015�2022 (USD Million)
Table 34 North America: Market Size, By Organization Size, 2015�2022 (USD Million)
Table 35 North America: Market Size, By Industry Vertical, 2015�2022 (USD Million)
Table 36 Europe: Market Size, By Component, 2015�2022 (USD Million)
Table 37 Europe: Market Size, By Solution, 2015�2022 (USD Million)
Table 38 Europe: Market Size, By Service, 2015�2022 (USD Million)
Table 39 Europe: Market Size, By Deployment Type, 2015�2022 (USD Million)
Table 40 Europe: Market Size, By Organization Size, 2015�2022 (USD Million)
Table 41 Europe: Market Size, By Industry Vertical, 2015�2022 (USD Million)
Table 42 Asia Pacific: Service Procurement Market Size, By Component, 2015�2022 (USD Million)
Table 43 Asia Pacific: Market Size, By Solution, 2015�2022 (USD Million)
Table 44 Asia Pacific: Market Size, By Service, 2015�2022 (USD Million)
Table 45 Asia Pacific: Market Size, By Deployment Type, 2015�2022 (USD Million)
Table 46 Asia Pacific: Market Size, By Organization Size, 2015�2022 (USD Million)
Table 47 Asia Pacific: Market Size, By Industry Vertical, 2015�2022 (USD Million)
Table 48 Middle East and Africa: Market Size, By Component, 2015�2022 (USD Million)
Table 49 Middle East and Africa: Market Size, By Solution, 2015�2022 (USD Million)
Table 50 Middle East and Africa: Market Size, By Service, 2015�2022 (USD Million)
Table 51 Middle East and Africa: Market Size, By Deployment Type, 2015�2022 (USD Million)
Table 52 Middle East and Africa: Market Size, By Organization Size, 2015�2022 (USD Million)
Table 53 Middle East and Africa: Market Size, By Industry Vertical, 2015�2022 (USD Million)
Table 54 Latin America: Service Procurement Market Size, By Component, 2015�2022 (USD Million)
Table 55 Latin America: Market Size, By Solution, 2015�2022 (USD Million)
Table 56 Latin America: Market Size, By Service, 2015�2022 (USD Million)
Table 57 Latin America: Market Size, By Deployment Type, 2015�2022 (USD Million)
Table 58 Latin America: Market Size, By Organization Size, 2015�2022 (USD Million)
Table 59 Latin America: Market Size, By Industry Vertical, 2015�2022 (USD Million)
Table 60 Market Ranking for the Service Procurement Market, 2017
Table 61 New Product Launches/Enhancements, 2016�2017
Table 62 Business Expansions, 2016�2017
Table 63 Acquisitions, 2013�2017
Table 64 Partnerships, 2016�2017
List of Figures (32 Figures)
Figure 1 Service Procurement Market Segmentation
Figure 2 Service Procurement Market: Research Design
Figure 3 Data Triangulation
Figure 4 Market Size Estimation Methodology: Top-Down Approach
Figure 5 Market Size Estimation Methodology: Bottom-Up Approach
Figure 6 Market: Assumptions
Figure 7 Market, By Top Segmentations, 2017
Figure 8 Market, By Service, 2017
Figure 9 Market, By Industry Vertical (2017 vs 2022)
Figure 10 Market, By Region
Figure 11 Increased Spending on Temporary Workforce is Expected to Drive the Growth of the Service Procurement Market
Figure 12 Services Segment is Expected to Grow at A Higher CAGR During the Forecast Period
Figure 13 Cloud Deployment Type is Expected to Grow at A Higher CAGR During the Forecast Period
Figure 14 Small and Medium-Sized Enterprises Segment is Expected to Grow at A Higher CAGR During the Forecast Period
Figure 15 Banking, Financial Services, and Insurance Industry Vertical, and North America are Estimated to Dominate the Market in 2017
Figure 16 Service Procurement Market: Drivers, Restraints, Opportunities, and Challenges
Figure 17 Services Segment is Expected to Grow at A Higher CAGR During the Forecast Period
Figure 18 Freelancer Management Segment is Expected to Grow at the Highest CAGR During the Forecast Period
Figure 19 Consulting Segment is Expected to Have the Highest CAGR During the Forecast Period
Figure 20 Cloud Deployment Type is Expected to Grow at A Higher CAGR During the Forecast Period
Figure 21 Small and Medium-Sized Enterprises Segment is Expected to Grow at A Higher CAGR During the Forecast Period
Figure 22 Telecom and IT Industry Vertical is Expected to Grow at the Highest CAGR During the Forecast Period
Figure 23 North America is Expected to Have the Largest Market Size During the Forecast Period
Figure 24 North America Snapshot: Market
Figure 25 Asia Pacific Snapshot: Service Procurement Market
Figure 26 Key Developments By Leading Players in the Market, 2014�2017
Figure 27 Market Evaluation Framework
Figure 28 SAP Fieldglass: SWOT Analysis
Figure 29 Beeline: SWOT Analysis
Figure 30 DCR Workforce: SWOT Analysis
Figure 31 PRO Unlimited: SWOT Analysis
Figure 32 Peoplefluent: SWOT Analysis


Growth opportunities and latent adjacency in Service Procurement Market