Silica Analyzer Market by Type (Equipment and Consumables), Industry (Power Generation (Utility, Captive/IPP), Semiconductor), and Region (North America, Europe, Asia Pacific, and Rest of the World) - Global Forecast to 2023


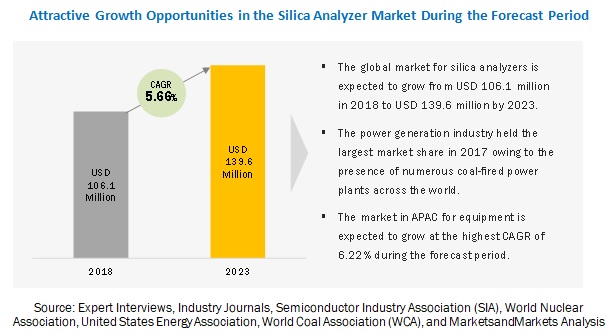
Silica analyzer market size are used to monitor the silica concentration of the water by utilizing the colorimetric analysis principle. The main application of the silica analyzer is in power generation and semiconductor industries. The significance of accurate silica measurement in water chemistry analysis is one of the key factors driving the market growth. The market was valued at USD 100.3 million in 2017 and is expected to reach USD 139.6 million by 2023, at a CAGR of 5.66% during the forecast period. The base year considered for the study is 2017, and the forecast period is between 2018 and 2023.
Utility grade power plants to witness highest CAGR in silica analyzer market for equipment during the forecast period
The power generation plants are of 2 types: utility grade power plants and captive/independent power plants. Utility grade power plants are engaged in electricity generation and distribution of this electricity to residential, commercial, and industrial users. The power generated by captive power plants or independent power producers is used for industrial plants such as oil refineries, sugar factories, or pharmaceutical companies and is limited and lesser compared to utility grade power plants. In every utility grade power plant, at least 3 to 4 silica analyzers are installed, whereas, captive or independent power plants can manage to generate power with the help of single silica analyzer. Hence, utility grade power plants provide attractive opportunities in the silica analyzer market.
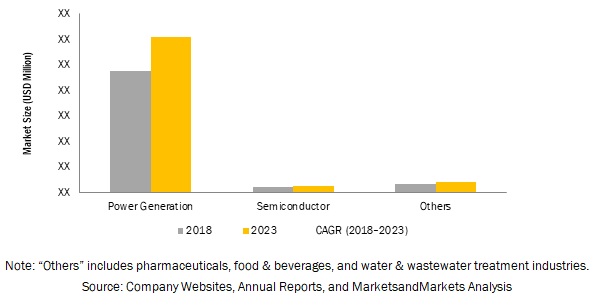
Power generation industry to command global silica analyzer market during the forecast period
Silica analyzers are used to monitor the silica content in the water used in power generation plants for several applications such as steam generation and condensate polishing, which helps in avoiding silica scaling on turbines. The power generation industry is one of the most important and major users of multi-stream silica analyzers. The semiconductor industry uses silica analyzers for ultra-pure water applications, but mostly single-stream silica analyzers, which are cheaper than multi-stream silica analyzers, are preferred in this industry.
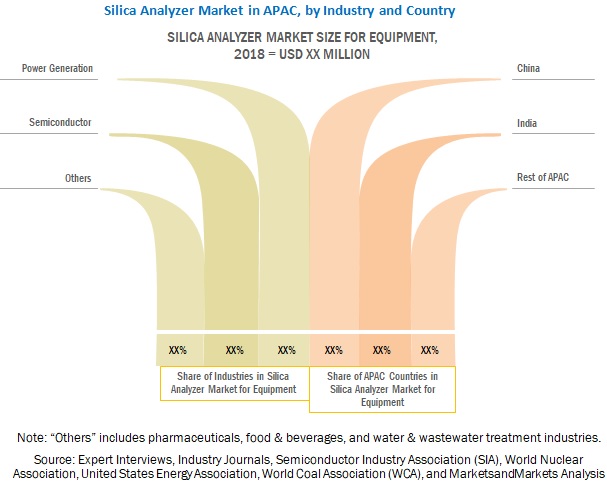
Silica analyzer market in APAC expect to grow at highest CAGR during the forecast period
APAC is expected to continue to hold the largest share of the silica analyzer market owing to the presence of a large number of coal-fired power plants in APAC countries such as China and India. The silica analyzer market in APAC is also driven by the growing demand for electricity and increasing number of coal-fired power plants. Although other regions are focusing on harnessing renewable sources of energy such as solar cells, windmills, and hydroelectric power, the APAC region, especially Asian countries such as China and India, heavily rely on coal-fired power plants to generate electricity. China, being the largest consumer of coal, is relying highly on coal-fired power generation. India is also focusing on increasing the efficiency of coal-fired power plants up to 60% by 2019. In Asia, there are huge coal reserves, and the electricity generated by coal is cheaper than the electricity generated by oil-fired or gas-fired power plants.
North America is another important market for silica analyzers, with 381 coal-fired power plants; the US alone has 60 nuclear plants involved in power generation. In 2017, coal was the second-largest source used to generate around 30% of energy according to the US Energy Information Administration.
POWER GENERATION INDUSTRY TO COMMAND GLOBAL SILICA ANALYZER MARKET DURING THE FORECAST PERIOD
Market Dynamics
Driver: Significance of accurate silica measurement in steam/water cycle for optimizing power plant efficiency
Silica is made up of most abundant elements, namely, silicon and oxygen. Silica analyzers are used to measure the concentration level of silica in water samples across different industries, such as power generation and semiconductor, among many others. Silica concentration is very important for the steam generation and cooling water systems installed in aforementioned industries. Among many potential impurities in the steam cycle, silica plays a vital role because the solubility of silica in steam directly depends on the density and temperature of the steam. With the increasing temperature and density, the solubility of silica also increases and a deposit of 0.5 mm can diminish thermal transfer by about 28%. In a typical water/steam cycle, silica can be measured in the saturated steam, main steam, or reheat steam. Higher concentrations of silica lead to the deposition of a layer on turbine surfaces. Any minor deviation of silica concentration on a power plant can have serious and expensive consequences in relation to performance, reliability, efficiency, and safety; hence, it is very much necessary to monitor this parameter closely.
Restraint: Requirement for regular maintenance and replacement of parts or consumables
A silica analyzer consists of various consumables. These consumables include tubing harness, tubing lubricant, sample bottles, sample outlets, drain, sample chambers, etc. These consumables must be maintained regularly or replaced when required to keep silica analyzers working accurately. Sample bottles containing reagents, such as molybdate 3 and citric acid/surfactant, need to be regularly filled to maintain continuous working of silica analyzers. Also, sample bottles must be frequently cleaned. The tubing kit or the connecting tubes used in silica analyzers also required to be cleaned routinely for the accurate analysis of the sample. In case any physical damages to these consumables, replacement is the only option. Thus, the regular maintenance or replacement of parts or consumables can be a restraint for the silica analyzer market growth as it increases the total cost of ownership.
Opportunity: Huge demand from APAC for silica analyzers owing to rising need for energy
APAC holds more than half of the world�s population. The growing disposable income has led to the increasing energy consumption per capita as people have access to various digital devices and consumer appliances. Further, to support the growing demand for these electrical and electronic appliances, energy demand from the industrial sector has also grown significantly. The abundant availability and huge reserves of coal have made thermal power as the most reliable and cheap source of generating electricity to fulfill the energy requirement from the said region. Additionally, APAC (especially China and India) has also witnessed huge capacity augmentation in the renewable energy sector, but thermal power still dominates the energy mix.
Challenge: Emphasis on renewable energy sources and curb on greenhouse emissions from power plants
Use of boilers in coal-fired power plants causes the turbine rotors to turn for the generation of electricity. Water is taken from the feeder to the boiler system. Water is then heated using coal to generate steam, which, in turn, turns the turbine. Coal-fired power plants emit greenhouse gases. Harmful substances such as mercury, sulfur dioxide, carbon monoxide, selenium, and arsenic are also emitted from these thermal power plants. Also, the efficiency of coal-fired power plants is about 33%, and it is the cheap source of generating power. Moreover, the coal is available in abundance, especially with huge proved reserves in the US and APAC.
The efficiency of coal-fired power plants has increased and greenhouse emissions have also been reduced by deploying high-efficiency, low-emission technologies within the coal-fired power plants. Supercritical and ultra-supercritical technologies, Integrated Gasification Combined Cycle (IGCC), and Fluidized Bed Combustion (FBC) are some of them. However, governments across the world are taking the initiative to reduce the pollution, take measures to deal with climate changes, and shut down coal-fired power plants. Canada, under the Paris Climate Accord, will close all of its coal-fired power plants by 2030. France produces around 1% of its energy from coal-fired power plants and is expected to shut down all of its thermal plants by 2023. Although the use of advanced technologies for coal-fired power plants and use of gas as a fuel instead of coal have reduced pollution and emission of harmful elements and increased the efficiency of power plants. Hence, coal-fired power plants have a huge installed base for silica analyzers, but the shutdown of these plants creates challenges for the players in the silica analyzer market, especially in Europe. However, this challenge can be overcome by the deployment of advanced high-efficiency low-emission technologies in coal-fired power plants and by using natural gas as a fuel.
Get online access to the report on the World's First Market Intelligence Cloud
- Easy to Download Historical Data & Forecast Numbers
- Company Analysis Dashboard for high growth potential opportunities
- Research Analyst Access for customization & queries
- Competitor Analysis with Interactive dashboard
- Latest News, Updates & Trend analysis
Request Sample Scope of the Report
Get online access to the report on the World's First Market Intelligence Cloud
- Easy to Download Historical Data & Forecast Numbers
- Company Analysis Dashboard for high growth potential opportunities
- Research Analyst Access for customization & queries
- Competitor Analysis with Interactive dashboard
- Latest News, Updates & Trend analysis

|
Report Metric |
Details |
|
Market size available for years |
2015�2023 |
|
Base year considered |
207 |
|
Forecast period |
2018�2023 |
|
Forecast units |
thousand (USD) and million (USD) |
|
Segments covered |
Industry, Type, and Region |
|
Geographies covered |
North America, Europe, APAC, RoW (South America, Middle East, and Africa) |
|
Companies covered |
Hach (US), ABB (Switzerland), Thermo Fisher Scientific (US), Mettler Toledo (Switzerland), HORIBA (Japan), NIKKISO (Japan), Swan Analytical Instruments (Switzerland), SPX Flow (US), DKK TOA (Japan), Waltron Group (US), Dr.Thiedig (Germany), Electro-Chemical Devices (US), Shanghai Boqu Instrument (China), KNTEC (South Korea), HKY Technology (China), and Omicron Sensing (US). |
This research report categorizes the market on the basis of type, industry, and geography.
Silica Analyzer Market, by Type:
- Equipment
- Consumables
Silica Analyzer Market, by Industry:
- Power Generation
- Semiconductor
- Others (Pharmaceuticals, Food & Beverages, and Water & Wastewater Treatment)
Silica Analyzer Market, by Region:
- North America
- Europe
- Asia Pacific (APAC)
- Rest of the World (RoW)
Key Market Players
Hach (US), ABB (Switzerland), Thermo Fisher Scientific (US), Mettler Toledo (Switzerland), HORIBA (Japan), NIKKISO (Japan), Swan Analytical Instruments (Switzerland), SPX Flow (US), DKK TOA (Japan), Waltron Group (US), Dr.Thiedig (Germany), Electro-Chemical Devices (US), Shanghai Boqu Instrument (China), KNTEC (South Korea), HKY Technology (China), and Omicron Sensing (US).
Hach is a well-known brand offering water chemistry and analysis solutions across several industrial and municipal facilities. It established its leadership position in water analyzers owing to its best-in-class and innovative products. For instance, the company�s silica analyzer is a pump-free solution that offers seamless operation as it does not require frequent maintenance. Hach has not only strengthened its installation base but also broadened its portfolio of silica analyzers with the acquisition of POLYMATRON. Furthermore, Hach recently acquired AppliTek in October 2017, which has further enhanced its product portfolio of online silica analyzers and has expanded its geographic presence.
Recent Developments
- In August 2016, Swan launched AMI Silitrace Ultra, an online silica analyzer that has a measuring range of 0.005 ppb to 25 ppb. It continuously monitors silica levels in ultra-pure water.
- In January 2016, Hach expanded its capabilities by building a new research and development center in its Loveland, Colorado (US)-based campus. This investment aimed at ensuring the development of advanced and innovative products to maintain its commitment to customers.
Key Questions Answered
- Where will all these developments take the industry in the long term?
- What are the upcoming trends for the Silica Analyzer Market?
- Which segment provides the most opportunity for growth?
- Who are the leading vendors operating in this market?
- What are the opportunities for new market entrants?
To speak to our analyst for a discussion on the above findings, click Speak to Analyst
Table of Contents
1 Introduction (Page No. - 11)
1.1 Objectives of Study
1.2 Definition
1.3 Scope of Study
1.3.1 Markets Covered
1.3.2 Geographic Scope
1.3.3 Years Considered for Study
1.4 Currency
1.5 Stakeholders
2 Research Methodology (Page No. - 14)
2.1 Research Data
2.1.1 Secondary Data
2.1.1.1 Secondary Sources
2.1.2 Primary Data
2.1.2.1 Primary Interviews With Experts
2.1.2.2 Breakdown of Primaries
2.1.2.3 Primary Sources
2.1.3 Secondary and Primary Research
2.2 Market Size Estimation
2.2.1 Bottom-Up Approach
2.2.1.1 Approach for Capturing the Market Size By Bottom-Up Analysis (Demand Side)
2.2.2 Top-Down Approach
2.2.2.1 Approach for Capturing the Market Size By Top-Down Analysis (Supply Side)
2.3 Market Breakdown & Data Triangulation
2.4 Research Assumptions
3 Executive Summary (Page No. - 23)
4 Premium Insights (Page No. - 28)
4.1 Silica Analyzer Market Opportunities (2018�2023)
4.2 Market in North America for Equipment, By Industry (2018�2023)
4.3 Market, By Type
4.4 Market in APAC, By Industry and Country
4.5 Market for Equipment, By Region
5 Market Overview (Page No. - 31)
5.1 Introduction
5.1.1 Drivers
5.1.1.1 Significance of Accurate Silica Measurement in Steam/Water Cycle for Optimizing Power Plant Efficiency
5.1.2 Restraints
5.1.2.1 Requirement for Regular Maintenance and Replacement of Parts Or Consumables
5.1.3 Opportunities
5.1.3.1 Huge Demand From APAC for Silica Analyzers Owing to Rising Need for Energy
5.1.4 Challenges
5.1.4.1 Emphasis on Renewable Energy Sources and Curb on Greenhouse Emissions From Power Plants
6 Silica Analyzer Market, By Type (Page No. - 36)
6.1 Introduction
6.2 Equipment
6.3 Consumables
7 Silica Analyzer Market, By Industry (Page No. - 39)
7.1 Introduction
7.2 Power Generation Industry
7.2.1 Utility Grade Power Generation
7.2.2 Captive/Independent Power Producers
7.3 Semiconductor Industry
7.4 Others
8 Geographic Analysis (Page No. - 48)
8.1 Introduction
8.2 North America
8.2.1 Us
8.2.2 Rest of North America
8.3 Europe
8.3.1 Germany
8.3.2 Russia
8.3.3 Rest of Europe
8.4 APAC
8.4.1 China
8.4.2 India
8.4.3 Rest of Asia Pacific
8.5 Rest of the World
8.5.1 Middle East & Africa
8.5.2 South America
9 Competitive Landscape (Page No. - 61)
9.1 Overview
9.2 Ranking Analysis of Market Players
9.3 Competitive Benchmarking and Landscape
9.3.1 Product Launches
9.3.2 Expansions
9.3.3 Acquisitions
10 Company Profile (Page No. - 64)
(Overview, Products Offered, Recent Developments, SWOT Analysis, and MnM View)*
10.1 Key Players
10.1.1 Hach
10.1.2 Thermo Fisher Scientific
10.1.3 ABB
10.1.4 Mettler Toledo
10.1.5 Horiba
10.1.6 Nikkiso
10.1.7 Swan Analytische Instrumente
10.1.8 SPX Flow
10.1.9 DKK Toa
10.1.10 Waltron Group
10.1.11 Endress+Hauser
10.2 Other Key Players
10.2.1 Dr.Thiedig
10.2.2 Electro-Chemical Devices (ECD)
10.2.3 Shanghai Boqu Instrument
10.2.4 Kntec
10.2.5 Omicron Sensing
10.2.6 HKY Technology
*Details on Overview, Products Offered, Recent Developments, SWOT Analysis, and MnM View Might Not Be Captured in Case of Unlisted Companies.
11 Appendix (Page No. - 84)
11.1 Insights of Industry Experts
11.2 Discussion Guide
11.3 Knowledge Store: Marketsandmarkets� Subscription Portal
11.4 Introducing RT: Real-Time Market Intelligence
11.5 Available Customizations
11.6 Related Reports
11.7 Author Details
List of Tables (35 Tables)
Table 1 Assumptions of Research Study
Table 2 Silica Analyzer Market in Terms of Value and Volume, 2015�2023
Table 3 Market, By Type, 2015�2023 (USD Million)
Table 4 Market for Equipment, By Industry, 2015�2023 (USD Million)
Table 5 Market for Equipment in Power Generation Industry, By Region, 2015�2023 (USD Million)
Table 6 Market for Equipment in Power Generation, By Plant Type, 2015�2023 (USD Million)
Table 7 Market for Equipment in Utility Grade Power Plants, By Region, 2015�2023 (USD Million)
Table 8 Market for Equipment in Captive/Independent Power Plants, By Region, 2015�2023 (USD Million)
Table 9 Market in North America for Equipment in Power Generation Industry, By Country, 2015�2023 (USD Million)
Table 10 Market in North America for Equipment in Power Generation Industry, By Plant Type, 2015�2023 (USD Million)
Table 11 Market in APAC for Equipment in Power Generation Industry, By Plant Type, 2015�2023 (USD Million)
Table 12 Market in Europe for Equipment in Power Generation Industry, By Plant Type, 2015�2023 (USD Million)
Table 13 Market in RoW for Equipment in Power Generation Industry, By Plant Type, 2015�2023 (USD Million)
Table 14 Market for Equipment in Semiconductor Industry, By Region, 2015�2023 (USD Million)
Table 15 Market in North America for Equipment in Semiconductor Industry, By Country, 2015�2023 (USD Thousand)
Table 16 Market for Equipment in Other Industries, By Region, 2015�2023 (USD Million)
Table 17 Market in North America for Equipment in Other Industries, By Country, 2015�2023 (USD Million)
Table 18 Market for Equipment, By Region, 2015�2023 (USD Million)
Table 19 Market for Consumables, By Region, 2015�2023 (USD Million)
Table 20 Market in North America, By Type, 2015�2023 (USD Million)
Table 21 Market in North America for Equipment, By Country, 2015�2023 (USD Million)
Table 22 Market in North America for Equipment, By Industry, 2015�2023 (USD Million)
Table 23 Market in Europe, By Type, 2015�2023 (USD Million)
Table 24 Market in Europe for Equipment, By Industry, 2015�2023 (USD Thousand)
Table 25 Market in Europe for Equipment, By Country, 2015�2023 (USD Million)
Table 26 Market in APAC, By Type, 2015�2023 (USD Million)
Table 27 Market in APAC for Equipment, By Country, 2015�2023 (USD Million)
Table 28 Market in APAC for Equipment, By Industry, 2015�2023 (USD Million)
Table 29 Market in RoW, By Type, 2015�2023 (USD Million)
Table 30 Market in RoW for Equipment, By Region, 2015�2023 (USD Million)
Table 31 Market in RoW for Equipment, By Industry, 2015�2023 (USD Million)
Table 32 Top Companies in Market, 2017
Table 33 Product Launches, 2015�2017
Table 34 Expansions, 2015�2017
Table 35 Acquisitions, 2015�2017
List of Figures (32 Figures)
Figure 1 Markets Covered
Figure 2 Silica Analyzer Market, By Geography
Figure 3 Market: Research Design
Figure 4 Bottom-Up Approach to Arrive at Market Size
Figure 5 Top-Down Approach to Arrive at Market Size
Figure 6 Data Triangulation
Figure 7 Market Segmentation
Figure 8 Global Market Size and Growth Rate
Figure 9 Consumables to Dominate Global Market During Forecast Period
Figure 10 Power Generation Industry to Command Global Market During 2018�2023
Figure 11 Utility Grade Power Plants to Witness Highest CAGR in Market for Equipment During Forecast Period
Figure 12 Market in APAC Expect to Grow at Highest CAGR Between 2018 and 2023
Figure 13 Attractive Growth Opportunities in Market Between 2018 and 2023
Figure 14 Power Generation Industry to Dominate North American Market During Forecast Period
Figure 15 Consumables Expected to Capture Larger Market Share in 2018
Figure 16 China to Lead Market in APAC in 2018
Figure 17 APAC to Account for Largest Share of Market in 2018
Figure 18 Market Dynamics
Figure 19 Thermal Power Sources Dominate Energy Mix
Figure 20 Coal to Remain as Main Fuel Source for Thermal Power Generation in APAC
Figure 21 Market, By Type
Figure 22 Market, By Industry
Figure 23 Market, By Geography
Figure 24 Market Snapshot in North America
Figure 25 Market Snapshot in APAC
Figure 26 Thermo Fisher Scientific: Company Snapshot
Figure 27 ABB: Company Snapshot
Figure 28 Mettler Toledo: Company Snapshot
Figure 29 Horiba: Company Snapshot
Figure 30 Nikkiso: Company Snapshot
Figure 31 SPX Flow: Company Snapshot
Figure 32 Endress+Hauser: Company Snapshot


Growth opportunities and latent adjacency in Silica Analyzer Market