Small-Scale LNG Market

Small-Scale LNG Market by Type (Liquefaction, Regasification), Application (Heavy-Duty Vehicles, Industrial & Power, Marine Transport), Mode of supply (Trucks, Trans-shipment & Bunkering) Region (North America, Europe, APAC, MEA) - Global Forecast to 2028

Report Code: CH 5185 Aug, 2023, by marketsandmarkets.com

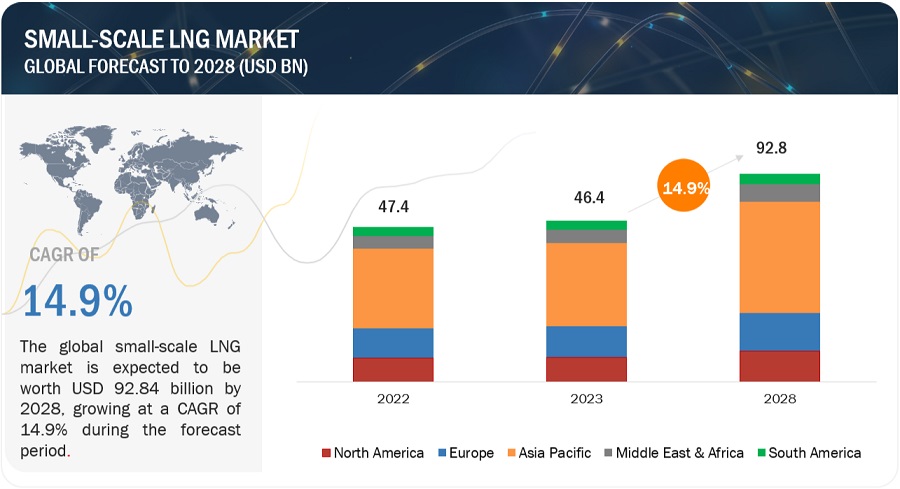
The small-scale LNG market is projected to grow from USD 46.4 billion in 2023 to USD 92.8 billion by 2028, recording a CAGR of 14.9% during the forecast period . The market dynamics of small-scale LNG have experienced significant growth and transformation in recent years.  The demand for small-scale LNG has been driven by several factors, including the increasing need for cleaner energy sources, and the development of innovative liquefaction and regasification technologies. Furthermore, the rising adoption of LNG as a marine fuel and the expansion of remote and off-grid industries have contributed to the market's expansion. As a result, the small-scale LNG market has witnessed the emergence of new players, the establishment of specialized infrastructure, and the formation of strategic partnerships across the LNG value chain. Going forward, the market dynamics of small-scale LNG are expected to continue evolving as technology advancements, regulatory frameworks, and shifting energy demand patterns shape the industry landscape.

Attractive Opportunities in the Small-Scale Lng Market
Small-Scale LNG Market

To know about the assumptions considered for the study, Request for Free Sample Report
Small-Scale LNG Market

Small-scale LNG Market Dynamics

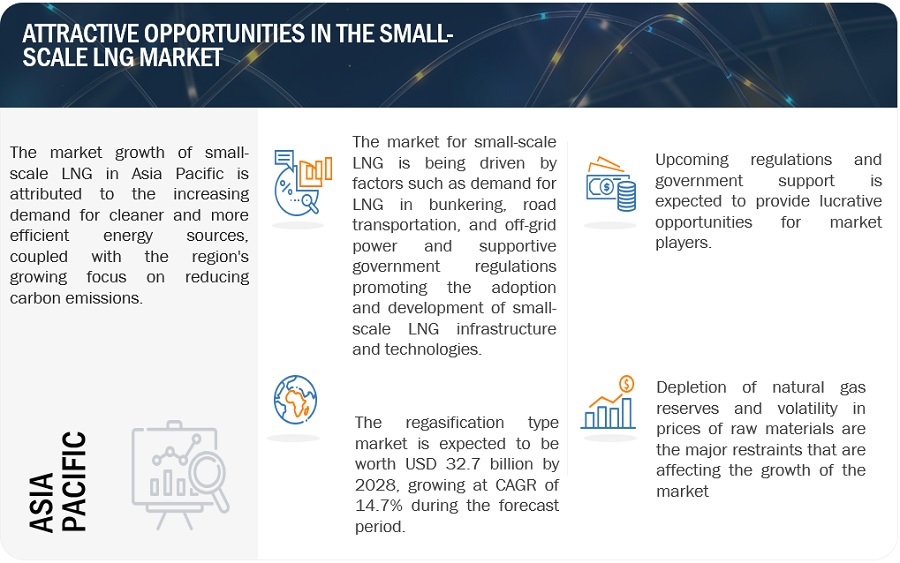
Driver: Rising demand for LNG in bunkering, road transportation, and off-grid power

The demand for small-scale LNG (liquefied natural gas) has been experiencing significant growth in various sectors, including bunkering, road transport, and off-grid power. Bunkering, which refers to the process of supplying fuel to ships, is increasingly adopting LNG as a cleaner alternative to traditional marine fuels. With stricter emissions regulations in place, LNG offers a solution that reduces sulfur and particulate matter emissions, contributing to cleaner maritime operations. In road transport, small-scale LNG is gaining traction as a viable option for heavy-duty vehicles, such as trucks and buses. It provides lower emissions, improved air quality, and enhanced fuel efficiency compared to diesel. Furthermore, in remote areas or regions lacking access to centralized power grids, small-scale LNG is emerging as a reliable and cleaner alternative for off-grid power generation. The flexibility and scalability of small-scale LNG infrastructure make it suitable for diverse applications, meeting the growing demand for cleaner energy solutions across these sectors.

Restraints: Depletion of natural resources and volatility in prices of raw materials

The depletion of natural resources and volatility in the prices of raw materials are indeed major restraints that significantly affect the growth of small-scale LNG (liquefied natural gas). The U.S. Energy Information Administration (EIA) estimates proved reserves by analyzing data collected from oil and gas companies each year. According to their latest report from the end of 2021, the total estimated proved reserves of natural gas in the United States, including liquid gases, was about 625.4 trillion cubic feet (Tcf) in 2021. When we exclude the liquid gases, the remaining dry natural gas reserves amount to about 589 Tcf. The production of LNG relies on the extraction and processing of natural gas, which is a finite resource. As the demand for natural gas and LNG continues to rise, the availability of easily accessible reserves becomes more limited, leading to increased exploration costs and diminishing production rates. This depletion of natural gas reserves poses a significant challenge for small-scale LNG projects, as they often operate with limited financial resources and cannot compete with larger players in securing long-term gas supply contracts. 

Moreover, the volatility in prices of raw materials, particularly natural gas, further exacerbates the challenges faced by small-scale LNG. The prices of natural gas are subject to various factors, such as supply and demand dynamics, geopolitical tensions, and weather conditions. Fluctuations in natural gas prices can significantly impact the profitability of small-scale LNG projects, as they typically lack the resources and flexibility to absorb sudden price spikes or negotiate favorable long-term contracts. These price volatilities create uncertainty and risk, making it difficult for small-scale LNG ventures to secure financing and attract investors.

Opportunity: Integration of new technology

The integration of new technologies presents a promising opportunity for small-scale LNG plants. By implementing innovative solutions, these facilities can significantly reduce costs and enhance various aspects of the value chain. For instance, the utilization of prefabricated tanks instead of large-capacity storage tanks can contribute to cost savings. Additionally, small-scale LNG terminals can opt for pressurized storage tanks instead of atmospheric storage tanks, which are readily available from multiple suppliers in smaller increments. One of the key advantages of pressurized storage tanks is their effective handling of boil-off gas (BOG). In small-scale LNG terminals, the generated BOG can be directly channeled into the gas pipeline or used for electricity generation to supplement utilities. This approach considerably reduces the cost associated with BOG handling by allowing the pressure to increase within the storage tanks. Subsequently, the high-pressure gas can be injected into the pipeline or burned for auxiliary power generation. In contrast to traditional LNG terminals, small-scale LNG facilities can achieve LNG vaporization through the use of atmospheric vaporizers utilizing ambient air, a technology that has long been employed in nitrogen facilities.

Furthermore, the adoption of nitrogen expansion technology in small-scale LNG liquefaction plants offers a valuable alternative to the liquefaction process. By utilizing nitrogen as a refrigerant, this approach provides a readily available and non-flammable gas, enhancing safety and environmental considerations. Nitrogen expansion technology also offers higher efficiency compared to other liquefaction methods, leading to lower operating costs.

Moreover, the generation of electricity using small-scale LNG proves beneficial for remote areas lacking access to the power grid. This application is particularly relevant in industries such as mining, oil & gas, and rural communities. Danish company Kosan Crisplant specializes in the design and manufacture of modular and scalable small-scale LNG liquefaction plants, making them suitable for various off-grid applications. Similarly, Norwegian company Siraga offers a range of solutions for small-scale LNG, including liquefaction plants, storage tanks, and refueling equipment. Their efficient and cost-effective systems make them an attractive choice for businesses and communities seeking to transition to LNG.

Challenges:Supply chain disruptions, limited supply, and retrofitting costs are the major challenges that can affect the growth of small-scale LNG

The small-scale liquefied natural gas (ssLNG) market faces several challenges that need to be addressed for its successful development. One significant challenge is the possibility of transport disruptions. Unlike large-scale LNG shipments that rely on specialized infrastructure and vessels, ssLNG relies on smaller vessels or trucks for transportation. This can make the supply chain vulnerable to disruptions caused by adverse weather conditions, road or port closures, or logistical challenges. These disruptions can lead to delays in deliveries, affecting the reliability of ssLNG supply to end-users.

Another challenge is the limited volume of gas that can be supplied through ssLNG. Small-scale LNG facilities have relatively lower liquefaction capacities compared to large-scale plants. This limited volume can be a constraint in meeting the growing demand for natural gas in certain regions or industries. It may require multiple small-scale facilities to operate in parallel to supply an equivalent volume of gas that a single large-scale LNG plant can deliver. Coordinating and optimizing these multiple facilities can be complex and costly.

Additionally, the costs associated with retrofitting or re-engineering equipment is another challenge in the ssLNG market. Converting existing infrastructure or equipment, such as storage tanks, terminals, and regasification facilities, to handle ssLNG can be expensive. Retrofitting involves modifications and upgrades to ensure compatibility with smaller-scale operations, such as adjusting storage and handling capacities, implementing specialized equipment, or integrating safety measures. These retrofitting costs can add to the overall project expenses and may pose a barrier to the widespread adoption of ssLNG infrastructure.

Additionally, the relatively higher costs of ssLNG production compared to large-scale LNG can be a challenge. Smaller liquefaction plants typically have higher unit costs due to economies of scale. The smaller volumes processed, coupled with the need for specialized equipment and operations, can result in higher per-unit production costs. These higher costs may affect the competitiveness of ssLNG in the market, particularly when compared to other energy sources or larger-scale LNG projects.

In conclusion, while the small-scale LNG market presents opportunities for providing natural gas to regions or industries that lack access to large-scale infrastructure, it also faces challenges. These challenges include the vulnerability to transport disruptions, limited supply volumes, the costs of retrofitting or re-engineering equipment, and the relatively higher production costs. Overcoming these challenges requires strategic planning, investment, technological advancements, and collaboration among stakeholders to ensure the successful development and growth of the ssLNG market.

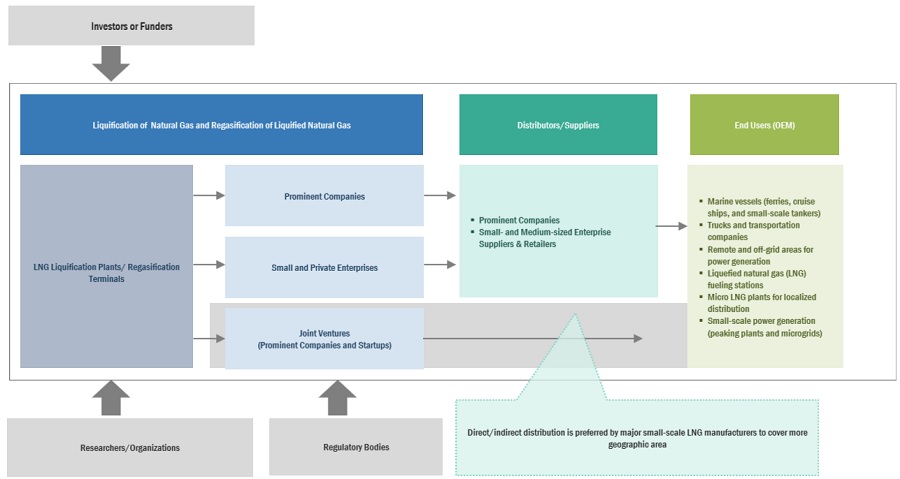
Market Ecosystem
Small-Scale LNG Market Ecosystem

Based on type, the liquefaction segment is expected to be the most significant contributor in the small-scale LNG market during the forecast period.

The liquefaction segment is projected to have a higher market share during the forecast period. This is primarily due to the increasing export of liquefied natural gas (LNG) and the subsequent need for liquefaction before it can be transported from one port to another. LNG is natural gas that has been cooled to its liquid state for ease of transportation and storage. It occupies significantly less volume than its gaseous state, making it feasible to transport large quantities over long distances. However, to convert natural gas into LNG, it must undergo a liquefaction process. The demand for LNG has been steadily increasing worldwide. This is driven by various factors such as the shift towards cleaner energy sources, rising energy consumption, and the growing demand for natural gas in sectors such as power generation, industrial applications, and transportation. As a result, there has been a significant expansion in LNG trade and infrastructure, leading to the construction of liquefaction terminals.

Liquefaction terminals are specialized facilities that cool natural gas to extremely low temperatures, typically around -160°C (-256°F), to convert it into LNG. These terminals are crucial for the export of LNG as they enable the efficient production and storage of large quantities of liquefied gas. They play a vital role in meeting the rising global demand for LNG and facilitating its transportation across different regions. The establishment of liquefaction terminals has been on the rise globally to support the growing demand for LNG including small-scale. Many countries are investing in the construction of these terminals to capitalize on their natural gas reserves and gain a competitive advantage in the LNG market. This expansion of liquefaction infrastructure is expected to drive the demand for liquefaction services during the forecast period.

By application, the heavy-duty vehicles segment is expected to be the most significant contributor in the small-scale LNG market during the forecast period.

The heavy-duty vehicles segment is projected to hold the largest share of the market in 2022, and this growth is primarily attributed to the increasing adoption of liquefied natural gas (LNG) as a fuel in heavy-duty vehicles, particularly in China and European countries. LNG has emerged as the most viable option for long-haul LNG-fueled trucks worldwide. One of the key considerations in utilizing LNG as a fuel for heavy-duty vehicles is the density of LNG, which can vary significantly depending on saturation pressures and storage temperatures. To optimize the performance and efficiency of LNG-fueled trucks, the LNG vehicle fuel system is designed to deliver natural gas to the engine at the required supply pressure while maximizing the fuel density at vehicle tanks and fueling stations. By maintaining the optimal density of LNG, heavy-duty vehicles can benefit from enhanced fuel efficiency, extended driving range, and improved overall performance. These advantages have driven the demand for LNG as a fuel for heavy-duty vehicles, as they offer a practical and environmentally friendly alternative to traditional diesel fuels.

China and European countries have been at the forefront of adopting LNG as a fuel for heavy-duty vehicles due to their increasing focus on reducing greenhouse gas emissions and improving air quality. The use of LNG in heavy-duty vehicles helps to lower carbon dioxide (CO2) emissions, reduce particulate matter, and minimize nitrogen oxide (NOx) emissions, which are major contributors to air pollution.

The significant growth potential in the heavy-duty vehicles segment is driven by the increasing regulatory measures and incentives aimed at promoting the use of clean and sustainable fuels. Governments and regulatory bodies are implementing policies to encourage the adoption of LNG as a fuel in heavy-duty transportation, including tax benefits, subsidies, and infrastructure development for LNG fueling stations.

Furthermore, the advancements in LNG storage and fueling technologies have made it easier to handle and transport LNG, enabling the expansion of LNG infrastructure for heavy-duty vehicles. The development of a well-established LNG supply chain, including production, storage, and distribution infrastructure, has played a crucial role in supporting the growth of LNG as a fuel in the heavy-duty vehicles segment. In conclusion, the dominance of the heavy-duty vehicles segment in the market is driven by the increasing use of LNG as a fuel, particularly in China and European countries. The optimization of LNG density in the vehicle fuel system and the associated benefits in terms of fuel efficiency, extended range, and environmental sustainability are key factors contributing to the rising demand for LNG in heavy-duty vehicles.

By mode of supply  Trucks  is expected to be the largest market during the forecast period

Using trucks for LNG transportation offers a high level of flexibility and accessibility. LNG trucks can navigate various routes and deliver LNG to remote or challenging locations that may not have access to pipelines or other infrastructure. This flexibility makes trucking an attractive option for small-scale LNG distribution. For small-scale LNG operations, investing in pipelines or dedicated infrastructure can be expensive. On the other hand, using trucks allows for a more cost-effective approach, as it eliminates the need for extensive infrastructure development. This makes trucking a viable solution for small-scale LNG projects. Additronally, LNG trucks are well-suited for regional distribution, especially in areas where LNG consumption is concentrated in smaller volumes. They can transport LNG to various end-users within a specific region, catering to industries, power plants, or even individual consumers, efficiently meeting their energy needs.

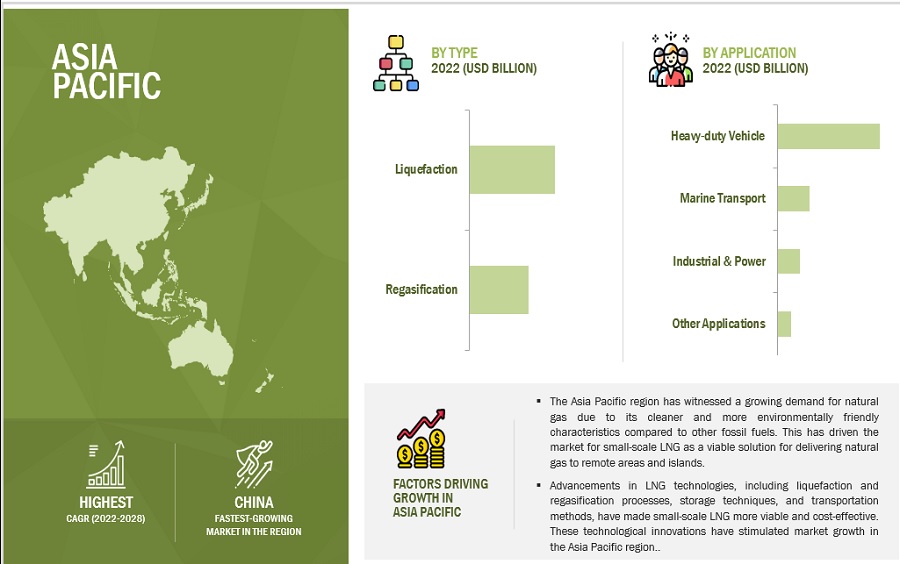
Asia Pacific is expected to be the largest market during the forecast period

The Asia Pacific (APAC) region is currently experiencing remarkable growth in the small-scale liquefied natural gas (LNG) market, positioning itself as the largest and fastest-growing market in this sector. This expansion is driven by the escalating adoption of small-scale LNG across various applications, including heavy-duty vehicles, industrial operations, and the power sector. The demand surge can be attributed to several key factors that make this growth impactful and significant for the region. Firstly, the APAC region is witnessing a substantial increase in population, accompanied by rising disposable income levels. As more people enter the middle class and aspire for higher living standards, the demand for energy, particularly in the form of LNG, is escalating. Small-scale LNG offers a versatile and cleaner alternative to traditional fuels, making it an attractive option for meeting the energy needs of a growing population. Secondly, countries like China, South Korea, and Taiwan are experiencing robust economic growth. These nations have emerged as major players in industrial production, manufacturing, and infrastructure development. To sustain this economic momentum, reliable and efficient energy sources are crucial. Small-scale LNG provides a flexible and accessible solution, enabling these countries to power their industries and fuel their growth with cleaner and more sustainable energy.

Furthermore, the versatility of small-scale LNG plays a pivotal role in its market growth. It can be used in heavy-duty vehicles, reducing emissions and contributing to the transition towards greener transportation. Additionally, small-scale LNG finds applications in various industrial sectors, such as manufacturing, mining, and construction, where it serves as a reliable source of energy for machinery and operations. Moreover, small-scale LNG can be utilized in power generation, particularly in remote areas or regions with limited access to traditional energy infrastructure. The impact of this growth in the small-scale LNG market in APAC extends beyond immediate economic benefits. By embracing cleaner energy alternatives, the region can address environmental concerns and reduce greenhouse gas emissions. Small-scale LNG offers a pathway towards achieving sustainability goals, supporting initiatives to combat climate change and improve air quality.
Small-Scale LNG Market by Region

To know about the assumptions considered for the study, download the pdf brochure

Key Market Players

The major key players in the small-scale LNG market include Linde plc (US), Wartsila Corporation (Finland), Honeywell International Inc. (US), Shell plc (UK), Air Products & Chemicals, Inc. (US), ENGIE S.A (France), Chart Industries, Inc. (US), Gasum oy (Finland), Sofregaz (France), and Excelerate Energy Inc (US).

Get online access to the report on the World's First Market Intelligence Cloud

  • Easy to Download Historical Data & Forecast Numbers
  • Company Analysis Dashboard for high growth potential opportunities
  • Research Analyst Access for customization & queries
  • Competitor Analysis with Interactive dashboard
  • Latest News, Updates & Trend analysis
Request Sample

Scope of the Report

:

Report Metric

Details

Years Considered

2021–2028

Base year

2022

Forecast period

2023–2028

Unit considered 

Value (USD Billion), Volume (Million Tons per Annum)

Segments

Type, Application, Mode of Supply, and Region

Regions

North America, Asia Pacific, Europe, South America, and the Middle East & Africa

Companies

The major players are Linde plc (US), Wartsila Corporation (Finland), Honeywell International Inc. (US), Shell plc (UK), Air Products & Chemicals, Inc. (US), ENGIE S.A (France), Chart Industries, Inc. (US), Gasum oy (Finland), Sofregaz (France), and Excelerate Energy Inc (US).

This research report categorizes the global small-scale LNG market based on Product Type, Application, Type, Packaging Type, and Region

On the basis of Type, the small-scale LNG market has been categorized as follows:
  • Liquification
  • Regasification
On the basis of applications, the small-scale LNG market has been categorized as follows:
  • Heavy duty vehicles
  • Marine Transport
  • Industrial & Power
  • Other Applications
On the basis of mode of supply, the small-scale LNG market has been categorized as follows:
  • Trucks
  • Trans-shipment & Bunkering
  • Others
On the basis of region, the small-scale LNG market has been categorized as follows:
  • North America
  • Europe
  • Asia Pacific
  • Middle East & Africa
  • South America

Recent Developments

  • In June 2023, Wartsila Corporation has got the contract to increase the capacity of the regasification system on the floating storage and regasification unit (FSRU). This floating storage and regasification unit (FSRU) vessel is owned by LNG Hrvatska, based in Zagreb, and serves as an LNG terminal on Krk island. The Wartsila Corporation will work together with the existing regasification system on the ship and increase its capacity by 212 million standard cubic feet per day or 250,000 cubic meters per hour.
  • In February 2021, Elengy, a subsidiary of ENGIE S.A, has entered into an agreement with Delta Rail, a transportation company. The purpose of this agreement is to introduce a new service for loading LNG containers from multimodal platforms in Europe. This agreement will allow customers to load LNG containers onto Delta Rail's wagons at Elengy's LNG terminals in France and Belgium, and then transport the containers to their final destinations by rail.This agreement is expected to reduce the cost and environmental impact of transporting LNG by making it possible to transport LNG containers by rail over longer distances.
  • In July 2022, Snam and Edison entered into a collaborative agreement to work together on various initiatives spanning the entire small-scale LNG value chain. The partnership entails the joint identification and development of opportunities in areas such as road and ship transportation, liquefaction processes, and distribution networks within the small-scale LNG sector.
  • In December 2021, Elengy, a subsidiary of ENGIE S.A, successfully launched Micro-LNG carrier loading service. This loading services enables micro-LNG carriers, upon loading at the terminal, to efficiently supply LNG-powered container ships, ferries, and cruise ships arriving at the port of Marseille-Fos.
  • In March 2019, Chart Industries, Inc. and Indian Oil Corporation signed and MoU to promote the development of the LNG Market in India. Both the companies will be focusing on modular liquefaction, regasification, LNG bunkering for marine applications, LNG and LCNG vehicle fueling stations, alternative LNG transportation methods, LNG Micro Bulk systems. Their collaboration aims to tap into the growing demand for natural gas in India and promote its development in industrial and commercial sectors.

Frequently Asked Questions (FAQ):

To speak to our analyst for a discussion on the above findings, click Speak to Analyst

TABLE OF CONTENTS
 
1 INTRODUCTION (Page No. - 34)
    1.1 STUDY OBJECTIVES 
    1.2 MARKET DEFINITION 
           1.2.1 INCLUSIONS AND EXCLUSIONS
    1.3 STUDY SCOPE 
           1.3.1 MARKET SEGMENTATION
           1.3.2 REGIONS COVERED
           1.3.3 YEARS CONSIDERED
    1.4 CURRENCY CONSIDERED 
    1.5 UNITS CONSIDERED 
    1.6 LIMITATIONS
    1.7 STAKEHOLDERS 
    1.8 SUMMARY OF CHANGES 
 
2 RESEARCH METHODOLOGY (Page No. - 39)
    2.1 RESEARCH DATA 
          FIGURE 1 RESEARCH DATA IN SMALL-SCALE LNG MARKET
           2.1.1 SECONDARY DATA
                    2.1.1.1 Key data from secondary sources
           2.1.2 PRIMARY DATA
                    2.1.2.1 Key data from primary sources
                    2.1.2.2 Breakdown of primary interviews
    2.2 BASE NUMBER CALCULATION 
           2.2.1 SUPPLY-SIDE APPROACH 1
           2.2.2 SUPPLY-SIDE APPROACH 2
    2.3 MARKET SIZE ESTIMATION 
           2.3.1 BOTTOM-UP APPROACH
           2.3.2 TOP-DOWN APPROACH
    2.4 DATA TRIANGULATION 
          FIGURE 2 SMALL-SCALE LNG MARKET: DATA TRIANGULATION
    2.5 RESEARCH ASSUMPTIONS 
    2.6 RECESSION IMPACT 
 
3 EXECUTIVE SUMMARY (Page No. - 46)
    FIGURE 3 LIQUEFACTION TYPE TO LEAD SMALL-SCALE LNG MARKET
    FIGURE 4 TRUCKS SEGMENT TO DOMINATE MARKET DURING FORECAST PERIOD
    FIGURE 5 HEAVY-DUTY VEHICLE APPLICATION TO LEAD MARKET DURING  FORECAST PERIOD
    FIGURE 6 ASIA PACIFIC LED SMALL-SCALE LNG MARKET IN 2022
 
4 PREMIUM INSIGHTS (Page No. - 50)
    4.1 ATTRACTIVE OPPORTUNITIES FOR PLAYERS IN SMALL-SCALE LNG MARKET 
          FIGURE 7 ASIA PACIFIC TO BE FASTEST GROWING SMALL-SCALE LNG MARKET DURING FORECAST PERIOD
    4.2 SMALL-SCALE LNG MARKET, BY TYPE 
          FIGURE 8 LIQUEFACTION TYPE TO RECORD HIGH CAGR DURING FORECAST PERIOD
    4.3 SMALL-SCALE LNG MARKET, BY MODE OF SUPPLY 
          FIGURE 9 TRUCK SEGMENT TO RECORD HIGH CAGR DURING FORECAST PERIOD
    4.4 SMALL-SCALE LNG MARKET, BY APPLICATION 
          FIGURE 10 ALL APPLICATION SEGMENTS TO SHOW SIGNIFICANT GROWTH DURING FORECAST PERIOD
    4.5 SMALL-SCALE LNG MARKET: MAJOR COUNTRIES 
          FIGURE 11 CHINA TO GROW AT HIGHEST CAGR DURING FORECAST PERIOD
    4.6 ASIA PACIFIC: SMALL-SCALE LNG MARKET, BY TYPE & COUNTRY 
          FIGURE 12 LIQUEFACTION TYPE AND CHINA LED MARKET IN ASIA PACIFIC IN 2022
 
5 MARKET OVERVIEW (Page No. - 53)
    5.1 INTRODUCTION 
    5.2 MARKET DYNAMICS 
          FIGURE 13 DRIVERS, RESTRAINTS, OPPORTUNITIES, AND CHALLENGES IN SMALL-SCALE LNG MARKET
           5.2.1 DRIVERS
                    5.2.1.1 Price competitiveness of LNG compared to other transportation fuel
                                TABLE 1 LIQUEFIED NATURAL GAS (LNG) AND DIESEL AVERAGE RETAIL PRICES BY REGION, 2022
                    5.2.1.2 Advantages of small-scale plants over large-scale plants
                    5.2.1.3 Environmental benefits and stringent regulations
                    5.2.1.4 Fiscal regime and government subsidies
                    5.2.1.5 Rising demand for LNG in bunkering, road transportation, and off-grid power
           5.2.2 RESTRAINTS
                    5.2.2.1 Limited LNG receiving terminal infrastructure in Asia Pacific compared to other regions
                    5.2.2.2 Depletion of natural resources and volatility in prices of raw materials
                                FIGURE 14 SMALL-SCALE LNG MARKET: VOLATILE PRICES OF HENRY HUB NATURAL GAS (USD/MMBTU)
           5.2.3 OPPORTUNITIES
                    5.2.3.1 Integration of new technology
           5.2.4 CHALLENGES
                    5.2.4.1 Supply chain disruptions, limited supply, and high retrofitting costs
    5.3 PORTER’S FIVE FORCES ANALYSIS 
          FIGURE 15 SMALL-SCALE LNG MARKET: PORTER’S FIVE FORCES ANALYSIS
           5.3.1 BARGAINING POWER OF SUPPLIERS
           5.3.2 THREAT OF NEW ENTRANTS
           5.3.3 THREAT OF SUBSTITUTES
           5.3.4 BARGAINING POWER OF BUYERS
           5.3.5 INTENSITY OF COMPETITIVE RIVALRY
 
6 INDUSTRY TRENDS (Page No. - 65)
    6.1 MACROECONOMIC INDICATORS 
           6.1.1 INTRODUCTION
           6.1.2 GDP TRENDS AND FORECAST
                    TABLE 2 WORLD GDP GROWTH PROJECTION, 2021–2028 (USD TRILLION)
    6.2 VALUE CHAIN ANALYSIS 
          FIGURE 16 SMALL-SCALE LNG: VALUE CHAIN ANALYSIS
    6.3 SUPPLY CHAIN ANALYSIS 
          FIGURE 17 SMALL-SCALE LNG MARKET: SUPPLY CHAIN
    6.4 TRENDS AND DISRUPTIONS IMPACTING CUSTOMER’S BUSINESS 
          FIGURE 18 TRENDS AND DISRUPTIONS IMPACTING CUSTOMER’S BUSINESS
    6.5 ECOSYSTEM MAPPING 
          FIGURE 19 ECOSYSTEM MAP
    6.6 PATENT ANALYSIS 
           6.6.1 INTRODUCTION
           6.6.2 METHODOLOGY
           6.6.3 DOCUMENT TYPE FOR SMALL-SCALE LNG (2013–2022)
                    TABLE 3 TOTAL NUMBER OF PATENTS FOR SMALL-SCALE LNG
                    FIGURE 20 SMALL-SCALE LNG MARKET: GRANTED PATENTS AND PATENT APPLICATIONS
                    FIGURE 21 PUBLICATION TRENDS - LAST 10 YEARS (2013–2022)
           6.6.4 INSIGHTS
                    FIGURE 22 JURISDICTION ANALYSIS (2013–2022)
           6.6.5 TOP COMPANIES/APPLICANTS (TILL 2022)
                    FIGURE 23 TOP APPLICANTS OF SMALL-SCALE LNG
                    TABLE 4 PATENTS FOR SMALL-SCALE LNG
           6.6.6 DISCLAIMER
    6.7 TECHNOLOGY ANALYSIS 
           6.7.1 NITROGEN EXPANDER TECHNOLOGY
           6.7.2 PREFABRICATED MODULAR PLANTS
           6.7.3 SINGLE MIXED REFRIGERANT (SMR) TECHNOLOGY
           6.7.4 MEMBRANE CONTAINMENT SYSTEMS
    6.8 REGULATORY BODIES, GOVERNMENT AGENCIES, AND OTHER ORGANIZATIONS 
          TABLE 5 SMALL-SCALE LNG MARKET: REGULATORY BODIES, GOVERNMENT AGENCIES, AND OTHER ORGANIZATIONS
    6.9 KEY STAKEHOLDERS & BUYING CRITERIA 
           6.9.1 KEY STAKEHOLDERS IN BUYING PROCESS
                    FIGURE 24 INFLUENCE OF STAKEHOLDERS ON BUYING PROCESS
                    TABLE 6 INFLUENCE OF STAKEHOLDERS ON BUYING PROCESS OF SMALL-SCALE LNG
           6.9.2 BUYING CRITERIA
                    FIGURE 25 KEY BUYING CRITERIA OF SMALL-SCALE LNG INDUSTRY
                    TABLE 7 KEY BUYING CRITERIA FOR SMALL-SCALE LNG INDUSTRY
    6.10 TRADE ANALYSIS 
           TABLE 8 IMPORTERS OF LNG, BY VALUE (USD BILLION), IN 2022 (HS = 271111)
           TABLE 9 EXPORTERS OF LNG, BY VALUE (USD BILLION), IN 2022 (HS = 271111)
    6.11 NATURAL GAS RESERVES 
           TABLE 10 TOP 15 COUNTRIES WITH LARGEST PROVEN NATURAL GAS RESERVES AND THEIR WORLD SHARE
    6.12 NATURAL GAS CONSUMPTION 
           TABLE 11 TOP 15 COUNTRIES WITH NATURAL GAS CONSUMPTION AND THEIR WORLD SHARE
    6.13 CASE STUDY ANALYSIS 
           TABLE 12 CHART INDUSTRIES: C50N LNG LIQUEFIER
           TABLE 13 WARTSILLA: DRAGON LNG TERMINAL - BOG RELIQUEFACTION FOR LNG TERMINALS
    6.14 KEY CONFERENCES 
           TABLE 14 SMALL-SCALE LNG MARKET: DETAILED LIST OF CONFERENCES & EVENTS, 2023–2024
    6.15 PRICING ANALYSIS 
           6.15.1 COST ANALYSIS ON SMALL-SCALE LNG PROJECTS
 
7 SMALL-SCALE LNG MARKET, BY TYPE (Page No. - 89)
    7.1 INTRODUCTION 
          FIGURE 26 LIQUEFACTION TO DOMINATE SMALL-SCALE LNG MARKET DURING FORECAST PERIOD
          TABLE 15 SMALL-SCALE LNG MARKET, BY TYPE, 2021–2028 (MTPA)
          TABLE 16 SMALL-SCALE LNG MARKET, BY TYPE, 2021–2028 (USD MILLION)
    7.2 LIQUEFACTION 
           7.2.1 HIGH DEMAND FOR LOCAL PRODUCTION OF LNG TO DRIVE MARKET
    7.3 REGASIFICATION 
           7.3.1 GROWING DEMAND FOR LNG IN ASIA PACIFIC TO DRIVE MARKET
 
8 SMALL-SCALE LNG MARKET, BY MODE OF SUPPLY (Page No. - 93)
    8.1 INTRODUCTION 
          FIGURE 27 TRUCKS SEGMENT TO DOMINATE SMALL-SCALE LNG MARKET DURING FORECAST PERIOD
          TABLE 17 SMALL-SCALE LNG MARKET, BY MODE OF SUPPLY, 2021–2028 (MTPA)
          TABLE 18 SMALL-SCALE LNG MARKET, BY MODE OF SUPPLY, 2021–2028 (USD MILLION)
    8.2 TRUCKS 
           8.2.1 ABILITY TO TRANSPORT LNG TO OFF-GRID AREAS TO DRIVE MARKET
    8.3 TRANS-SHIPMENT & BUNKERING 
           8.3.1 GOVERNMENT INITIATIVES TO DRIVE MARKET
    8.4 OTHERS 
           8.4.1 CONSIDERABLE GOVERNMENT SUPPORT TO DRIVE MARKET
 
9 SMALL-SCALE LNG MARKET, BY APPLICATION (Page No. - 98)
    9.1 INTRODUCTION 
          FIGURE 28 HEAVY-DUTY VEHICLES TO BE LARGEST APPLICATION OF SMALL-SCALE LNG
          TABLE 19 SMALL-SCALE LNG MARKET, BY APPLICATION, 2021–2028 (MTPA)
          TABLE 20 SMALL-SCALE LNG MARKET, BY APPLICATION, 2021–2028 (USD MILLION)
    9.2 HEAVY-DUTY VEHICLES 
           9.2.1 COST-SAVING BENEFITS OF LNG IN HEAVY-DUTY TRUCKS TO DRIVE MARKET
    9.3 MARINE TRANSPORT 
           9.3.1 ENVIRONMENTAL REGULATIONS FOR EMISSION CONTROL AREAS (ECA) TO DRIVE MARKET
    9.4 INDUSTRIAL & POWER 
           9.4.1 INCREASING DEMAND FOR NATURAL GAS IN ELECTRICITY GENERATION TO DRIVE MARKET
    9.5 OTHERS 
 
10 SMALL-SCALE LNG MARKET, BY REGION (Page No. - 103)
     10.1 INTRODUCTION 
             FIGURE 29 ASIA PACIFIC TO BE FASTEST-GROWING SMALL-SCALE LNG MARKET
             TABLE 21 SMALL-SCALE LNG MARKET, BY REGION, 2021–2028 (MTPA)
             TABLE 22 SMALL-SCALE LNG MARKET, BY REGION, 2021–2028 (USD MILLION)
     10.2 ASIA PACIFIC 
             10.2.1 RECESSION IMPACT
                        FIGURE 30 ASIA PACIFIC: SMALL-SCALE LNG MARKET SNAPSHOT
                        TABLE 23 ASIA PACIFIC: SMALL-SCALE LNG MARKET, BY COUNTRY, 2021–2028 (MTPA)
                        TABLE 24 ASIA PACIFIC: SMALL-SCALE LNG MARKET, BY COUNTRY, 2021–2028 (USD MILLION)
                        TABLE 25 ASIA PACIFIC: SMALL-SCALE LNG MARKET, BY TYPE, 2021–2028 (MTPA)
                        TABLE 26 ASIA PACIFIC: SMALL-SCALE LNG MARKET, BY TYPE, 2021–2028 (USD MILLION)
                        TABLE 27 ASIA PACIFIC: SMALL-SCALE LNG MARKET, BY MODE OF SUPPLY, 2021–2028 (MTPA)
                        TABLE 28 ASIA PACIFIC: SMALL-SCALE LNG MARKET, BY MODE OF SUPPLY,  2021–2028 (USD MILLION)
                        TABLE 29 ASIA PACIFIC: SMALL-SCALE LNG MARKET, BY APPLICATION, 2021–2028 (MTPA)
                        TABLE 30 ASIA PACIFIC: SMALL-SCALE LNG MARKET, BY APPLICATION, 2021–2028 (USD MILLION)
             10.2.2 CHINA
                        10.2.2.1 Growth in transport industry to drive market
                                      TABLE 31 CHINA: SMALL-SCALE LNG MARKET, BY TYPE, 2021–2028 (MTPA)
                                      TABLE 32 CHINA: SMALL-SCALE LNG MARKET, BY TYPE, 2021–2028 (USD MILLION)
                                      TABLE 33 CHINA: SMALL-SCALE LNG MARKET, BY MODE OF SUPPLY, 2021–2028 (MTPA)
                                      TABLE 34 CHINA: SMALL-SCALE LNG MARKET, BY MODE OF SUPPLY, 2021–2028 (USD MILLION)
                                      TABLE 35 CHINA: SMALL-SCALE LNG MARKET, BY APPLICATION, 2021–2028 (MTPA)
                                      TABLE 36 CHINA: SMALL-SCALE LNG MARKET, BY APPLICATION, 2021–2028 (USD MILLION)
             10.2.3 JAPAN
                        10.2.3.1 Demand for regasification and increasing import of small-scale LNG to drive market
                                      TABLE 37 JAPAN: SMALL-SCALE LNG MARKET, BY TYPE, 2021–2028 (MTPA)
                                      TABLE 38 JAPAN: SMALL-SCALE LNG MARKET, BY TYPE, 2021–2028 (USD MILLION)
                                      TABLE 39 JAPAN: SMALL-SCALE LNG MARKET, BY MODE OF SUPPLY, 2021–2028 (MTPA)
                                      TABLE 40 JAPAN: SMALL-SCALE LNG MARKET, BY MODE OF SUPPLY, 2021–2028 (USD MILLION)
                                      TABLE 41 JAPAN: SMALL-SCALE LNG MARKET, BY APPLICATION, 2021–2028 (MTPA)
                                      TABLE 42 JAPAN: SMALL-SCALE LNG MARKET, BY APPLICATION, 2021–2028 (USD MILLION)
             10.2.4 INDIA
                        10.2.4.1 Growing imports of LNG and investment in power sector to drive market
                                      TABLE 43 INDIA: SMALL-SCALE LNG MARKET, BY TYPE, 2021–2028 (MTPA)
                                      TABLE 44 INDIA: SMALL-SCALE LNG MARKET, BY TYPE, 2021–2028 (USD MILLION)
                                      TABLE 45 INDIA: SMALL-SCALE LNG MARKET, BY MODE OF SUPPLY, 2021–2028 (MTPA)
                                      TABLE 46 INDIA: SMALL-SCALE LNG MARKET, BY MODE OF SUPPLY, 2021–2028 (USD MILLION)
                                      TABLE 47 INDIA: SMALL-SCALE LNG MARKET, BY APPLICATION, 2021–2028 (MTPA)
                                      TABLE 48 INDIA: SMALL-SCALE LNG MARKET, BY APPLICATION, 2021–2028 (USD MILLION)
             10.2.5 SOUTH KOREA
                        10.2.5.1 Government initiatives to shift away from coal and nuclear power as energy sources to drive market
                                      TABLE 49 SOUTH KOREA: SMALL-SCALE LNG MARKET, BY TYPE, 2021–2028 (MTPA)
                                      TABLE 50 SOUTH KOREA: SMALL-SCALE LNG MARKET, BY TYPE, 2021–2028 (USD MILLION)
                                      TABLE 51 SOUTH KOREA: SMALL-SCALE LNG MARKET, BY MODE OF SUPPLY, 2021–2028 (MTPA)
                                      TABLE 52 SOUTH KOREA: SMALL-SCALE LNG MARKET, BY MODE OF SUPPLY,  2021–2028 (USD MILLION)
                                      TABLE 53 SOUTH KOREA: SMALL-SCALE LNG MARKET, BY APPLICATION, 2021–2028 (MTPA)
                                      TABLE 54 SOUTH KOREA: SMALL-SCALE LNG MARKET, BY APPLICATION,  2021–2028 (USD MILLION)
             10.2.6 AUSTRALIA
                        10.2.6.1 Growth in LNG production and infrastructure development to drive market
                                      TABLE 55 AUSTRALIA: SMALL-SCALE LNG MARKET, BY TYPE, 2021–2028 (MTPA)
                                      TABLE 56 AUSTRALIA: SMALL-SCALE LNG MARKET, BY TYPE, 2021–2028 (USD MILLION)
                                      TABLE 57 AUSTRALIA: SMALL-SCALE LNG MARKET, BY MODE OF SUPPLY, 2021–2028 (MTPA)
                                      TABLE 58 AUSTRALIA: SMALL-SCALE LNG MARKET, BY MODE OF SUPPLY,  2021–2028 (USD MILLION)
                                      TABLE 59 AUSTRALIA: SMALL-SCALE LNG MARKET, BY APPLICATION, 2021–2028 (MTPA)
                                      TABLE 60 AUSTRALIA: SMALL-SCALE LNG MARKET, BY APPLICATION, 2021–2028 (USD MILLION)
             10.2.7 TAIWAN
                        10.2.7.1 Construction of receiving LNG terminals to drive growth
                                      TABLE 61 TAIWAN: SMALL-SCALE LNG MARKET, BY TYPE, 2021–2028 (MTPA)
                                      TABLE 62 TAIWAN: SMALL-SCALE LNG MARKET, BY TYPE, 2021–2028 (USD MILLION)
                                      TABLE 63 TAIWAN: SMALL-SCALE LNG MARKET, BY MODE OF SUPPLY, 2021–2028 (MTPA)
                                      TABLE 64 TAIWAN: SMALL-SCALE LNG MARKET, BY MODE OF SUPPLY, 2021–2028 (USD MILLION)
                                      TABLE 65 TAIWAN: SMALL-SCALE LNG MARKET, BY APPLICATION, 2021–2028 (MTPA)
                                      TABLE 66 TAIWAN: SMALL-SCALE LNG MARKET, BY APPLICATION, 2021–2028 (USD MILLION)
             10.2.8 SINGAPORE
                        10.2.8.1 Increasing demand from end-use applications to drive market
                                      TABLE 67 SINGAPORE: SMALL-SCALE LNG MARKET, BY TYPE, 2021–2028 (MTPA)
                                      TABLE 68 SINGAPORE: SMALL-SCALE LNG MARKET, BY TYPE, 2021–2028 (USD MILLION)
                                      TABLE 69 SINGAPORE: SMALL-SCALE LNG MARKET, BY MODE OF SUPPLY, 2021–2028 (MTPA)
                                      TABLE 70 SINGAPORE: SMALL-SCALE LNG MARKET, BY MODE OF SUPPLY,  2021–2028 (USD MILLION)
                                      TABLE 71 SINGAPORE: SMALL-SCALE LNG MARKET, BY APPLICATION, 2021–2028 (MTPA)
                                      TABLE 72 SINGAPORE: SMALL-SCALE LNG MARKET, BY APPLICATION, 2021–2028 (USD MILLION)
             10.2.9 INDONESIA
                        10.2.9.1 Expanding small-scale LNG infrastructure to drive market
                                      TABLE 73 INDONESIA: SMALL-SCALE LNG MARKET, BY TYPE, 2021–2028 (MTPA)
                                      TABLE 74 INDONESIA: SMALL-SCALE LNG MARKET, BY TYPE, 2021–2028 (USD MILLION)
                                      TABLE 75 INDONESIA: SMALL-SCALE LNG MARKET, BY MODE OF SUPPLY, 2021–2028 (MTPA)
                                      TABLE 76 INDONESIA: SMALL-SCALE LNG MARKET, BY MODE OF SUPPLY,  2021–2028 (USD MILLION)
                                      TABLE 77 INDONESIA: SMALL-SCALE LNG MARKET, BY APPLICATION, 2021–2028 (MTPA)
                                      TABLE 78 INDONESIA: SMALL-SCALE LNG MARKET, BY APPLICATION, 2021–2028 (USD MILLION)
             10.2.10 REST OF ASIA PACIFIC
                        TABLE 79 REST OF ASIA PACIFIC: SMALL-SCALE LNG MARKET, BY TYPE, 2021–2028 (MTPA)
                        TABLE 80 REST OF ASIA PACIFIC: SMALL-SCALE LNG MARKET, BY TYPE, 2021–2028 (USD MILLION)
                        TABLE 81 REST OF ASIA PACIFIC: SMALL-SCALE LNG MARKET, BY MODE OF SUPPLY,  2021–2028 (MTPA)
                        TABLE 82 REST OF ASIA PACIFIC: SMALL-SCALE LNG MARKET, BY MODE OF SUPPLY,  2021–2028 (USD MILLION)
                        TABLE 83 REST OF ASIA PACIFIC: SMALL-SCALE LNG MARKET, BY APPLICATION,  2021–2028 (MTPA)
                        TABLE 84 REST OF ASIA PACIFIC: SMALL-SCALE LNG MARKET, BY APPLICATION,  2021–2028 (USD MILLION)
     10.3 EUROPE 
             10.3.1 RECESSION IMPACT
                        FIGURE 31 EUROPE: SMALL-SCALE LNG MARKET SNAPSHOT
                        TABLE 85 EUROPE: SMALL-SCALE LNG MARKET, BY COUNTRY, 2021–2028 (MTPA)
                        TABLE 86 EUROPE: SMALL-SCALE LNG MARKET, BY COUNTRY, 2021–2028 (USD MILLION)
                        TABLE 87 EUROPE: SMALL-SCALE LNG MARKET, BY TYPE, 2021–2028 (MTPA)
                        TABLE 88 EUROPE: SMALL-SCALE LNG MARKET, BY TYPE, 2021–2028 (USD MILLION)
                        TABLE 89 EUROPE: SMALL-SCALE LNG MARKET, BY MODE OF SUPPLY, 2021–2028 (MTPA)
                        TABLE 90 EUROPE: SMALL-SCALE LNG MARKET, BY MODE OF SUPPLY, 2021–2028 (USD MILLION)
                        TABLE 91 EUROPE: SMALL-SCALE LNG MARKET, BY APPLICATION, 2021–2028 (MTPA)
                        TABLE 92 EUROPE: SMALL-SCALE LNG MARKET, BY APPLICATION, 2021–2028 (USD MILLION)
             10.3.2 GERMANY
                        10.3.2.1 Increasing demand for alternative fuels in transportation sector to drive market
                                      TABLE 93 GERMANY: SMALL-SCALE LNG MARKET, BY TYPE, 2021–2028 (MTPA)
                                      TABLE 94 GERMANY: SMALL-SCALE LNG MARKET, BY TYPE, 2021–2028 (USD MILLION)
                                      TABLE 95 GERMANY: SMALL-SCALE LNG MARKET, BY MODE OF SUPPLY, 2021–2028 (MTPA)
                                      TABLE 96 GERMANY: SMALL-SCALE LNG MARKET, BY MODE OF SUPPLY,  2021–2028 (USD MILLION)
                                      TABLE 97 GERMANY: SMALL-SCALE LNG MARKET, BY APPLICATION, 2021–2028 (MTPA)
                                      TABLE 98 GERMANY: SMALL-SCALE LNG MARKET, BY APPLICATION, 2021–2028 (USD MILLION)
             10.3.3 FRANCE
                        10.3.3.1 Integrating renewable energy sources into energy mix to significantly drive market
                                      TABLE 99 FRANCE: SMALL-SCALE LNG MARKET, BY TYPE, 2021–2028 (MTPA)
                                      TABLE 100 FRANCE: SMALL-SCALE LNG MARKET, BY TYPE, 2021–2028 (USD MILLION)
                                      TABLE 101 FRANCE: SMALL-SCALE LNG MARKET, BY MODE OF SUPPLY, 2021–2028 (MTPA)
                                      TABLE 102 FRANCE: SMALL-SCALE LNG MARKET, BY MODE OF SUPPLY, 2021–2028 (USD MILLION)
                                      TABLE 103 FRANCE: SMALL-SCALE LNG MARKET, BY APPLICATION, 2021–2028 (MTPA)
                                      TABLE 104 FRANCE: SMALL-SCALE LNG MARKET, BY APPLICATION, 2021–2028 (USD MILLION)
             10.3.4 ITALY
                        10.3.4.1 Growing investments in LNG infrastructure to drive market
                                      TABLE 105 ITALY: SMALL-SCALE LNG MARKET, BY TYPE, 2021–2028 (MTPA)
                                      TABLE 106 ITALY: SMALL-SCALE LNG MARKET, BY TYPE, 2021–2028 (USD MILLION)
                                      TABLE 107 ITALY: SMALL-SCALE LNG MARKET, BY MODE OF SUPPLY, 2021–2028 (MTPA)
                                      TABLE 108 ITALY: SMALL-SCALE LNG MARKET, BY MODE OF SUPPLY, 2021–2028 (USD MILLION)
                                      TABLE 109 ITALY: SMALL-SCALE LNG MARKET, BY APPLICATION, 2021–2028 (MTPA)
                                      TABLE 110 ITALY: SMALL-SCALE LNG MARKET, BY APPLICATION, 2021–2028 (USD MILLION)
             10.3.5 UK
                        10.3.5.1 Expansion of import terminals and distribution network to drive market
                                      TABLE 111 UK: SMALL-SCALE LNG MARKET, BY TYPE, 2021–2028 (MTPA)
                                      TABLE 112 UK: SMALL-SCALE LNG MARKET, BY TYPE, 2021–2028 (USD MILLION)
                                      TABLE 113 UK: SMALL-SCALE LNG MARKET, BY MODE OF SUPPLY, 2021–2028 (MTPA)
                                      TABLE 114 UK: SMALL-SCALE LNG MARKET, BY MODE OF SUPPLY, 2021–2028 (USD MILLION)
                                      TABLE 115 UK: SMALL-SCALE LNG MARKET, BY APPLICATION, 2021–2028 (MTPA)
                                      TABLE 116 UK: SMALL-SCALE LNG MARKET, BY APPLICATION, 2021–2028 (USD MILLION)
             10.3.6 RUSSIA
                        10.3.6.1 Large production of natural gas to drive market
                                      TABLE 117 RUSSIA: SMALL-SCALE LNG MARKET, BY TYPE, 2021–2028 (MTPA)
                                      TABLE 118 RUSSIA: SMALL-SCALE LNG MARKET, BY TYPE, 2021–2028 (USD MILLION)
                                      TABLE 119 RUSSIA: SMALL-SCALE LNG MARKET, BY MODE OF SUPPLY, 2021–2028 (MTPA)
                                      TABLE 120 RUSSIA: SMALL-SCALE LNG MARKET, BY MODE OF SUPPLY, 2021–2028 (USD MILLION)
                                      TABLE 121 RUSSIA: SMALL-SCALE LNG MARKET, BY APPLICATION, 2021–2028 (MTPA)
                                      TABLE 122 RUSSIA: SMALL-SCALE LNG MARKET, BY APPLICATION, 2021–2028 (USD MILLION)
             10.3.7 SPAIN
                        10.3.7.1 Government initiative for sustainable transportation to drive market
                                      TABLE 123 SPAIN: SMALL-SCALE LNG MARKET, BY TYPE, 2021–2028 (MTPA)
                                      TABLE 124 SPAIN: SMALL-SCALE LNG MARKET, BY TYPE, 2021–2028 (USD MILLION)
                                      TABLE 125 SPAIN: SMALL-SCALE LNG MARKET, BY MODE OF SUPPLY, 2021–2028 (MTPA)
                                      TABLE 126 SPAIN: SMALL-SCALE LNG MARKET, BY MODE OF SUPPLY, 2021–2028 (USD MILLION)
                                      TABLE 127 SPAIN: SMALL-SCALE LNG MARKET, BY APPLICATION, 2021–2028 (MTPA)
                                      TABLE 128 SPAIN: SMALL-SCALE LNG MARKET, BY APPLICATION, 2021–2028 (USD MILLION)
             10.3.8 PORTUGAL
                        10.3.8.1 Government initiatives to diversify energy mix to offer opportunities for players
                                      TABLE 129 PORTUGAL: SMALL-SCALE LNG MARKET, BY TYPE, 2021–2028 (MTPA)
                                      TABLE 130 PORTUGAL: SMALL-SCALE LNG MARKET, BY TYPE, 2021–2028 (USD MILLION)
                                      TABLE 131 PORTUGAL: SMALL-SCALE LNG MARKET, BY MODE OF SUPPLY, 2021–2028 (MTPA)
                                      TABLE 132 PORTUGAL: SMALL-SCALE LNG MARKET, BY MODE OF SUPPLY,  2021–2028 (USD MILLION)
                                      TABLE 133 PORTUGAL: SMALL-SCALE LNG MARKET, BY APPLICATION, 2021–2028 (MTPA)
                                      TABLE 134 PORTUGAL: SMALL-SCALE LNG MARKET, BY APPLICATION, 2021–2028 (USD MILLION)
             10.3.9 NETHERLANDS
                        10.3.9.1 Strategic location and well-established maritime connections to drive market
                                      TABLE 135 NETHERLANDS: SMALL-SCALE LNG MARKET, BY TYPE, 2021–2028 (MTPA)
                                      TABLE 136 NETHERLANDS: SMALL-SCALE LNG MARKET, BY TYPE, 2021–2028 (USD MILLION)
                                      TABLE 137 NETHERLANDS: SMALL-SCALE LNG MARKET, BY MODE OF SUPPLY, 2021–2028 (MTPA)
                                      TABLE 138 NETHERLANDS: SMALL-SCALE LNG MARKET, BY MODE OF SUPPLY,  2021–2028 (USD MILLION)
                                      TABLE 139 NETHERLANDS: SMALL-SCALE LNG MARKET, BY APPLICATION, 2021–2028 (MTPA)
                                      TABLE 140 NETHERLANDS: SMALL-SCALE LNG MARKET, BY APPLICATION,  2021–2028 (USD MILLION)
             10.3.10 TURKEY
                        10.3.10.1 Government initiative to diversify energy sources and reduce dependence on imported oil to drive market
                                      TABLE 141 TURKEY: SMALL-SCALE LNG MARKET, BY TYPE, 2021–2028 (MTPA)
                                      TABLE 142 TURKEY: SMALL-SCALE LNG MARKET, BY TYPE, 2021–2028 (USD MILLION)
                                      TABLE 143 TURKEY: SMALL-SCALE LNG MARKET, BY MODE OF SUPPLY, 2021–2028 (MTPA)
                                      TABLE 144 TURKEY: SMALL-SCALE LNG MARKET, BY MODE OF SUPPLY, 2021–2028 (USD MILLION)
                                      TABLE 145 TURKEY: SMALL-SCALE LNG MARKET, BY APPLICATION, 2021–2028 (MTPA)
                                      TABLE 146 TURKEY: SMALL-SCALE LNG MARKET, BY APPLICATION, 2021–2028 (USD MILLION)
             10.3.11 REST OF EUROPE
                        TABLE 147 REST OF EUROPE: SMALL-SCALE LNG MARKET, BY TYPE, 2021–2028 (MTPA)
                        TABLE 148 REST OF EUROPE: SMALL-SCALE LNG MARKET, BY TYPE, 2021–2028 (USD MILLION)
                        TABLE 149 REST OF EUROPE: SMALL-SCALE LNG MARKET, BY MODE OF SUPPLY,  2021–2028 (MTPA)
                        TABLE 150 REST OF EUROPE: SMALL-SCALE LNG MARKET, BY MODE OF SUPPLY,  2021–2028 (USD MILLION)
                        TABLE 151 REST OF EUROPE: SMALL-SCALE LNG MARKET, BY APPLICATION, 2021–2028 (MTPA)
                        TABLE 152 REST OF EUROPE: SMALL-SCALE LNG MARKET, BY APPLICATION,  2021–2028 (USD MILLION)
     10.4 NORTH AMERICA 
             10.4.1 RECESSION IMPACT
                        FIGURE 32 NORTH AMERICA: SMALL-SCALE LNG MARKET SNAPSHOT
                        TABLE 153 NORTH AMERICA: SMALL-SCALE LNG MARKET, BY COUNTRY, 2021–2028 (MTPA)
                        TABLE 154 NORTH AMERICA: SMALL-SCALE LNG MARKET, BY COUNTRY, 2021–2028 (USD MILLION)
                        TABLE 155 NORTH AMERICA: SMALL-SCALE LNG MARKET, BY TYPE, 2021–2028 (MTPA)
                        TABLE 156 NORTH AMERICA: SMALL-SCALE LNG MARKET, BY TYPE, 2021–2028 (USD MILLION)
                        TABLE 157 NORTH AMERICA: SMALL-SCALE LNG MARKET, BY MODE OF SUPPLY, 2021–2028 (MTPA)
                        TABLE 158 NORTH AMERICA: SMALL-SCALE LNG MARKET, BY MODE OF SUPPLY,  2021–2028 (USD MILLION)
                        TABLE 159 NORTH AMERICA: SMALL-SCALE LNG MARKET, BY APPLICATION, 2021–2028 (MTPA)
                        TABLE 160 NORTH AMERICA: SMALL-SCALE LNG MARKET, BY APPLICATION,  2021–2028 (USD MILLION)
             10.4.2 US
                        10.4.2.1 Emergence of shale gas and increasing natural gas consumption to drive market
                                      TABLE 161 US: SMALL-SCALE LNG MARKET, BY TYPE, 2021–2028 (MTPA)
                                      TABLE 162 US: SMALL-SCALE LNG MARKET, BY TYPE, 2021–2028 (USD MILLION)
                                      TABLE 163 US: SMALL-SCALE LNG MARKET, BY MODE OF SUPPLY, 2021–2028 (MTPA)
                                      TABLE 164 US: SMALL-SCALE LNG MARKET, BY MODE OF SUPPLY, 2021–2028 (USD MILLION)
                                      TABLE 165 US: SMALL-SCALE LNG MARKET, BY APPLICATION, 2021–2028 (MTPA)
                                      TABLE 166 US: SMALL-SCALE LNG MARKET, BY APPLICATION, 2021–2028 (USD MILLION)
             10.4.3 CANADA
                        10.4.3.1 Growing heavy-duty transport facilities to drive market
                                      TABLE 167 CANADA: SMALL-SCALE LNG MARKET, BY TYPE, 2021–2028 (MTPA)
                                      TABLE 168 CANADA: SMALL-SCALE LNG MARKET, BY TYPE, 2021–2028 (USD MILLION)
                                      TABLE 169 CANADA: SMALL-SCALE LNG MARKET, BY MODE OF SUPPLY, 2021–2028 (MTPA)
                                      TABLE 170 CANADA: SMALL-SCALE LNG MARKET, BY MODE OF SUPPLY, 2021–2028 (USD MILLION)
                                      TABLE 171 CANADA: SMALL-SCALE LNG MARKET, BY APPLICATION, 2021–2028 (MTPA)
                                      TABLE 172 CANADA: SMALL-SCALE LNG MARKET, BY APPLICATION, 2021–2028 (USD MILLION)
             10.4.4 MEXICO
                        10.4.4.1 Promotion of domestic natural gas production and infrastructure development to drive growth
                                      TABLE 173 MEXICO: SMALL-SCALE LNG MARKET, BY TYPE, 2021–2028 (MTPA)
                                      TABLE 174 MEXICO: SMALL-SCALE LNG MARKET, BY TYPE, 2021–2028 (USD MILLION)
                                      TABLE 175 MEXICO: SMALL-SCALE LNG MARKET, BY MODE OF SUPPLY, 2021–2028 (MTPA)
                                      TABLE 176 MEXICO: SMALL-SCALE LNG MARKET, BY MODE OF SUPPLY, 2021–2028 (USD MILLION)
                                      TABLE 177 MEXICO: SMALL-SCALE LNG MARKET, BY APPLICATION, 2021–2028 (MTPA)
                                      TABLE 178 MEXICO: SMALL-SCALE LNG MARKET, BY APPLICATION, 2021–2028 (USD MILLION)
     10.5 MIDDLE EAST & AFRICA 
             TABLE 179 MIDDLE EAST & AFRICA: SMALL-SCALE LNG MARKET, BY COUNTRY, 2021–2028 (MTPA)
             TABLE 180 MIDDLE EAST & AFRICA: SMALL-SCALE LNG MARKET, BY COUNTRY,  2021–2028 (USD MILLION)
             TABLE 181 MIDDLE EAST & AFRICA: SMALL-SCALE LNG MARKET, BY TYPE, 2021–2028 (MTPA)
             TABLE 182 MIDDLE EAST & AFRICA: SMALL-SCALE LNG MARKET, BY TYPE,  2021–2028 (USD MILLION)
             TABLE 183 MIDDLE EAST & AFRICA: SMALL-SCALE LNG MARKET, BY MODE OF SUPPLY,  2021–2028 (MTPA)
             TABLE 184 MIDDLE EAST & AFRICA: SMALL-SCALE LNG MARKET, BY MODE OF SUPPLY,  2021–2028 (USD MILLION)
             TABLE 185 MIDDLE EAST & AFRICA: SMALL-SCALE LNG MARKET, BY APPLICATION,  2021–2028 (MTPA)
             TABLE 186 MIDDLE EAST & AFRICA: SMALL-SCALE LNG MARKET, BY APPLICATION,  2021–2028 (USD MILLION)
             10.5.1 RECESSION IMPACT
             10.5.2 QATAR
                        10.5.2.1 Huge exports of natural gas to drive market
                                      TABLE 187 QATAR: SMALL-SCALE LNG MARKET, BY TYPE, 2021–2028 (MTPA)
                                      TABLE 188 QATAR: SMALL-SCALE LNG MARKET, BY TYPE, 2021–2028 (USD MILLION)
                                      TABLE 189 QATAR: SMALL-SCALE LNG MARKET, BY MODE OF SUPPLY, 2021–2028 (MTPA)
                                      TABLE 190 QATAR: SMALL-SCALE LNG MARKET, BY MODE OF SUPPLY, 2021–2028 (USD MILLION)
                                      TABLE 191 QATAR: SMALL-SCALE LNG MARKET, BY APPLICATION, 2021–2028 (MTPA)
                                      TABLE 192 QATAR: SMALL-SCALE LNG MARKET, BY APPLICATION, 2021–2028 (USD MILLION)
             10.5.3 ISRAEL
                        10.5.3.1 Geographic location and energy need to drive market
                                      TABLE 193 ISRAEL: SMALL-SCALE LNG MARKET, BY TYPE, 2021–2028 (MTPA)
                                      TABLE 194 ISRAEL: SMALL-SCALE LNG MARKET, BY TYPE, 2021–2028 (USD MILLION)
                                      TABLE 195 ISRAEL: SMALL-SCALE LNG MARKET, BY MODE OF SUPPLY, 2021–2028 (MTPA)
                                      TABLE 196 ISRAEL: SMALL-SCALE LNG MARKET, BY MODE OF SUPPLY, 2021–2028 (USD MILLION)
                                      TABLE 197 ISRAEL: SMALL-SCALE LNG MARKET, BY APPLICATION, 2021–2028 (MTPA)
                                      TABLE 198 ISRAEL: SMALL-SCALE LNG MARKET, BY APPLICATION, 2021–2028 (USD MILLION)
             10.5.4 UAE
                        10.5.4.1 Strategic location as a major logistics and trade hub in Middle East to drive market
                                      TABLE 199 UAE: SMALL-SCALE LNG MARKET, BY TYPE, 2021–2028 (MTPA)
                                      TABLE 200 UAE: SMALL-SCALE LNG MARKET, BY TYPE, 2021–2028 (USD MILLION)
                                      TABLE 201 UAE: SMALL-SCALE LNG MARKET, BY MODE OF SUPPLY, 2021–2028 (MTPA)
                                      TABLE 202 UAE: SMALL-SCALE LNG MARKET, BY MODE OF SUPPLY, 2021–2028 (USD MILLION)
                                      TABLE 203 UAE: SMALL-SCALE LNG MARKET, BY APPLICATION, 2021–2028 (MTPA)
                                      TABLE 204 UAE: SMALL-SCALE LNG MARKET, BY APPLICATION, 2021–2028 (USD MILLION)
             10.5.5 SOUTH AFRICA
                        10.5.5.1 Substantial natural gas resources to drive market
                                      TABLE 205 SOUTH AFRICA: SMALL-SCALE LNG MARKET, BY TYPE, 2021–2028 (MTPA)
                                      TABLE 206 SOUTH AFRICA: SMALL-SCALE LNG MARKET, BY TYPE, 2021–2028 (USD MILLION)
                                      TABLE 207 SOUTH AFRICA: SMALL-SCALE LNG MARKET, BY MODE OF SUPPLY, 2021–2028 (MTPA)
                                      TABLE 208 SOUTH AFRICA: SMALL-SCALE LNG MARKET, BY MODE OF SUPPLY,  2021–2028 (USD MILLION)
                                      TABLE 209 SOUTH AFRICA: SMALL-SCALE LNG MARKET, BY APPLICATION, 2021–2028 (MTPA)
                                      TABLE 210 SOUTH AFRICA: SMALL-SCALE LNG MARKET, BY APPLICATION,  2021–2028 (USD MILLION)
             10.5.6 REST OF MIDDLE EAST & AFRICA
                        TABLE 211 REST OF MIDDLE EAST & AFRICA: SMALL-SCALE LNG MARKET, BY TYPE,  2021–2028 (MTPA)
                        TABLE 212 REST OF MIDDLE EAST & AFRICA: SMALL-SCALE LNG MARKET, BY TYPE,  2021–2028 (USD MILLION)
                        TABLE 213 REST OF MIDDLE EAST & AFRICA: SMALL-SCALE LNG MARKET, BY MODE OF SUPPLY, 2021–2028 (MTPA)
                        TABLE 214 REST OF MIDDLE EAST & AFRICA: SMALL-SCALE LNG MARKET, BY MODE OF SUPPLY, 2021–2028 (USD MILLION)
                        TABLE 215 REST OF MIDDLE EAST & AFRICA: SMALL-SCALE LNG MARKET, BY APPLICATION,  2021–2028 (MTPA)
                        TABLE 216 REST OF MIDDLE EAST & AFRICA: SMALL-SCALE LNG MARKET, BY APPLICATION,  2021–2028 (USD MILLION)
     10.6 SOUTH AMERICA 
             TABLE 217 SOUTH AMERICA: SMALL-SCALE LNG MARKET, BY COUNTRY, 2021–2028 (MTPA)
             TABLE 218 SOUTH AMERICA: SMALL-SCALE LNG MARKET, BY COUNTRY, 2021–2028 (USD MILLION)
             TABLE 219 SOUTH AMERICA: SMALL-SCALE LNG MARKET, BY TYPE, 2021–2028 (MTPA)
             TABLE 220 SOUTH AMERICA: SMALL-SCALE LNG MARKET, BY TYPE, 2021–2028 (USD MILLION)
             TABLE 221 SOUTH AMERICA: SMALL-SCALE LNG MARKET, BY MODE OF SUPPLY, 2021–2028 (MTPA)
             TABLE 222 SOUTH AMERICA: SMALL-SCALE LNG MARKET, BY MODE OF SUPPLY,  2021–2028 (USD MILLION)
             TABLE 223 SOUTH AMERICA: SMALL-SCALE LNG MARKET, BY APPLICATION, 2021–2028 (MTPA)
             TABLE 224 SOUTH AMERICA: SMALL-SCALE LNG MARKET, BY APPLICATION,  2021–2028 (USD MILLION)
             10.6.1 RECESSION IMPACT
             10.6.2 BRAZIL
                        10.6.2.1 Improved economy to drive market
                                      TABLE 225 BRAZIL: SMALL-SCALE LNG MARKET, BY TYPE, 2021–2028 (MTPA)
                                      TABLE 226 BRAZIL: SMALL-SCALE LNG MARKET, BY TYPE, 2021–2028 (USD MILLION)
                                      TABLE 227 BRAZIL: SMALL-SCALE LNG MARKET, BY MODE OF SUPPLY, 2021–2028 (MTPA)
                                      TABLE 228 BRAZIL: SMALL-SCALE LNG MARKET, BY MODE OF SUPPLY, 2021–2028 (USD MILLION)
                                      TABLE 229 BRAZIL: SMALL-SCALE LNG MARKET, BY APPLICATION, 2021–2028 (MTPA)
                                      TABLE 230 BRAZIL: SMALL-SCALE LNG MARKET, BY APPLICATION, 2021–2028 (USD MILLION)
             10.6.3 ARGENTINA
                        10.6.3.1 Increased investment in LNG terminal infrastructure to drive market
                                      TABLE 231 ARGENTINA: SMALL-SCALE LNG MARKET, BY TYPE, 2021–2028 (MTPA)
                                      TABLE 232 ARGENTINA: SMALL-SCALE LNG MARKET, BY TYPE, 2021–2028 (USD MILLION)
                                      TABLE 233 ARGENTINA: SMALL-SCALE LNG MARKET, BY MODE OF SUPPLY, 2021–2028 (MTPA)
                                      TABLE 234 ARGENTINA: SMALL-SCALE LNG MARKET, BY MODE OF SUPPLY,  2021–2028 (USD MILLION)
                                      TABLE 235 ARGENTINA: SMALL-SCALE LNG MARKET, BY APPLICATION, 2021–2028 (MTPA)
                                      TABLE 236 ARGENTINA: SMALL-SCALE LNG MARKET, BY APPLICATION, 2021–2028 (USD MILLION)
             10.6.4 CHILE
                        10.6.4.1 Increased application in heavy-duty vehicles to drive market
                                      TABLE 237 CHILE: SMALL-SCALE LNG MARKET, BY TYPE, 2021–2028 (MTPA)
                                      TABLE 238 CHILE: SMALL-SCALE LNG MARKET, BY TYPE, 2021–2028 (USD MILLION)
                                      TABLE 239 CHILE: SMALL-SCALE LNG MARKET, BY MODE OF SUPPLY, 2021–2028 (MTPA)
                                      TABLE 240 CHILE: SMALL-SCALE LNG MARKET, BY MODE OF SUPPLY, 2021–2028 (USD MILLION)
                                      TABLE 241 CHILE: SMALL-SCALE LNG MARKET, BY APPLICATION, 2021–2028 (MTPA)
                                      TABLE 242 CHILE: SMALL-SCALE LNG MARKET, BY APPLICATION, 2021–2028 (USD MILLION)
             10.6.5 REST OF SOUTH AMERICA
                        TABLE 243 REST OF SOUTH AMERICA: SMALL-SCALE LNG MARKET, BY TYPE, 2021–2028 (MTPA)
                        TABLE 244 REST OF SOUTH AMERICA: SMALL-SCALE LNG MARKET, BY TYPE,  2021–2028 (USD MILLION)
                        TABLE 245 REST OF SOUTH AMERICA: SMALL-SCALE LNG MARKET, BY MODE OF SUPPLY,  2021–2028 (MTPA)
                        TABLE 246 REST OF SOUTH AMERICA: SMALL-SCALE LNG MARKET, BY MODE OF SUPPLY,  2021–2028 (USD MILLION)
                        TABLE 247 REST OF SOUTH AMERICA: SMALL-SCALE LNG MARKET, BY APPLICATION,  2021–2028 (MTPA)
                        TABLE 248 REST OF SOUTH AMERICA: SMALL-SCALE LNG MARKET, BY APPLICATION,  2021–2028 (USD MILLION)
 
11 COMPETITIVE LANDSCAPE (Page No. - 199)
     11.1 OVERVIEW 
             TABLE 249 STRATEGIES ADOPTED BY KEY PLAYERS DURING FORECAST PERIOD
     11.2 REVENUE ANALYSIS OF KEY PLAYERS 
             FIGURE 33 REVENUE ANALYSIS OF KEY COMPANIES IN SMALL-SCALE LNG  MARKET
     11.3 MARKET SHARE ANALYSIS 
             FIGURE 34 SHARES OF TOP COMPANIES IN SMALL–SCALE LNG MARKET
     11.4 COMPANY EVALUATION QUADRANT 
             11.4.1 STARS
             11.4.2 EMERGING LEADERS
             11.4.3 PARTICIPANTS
             11.4.4 PERVASIVE PLAYERS
                        FIGURE 35 COMPETITIVE LEADERSHIP MAPPING: SMALL-SCALE LNG  MARKET, 2022
     11.5 STARTUP/SME EVALUATION QUADRANT 
             11.5.1 PROGRESSIVE COMPANIES
             11.5.2 RESPONSIVE COMPANIES
             11.5.3 DYNAMIC COMPANIES
             11.5.4 STARTING BLOCKS
                        FIGURE 36 SME MATRIX: SMALL-SCALE LNG MARKET, 2022
     11.6 COMPETITIVE BENCHMARKING 
             TABLE 250 SMALL-SCALE LNG MARKET: KEY PLAYERS
             TABLE 251 SMALL-SCALE LNG MARKET: COMPETITIVE BENCHMARKING OF KEY PLAYERS,  BY APPLICATION
             TABLE 252 SMALL-SCALE LNG MARKET: COMPETITIVE BENCHMARKING OF  KEY PLAYERS, BY REGION
     11.7 COMPETITIVE SCENARIO 
             11.7.1 DEALS
                        TABLE 253 DEALS, 2018–2023
             11.7.2 PRODUCT/SERVICE LAUNCHES
                        TABLE 254 PRODUCT/SERVICE LAUNCHES, 2018–2023
 
12 COMPANY PROFILES (Page No. - 219)
(Business Overview, Products Offered, Recent Developments, MnM View Right to win, Strategic choices made, Weaknesses and competitive threats) *
     12.1 KEY PLAYERS 
             12.1.1 LINDE PLC
                        TABLE 255 LINDE PLC: COMPANY OVERVIEW
                        FIGURE 37 LINDE PLC: COMPANY SNAPSHOT
                        TABLE 256 LINDE PLC: DEALS
             12.1.2 WARTSILA CORPORATION
                        TABLE 257 WARTSILA CORPORATION: COMPANY OVERVIEW
                        FIGURE 38 WARTSILA CORPORATION: COMPANY SNAPSHOT
                        TABLE 258 WARTSILA CORPORATION: DEALS
             12.1.3 HONEYWELL INTERNATIONAL INC.
                        TABLE 259 HONEYWELL INTERNATIONAL INC.: BUSINESS OVERVIEW
                        FIGURE 39 HONEYWELL INTERNATIONAL INC.: COMPANY SNAPSHOT
             12.1.4 ENGIE S.A.
                        TABLE 260 ENGIE S.A.: COMPANY OVERVIEW
                        FIGURE 40 ENGIE S.A.: COMPANY SNAPSHOT
                        TABLE 261 ENGIE S.A.: DEALS
                        TABLE 262 ENGIE S.A.: PRODUCT/SERVICE LAUNCHES
             12.1.5 SHELL PLC
                        TABLE 263 SHELL PLC.: COMPANY OVERVIEW
                        FIGURE 41 SHELL PLC: COMPANY SNAPSHOT
                        TABLE 264 SHELL PLC: DEALS
                        TABLE 265 SHELL PLC: OTHERS
                        TABLE 266 SHELL PLC: PRODUCT/SERVICE LAUNCHES
             12.1.6 GASUM OY
                        TABLE 267 GASUM OY: COMPANY OVERVIEW
                        FIGURE 42 GASUM OY: COMPANY SNAPSHOT
                        TABLE 268 GASUM OY: DEALS
                        TABLE 269 GASUM OY: OTHERS
             12.1.7 CHART INDUSTRIES, INC.
                        TABLE 270 CHART INDUSTRIES, INC.: COMPANY OVERVIEW
                        FIGURE 43 CHART INDUSTRIES, INC.: COMPANY SNAPSHOT
                        TABLE 271 CHART INDUSTRIES, INC.: DEALS
                        TABLE 272 CHART INDUSTRIES, INC.: OTHERS
             12.1.8 AIR PRODUCTS AND CHEMICALS, INC.
                        TABLE 273 AIR PRODUCTS AND CHEMICALS, INC.: COMPANY OVERVIEW
                        FIGURE 44 AIR PRODUCTS AND CHEMICALS, INC.: COMPANY SNAPSHOT
                        TABLE 274 AIR PRODUCTS AND CHEMICALS, INC.: DEALS
             12.1.9 EXCELERATE ENERGY, INC
                        TABLE 275 EXCELERATE ENERGY, INC.: COMPANY OVERVIEW
                        FIGURE 45 EXCELERATE ENERGY, INC.: COMPANY SNAPSHOT
                        TABLE 276 EXCELERATE ENERGY, INC.: DEALS
             12.1.10 SOFREGAZ
                        TABLE 277 SOFREGAZ: COMPANY OVERVIEW
     12.2 OTHER PLAYERS 
             12.2.1 PLUM ENERGY
                        TABLE 278 PLUM ENERGY: COMPANY OVERVIEW
             12.2.2 STABILIS ENERGY
                        TABLE 279 STABILIS ENERGY: COMPANY OVERVIEW
             12.2.3 NIKKISO’S CLEAN ENERGY & INDUSTRIAL GASES GROUP
                        TABLE 280 NIKKISO’S CLEAN ENERGY & INDUSTRIAL GASES GROUP: COMPANY OVERVIEW
             12.2.4 SNAM S.P.A.
                        TABLE 281 SNAM S.P.A.: COMPANY OVERVIEW
             12.2.5 BAKER HUGHES CO.
                        TABLE 282 BAKER HUGHES CO.: COMPANY OVERVIEW
             12.2.6 GASNORE
                        TABLE 283 GASNORE: COMPANY OVERVIEW
             12.2.7 PETRONET LNG LIMITED
                        TABLE 284 PETRONET LNG LIMITED: COMPANY OVERVIEW
             12.2.8 HANGZHOU FORTUNE GAS CRYOGENIC GROUP CO., LTD
                        TABLE 285 HANGZHOU FORTUNE GAS CRYOGENIC GROUP CO., LTD: COMPANY OVERVIEW
             12.2.9 BLACK & VEATCH HOLDING COMPANY
                        TABLE 286 BLACK & VEATCH HOLDING COMPANY: COMPANY OVERVIEW
             12.2.10 PGNIG SA
                        TABLE 287 PGNIG SA: COMPANY OVERVIEW
             12.2.11 SCALE GAS SOLUTIONS
                        TABLE 288 SCALE GAS SOLUTIONS: COMPANY OVERVIEW
             12.2.12 PILOT LNG LLC
                        TABLE 289 PILOT LNG LLC: COMPANY OVERVIEW
             12.2.13 ANTHONY VEDER
                        TABLE 290 ANTHONY VEDER: COMPANY OVERVIEW
             12.2.14 MCDERMOTT
                        TABLE 291 MCDERMOTT: COMPANY OVERVIEW
             12.2.15 KC LNG
                        TABLE 292 KC LNG.: COMPANY OVERVIEW
 
*Details on Business Overview, Products Offered, Recent Developments, MnM View, Right to win, Strategic choices made, Weaknesses and competitive threats might not be captured in case of unlisted companies.
 
13 ADJACENT & RELATED MARKET (Page No. - 277)
     13.1 INTRODUCTION 
     13.2 LIMITATIONS 
     13.3 LNG STORAGE TANK 
             13.3.1 MARKET DEFINITION
             13.3.2 MARKET OVERVIEW
     13.4 LNG STORAGE TANK MARKET, BY TYPE 
             TABLE 293 LNG STORAGE TANK MARKET, BY TYPE, 2020–2027 (USD MILLION)
             TABLE 294 LNG STORAGE TANK MARKET, BY TYPE, 2020–2027 (MILLION SQUARE METER)
     13.5 LNG STORAGE TANKMARKET, BY MATERIAL 
             TABLE 295 LNG STORAGE TANK MARKET, BY MATERIAL, 2020–2027 (USD MILLION)
             TABLE 296 LNG STORAGE TANK MARKET, BY MATERIAL, 2020–2027 (MILLION SQUARE METERS)
     13.6 LNG STORAGE TANK MARKET, BY REGION 
             TABLE 297 LNG STORAGE TANK MARKET, BY REGION, 2020–2027 (USD MILLION)
             TABLE 298 LNG STORAGE TANK MARKET, BY REGION, 2020–2027 (MILLION SQUARE METERS)
 
14 APPENDIX (Page No. - 281)
     14.1 DISCUSSION GUIDE 
     14.2 KNOWLEDGESTORE: MARKETSANDMARKETS’  SUBSCRIPTION PORTAL 
     14.3 CUSTOMIZATION OPTIONS 
     14.4 RELATED REPORTS 
     14.5 AUTHOR DETAILS 

Extensive secondary sources, directories, and databases such as Hoovers, Bloomberg BusinessWeek, Factiva, and OneSource have been used to identify and collect information for this technical, market-oriented, and commercial study of the small-scale LNG market. In-depth interviews were conducted with various primary respondents which included key industry participants, subject matter experts (SMEs), C-level executives of key industry players, and industry consultants, among other experts, to obtain and verify critical qualitative and quantitative information and to assess prospects.

Secondary Research

In the secondary research process, various secondary sources have been referred to for identifying and collecting information for this study. Secondary sources included annual reports, press releases, and investor presentations of companies; white papers; publications from recognized websites; and databases. Secondary research has mainly been used to obtain key information about the supply chain of the industry, the total pool of key players, market classification & segmentation according to the industry trends to the bottom-most level, regional markets, and key developments from both, market- and technology-oriented perspectives.

The market size of small-scale LNG has been estimated based on secondary data available through paid and unpaid sources, and by analyzing the product portfolios of key companies. This data has been further validated through various primary sources.

Primary Research

The small-scale LNG market comprises various stakeholders in the supply chain and includes suppliers, manufacturers, and end-product manufacturers. Various primary sources from the supply and demand sides of the small-scale LNG market have been interviewed to obtain qualitative and quantitative information. Primary participants from the supply side include key opinion leaders, executives, vice presidents, and CEOs of companies in the market. Primary sources from the demand side include experts from end-use industries, associations, and institutions involved in the market, and key opinion leaders.

Following is the breakdown of primary respondents
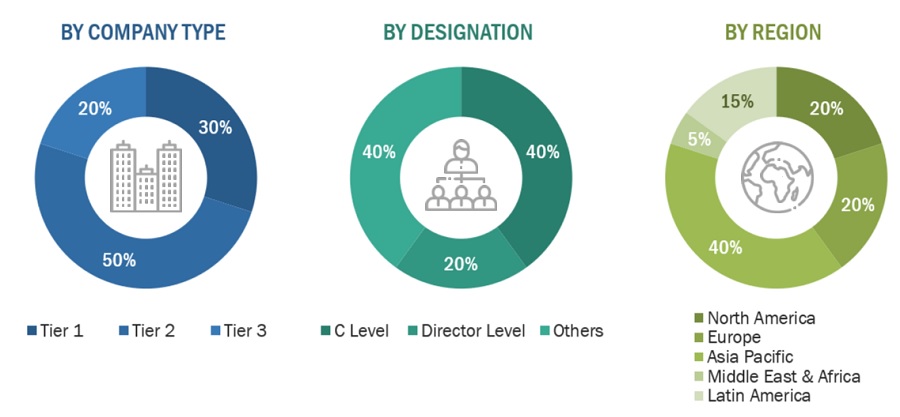
Small-Scale LNG Market Size, and Share

Notes: *Others include sales, marketing, and product managers.

Tier 1: >USD 5 Billion; Tier 2: USD 1 Billion– USD 5 Billion; and Tier 3: <USD 1 Billion.

To know about the assumptions considered for the study, download the pdf brochure

Market Size Estimation

The supply-side and demand-side approaches have been extensively used, along with several data triangulation methods, for market size estimation and forecast of the overall market segments listed in this report. Extensive qualitative and quantitative data were analyzed to list key information/insights throughout the report. The research methodology used to estimate the market size includes the following:

  • The key players in the industry were identified through extensive secondary research.
  • The supply chain of the industry and market size, in terms of value, were determined through primary and secondary research.
  • All percentage shares split, and breakdowns were determined using secondary sources and verified through primary sources.
  • All possible parameters that affect the markets covered in this research study were accounted for, viewed in extensive detail, verified through primary research, and analyzed to obtain the final quantitative and qualitative data.
  • The research includes the study of annual reports, reviews, small-scale LNG associations, and newsletters of key industry players along with extensive interviews with key officials, such as directors and marketing executives.

Global Small-scale LNG Market: Top-Down Approach

Small-Scale LNG Market Size, and Share

To know about the assumptions considered for the study, Request for Free Sample Report

Global Small-scale LNG Market: Bottom-Up Approach

Small-Scale LNG Market Size, and Share

Data Triangulation

After arriving at the overall market size, the total market was split into several segments and subsegments. To complete the overall market estimation process and arrive at the exact statistics for all the segments and subsegments, data triangulation and market breakdown procedures were employed, wherever applicable. Data was triangulated by studying various factors and trends from both the demand and supply sides.

Market Definition

Small-scale LNG (SSLNG) refers to the liquefaction, regasification, and import terminals found in plants with a capacity of less than 1 million tons per annum (MTPA), as defined by the International Gas Union (IGU). These facilities have various applications, including power generation, transportation, industrial feedstock, and other uses. In terms of transportation, SSLNG carriers are specifically described as vessels with LNG storage capacities below 30,000 cubic meters (m³). The typical range of SSLNG storage capacity falls between 500 m³ and 5,000 m³. SSLNG infrastructure also includes LNG bunkering facilities for vessels that use LNG as fuel, LNG satellite stations, and infrastructure for supplying LNG as a fuel for road vehicles.

Key stakeholders

  • Manufacturers of devices and equipment used in small-scale LNG manufacturing plants
  • Manufacturers of LNG storage tanks
  • Traders and distributors of small-scale LNG
  • Regional manufacturers’ associations and general small-scale LNG associations
  • Government and regional agencies and research organizations
  • LNG industry associations
  • Natural gas suppliers

Report Objectives

  • To define, describe, and forecast the size of the small-scale LNG market in terms of value and volume
  • To provide information about the factors (drivers, restraints, opportunities, and industry-specific challenges) influencing the growth of the market
  • To forecast and analyze the market based on type, product type,straw length, straw diameter, material type and end-use
  • To analyze and forecast the market size with respect to five main regions, namely, Asia Pacific, North America, Europe, South America, and Rest of the World, along with their respective key countries
  • To analyze competitive developments such as mergers & acquisitions, joint ventures, and investments & expansions in the market
  • To analyze opportunities in the market for stakeholders and provide a detailed competitive landscape of the market leaders
  • To strategically profile the key players in the market and comprehensively analyze their core competencies

Available Customizations:

Along with the given market data, MarketsandMarkets offers customizations as per the specific needs of the companies. The following customization options are available for the report:

Product Analysis:

  • Product Matrix which gives a detailed comparison of the product portfolio of each company

Regional Analysis:

  • Further breakdown of the Rest of APAC Small-scale LNG Market
  • Further breakdown of Rest of Europe Small-scale LNG Market
  • Further breakdown of Rest of South America Small-scale LNG Market
  • Further breakdown of Rest of Middle East & Africa Small-scale LNG Market

Company Information:

  • Detailed analysis and profiling of additional market players (up to 5)
Custom Market Research Services

We will customize the research for you, in case the report listed above does not meet with your exact requirements. Our custom research will comprehensively cover the business information you require to help you arrive at strategic and profitable business decisions.

Request Customization
Report Code
CH 5185
Published ON
Aug, 2023
Choose License Type
BUY NOW
  • SHARE
X
Request Customization
Speak to Analyst
Speak to Analyst
OR FACE-TO-FACE MEETING
PERSONALIZE THIS RESEARCH
  • Triangulate with your Own Data
  • Get Data as per your Format and Definition
  • Gain a Deeper Dive on a Specific Application, Geography, Customer or Competitor
  • Any level of Personalization
REQUEST A FREE CUSTOMIZATION
LET US HELP YOU!
  • What are the Known and Unknown Adjacencies Impacting the Small-Scale LNG Market
  • What will your New Revenue Sources be?
  • Who will be your Top Customer; what will make them switch?
  • Defend your Market Share or Win Competitors
  • Get a Scorecard for Target Partners
CUSTOMIZED WORKSHOP REQUEST
+1-888-600-6441
  • Call Us
  • +1-888-600-6441 (Corporate office hours)
  • +1-888-600-6441 (US/Can toll free)
  • +44-800-368-9399 (UK office hours)
CONNECT WITH US
ABOUT TRUST ONLINE
©2024 MarketsandMarkets Research Private Ltd. All rights reserved
DMCA.com Protection Status Website Feedback