Smart Coatings Market by Function (Anti-Corrosion, Anti-Icing, Anti-Microbial, Anti-Fouling, Self-Healing, Self-Cleaning), Layer (Single, Multi), End-Use (Automotive & Transportation, Aerospace & Defense, Marine), and Region - Global Forecast to 2022


Smart Coatings Market Size And Forecast
The smart coatings market is projected to reach USD 6.27 Billion by 2022, at a CAGR of 23.87%. The market growth is driven by the rise in demand for smart coatings from end-use industries, such as automotive & transportation, aerospace & defense, and marine. Base year considered for the study is 2016, while the forecast period is between 2017 and 2022.
Smart Coatings Market Report Objectives of the Study
- To analyze and forecast the size of the global smart coatings market, in terms of both value and volume
- To provide detailed information about the key factors (drivers, restraints, opportunities, and challenges) influencing the growth of the market
- To define, describe, and forecast the market on the basis of function, layer, and end-use industry
- To analyze and forecast the smart coating market on the basis of key regions, such as North America, Europe, Asia Pacific (APAC), the Middle East & Africa, and South America.
- To strategically analyze micromarkets with respect to individual growth trends, prospects, and their contribution to the overall market
- To analyze the opportunities in the market for stakeholders and provide competitive landscape for market leaders
- To analyze competitive developments, such as new product development, expansion, and acquisition in the smart coatings market
- To strategically profile the key players and comprehensively analyze their market share and core competencies
Smart Coatings Market Research Methodology
Top-down and bottom-up approaches have been used to estimate and validate the size of the global market and various other dependent submarkets in the overall smart coating market. The research study involved the use of extensive secondary sources, directories, and databases, such as Hoovers, Bloomberg, Chemical Weekly, Factiva, and other government and private websites to identify and collect information useful for the technical, market-oriented, and commercial study of the smart coatings market.
To know about the assumptions considered for the study, download the pdf brochure
Key Players in Smart Coatings Market
Some of the leading manufacturers of smart coatings include AkzoNobel (Netherlands), PPG Industries (US), Axalta Coatings Systems (US), The Sherwin-Williams Company (US), Jotun A/S (Norway), RPM International (US), Hempel A/S (Denmark), and NEI Corporation (US).
Key Target Audience in Smart Coatings Market
- Smart Coatings Manufacturers
- Raw Material Suppliers
- Traders, Distributors, and Suppliers of Smart Coatings
- Regional Manufacturer Associations and General Smart Coatings Associations
- Government & Regional Agencies and Research Organizations
- Investment Research Firms
Smart Coatings Market Report Scope
This research report categorizes the smart coatings market on the basis of layer, function, end-use industry, and region.
On the basis of Layer:
- Single layer
- Multi-layer
On the basis of Function:
- Anti-corrosion
- Anti-icing
- Anti-fouling
- Anti-microbial
- Self-cleaning
- Self-healing
On the basis of End-use Industry:
- Automotive & Transportation
- Marine
- Aerospace & Defense
- Building & Construction
On the basis of Region:
- North America
- Europe
- APAC
- Middle East & Africa
- South America
The market is further analyzed for the key countries in each of these regions.
Smart Coatings Market Report Available Customizations:
Along with the market data, MarketsandMarkets offers customizations according to a company’s specific needs. The following customization options are available for the report:
Smart Coating Market Country-level Analysis
- Country-level analysis of varied end-use industries of smart coatings
Smart Coating Market Company Information:
- Detailed analysis and profiling of additional market players
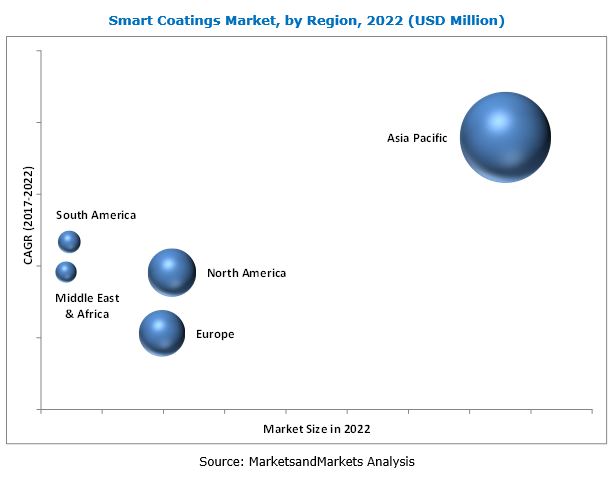
The smart coatings market is estimated at USD 2.15 Billion in 2017 and is projected to reach USD 6.27 Billion by 2022, at a CAGR of 23.87%. The market is driven by the wide use of smart coatings in different end-use industries, such as automotive & transportation, aerospace & defense, marine, and building & construction. The high demand for anti-corrosion coatings from the automotive & transportation end-use industry, especially for the protection of body parts, such as door closures, lock parts, exhausts, suspensions, engine components, and clamps & hose connections, against abrasion, drives the smart coatings market.
The demand for smart coatings in the automotive & transportation, aerospace & defense, marine, and building & construction end-use industries is high, especially in China, India, and Brazil. New emerging technologies and innovations drive the demand for smart coatings in these industries. The APAC smart coating market is expected to witness strong growth in the next five years.
Smart coatings have distinct properties, and different types of smart coatings are used in various industries based on the requirements. Therefore, the smart coatings market growth is dependent on its various end-use industries, such as automotive & transportation, aerospace & defense, marine, and building & construction. There is a growing demand for smart coatings for anti-corrosion, anti-fouling, self-cleaning applications from the end-use industries. On the other hand, government regulations and economic slowdown negatively affect the market growth.
Price and availability of raw materials are key factors for the manufacturers of smart coatings in determining the cost structure of their products. Raw materials used by the smart coatings industry include methylamines and inorganic chemicals.
Key Smart Coatings Market Industry Players
Key players operating in the smart coatings market include AkzoNobel N.V. (Netherlands), PPG Industries (US), Axalta Coatings Systems (US), The Sherwin-Williams Company (US), Jotun A/S (Norway), RPM International (US), Hempel A/S (Denmark), and NEI Corporation (US). Diverse product portfolios, strategically positioned R&D centers, continuous adoption of developmental strategies, and technological advancements are factors strengthening the market position of these companies. These companies have adopted various organic and inorganic growth strategies to enhance their current market share in the smart coating market.
Frequently Asked Questions (FAQ):
How big is the Smart Coating Market industry?
The smart coatings market is projected to grow from USD 2.15 Billion in 2017 to USD 6.27 Billion by 2022, at a CAGR of 23.87% from 2017 to 2022.
Who leading market players in Smart Coating industry?
Key players profiled in the smart coatings market report include AkzoNobel (Netherlands), PPG Industries (US), Axalta Coatings Systems (US), The Sherwin-Williams Company (US), Jotun A/S (Norway), RPM International (US), Hempel A/S (Denmark), and NEI Corporation (US).
To speak to our analyst for a discussion on the above findings, click Speak to Analyst
Table of Contents
1 Introduction (Page No. - 14)
1.1 Objectives of the Study
1.2 Market Definition
1.3 Markets Covered
1.3.1 Year Considered for the Study
1.4 Currency
1.5 Unit Considered
1.6 Stakeholders
2 Research Methodology (Page No. - 17)
2.1 Research Data
2.1.1 Secondary Data
2.1.1.1 Key Data From Secondary Sources
2.1.2 Primary Data
2.1.2.1 Key Data From Primary Sources
2.1.2.2 Key Industry Insights
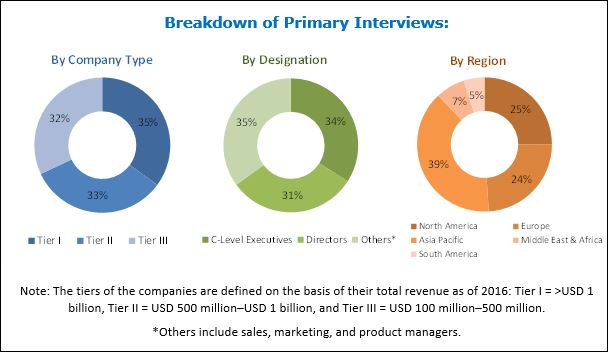
2.1.2.3 Breakdown of Primary Interviews
2.2 Market Size Estimation
2.2.1 Bottom-Up Approach
2.2.2 Top-Down Approach
2.3 Data Triangulation
2.4 Assumptions
2.5 Limitations
3 Executive Summary (Page No. - 25)
4 Premium Insights (Page No. - 30)
4.1 Attractive Opportunities for Market Players
4.2 Smart Coatings Market, By Layer
4.3 Smart Coating Market, Developed vs Developing Countries
4.4 APAC Smart Coatings Market Share, By End-Use Industry and Country
4.5 Smart Coating Market, By Function
4.6 Smart Coatings Market Growth, By Countries
5 Market Overview (Page No. - 34)
5.1 Introduction
5.2 Market Dynamics
5.2.1 Drivers
5.2.1.1 Growing Demand From End-Use Industries
5.2.1.2 Superior Properties of Smart Coatings
5.2.2 Restraints
5.2.2.1 Environmental Regulations
5.2.3 Opportunities
5.2.3.1 Increasing Demand for Products Requiring Low Maintenance
5.2.4 Challenges
5.2.4.1 Low Durability in Extreme Weather Conditions
5.3 Porter’s Five Forces Analysis
5.3.1 Threat of New Entrants
5.3.2 Threat of Substitutes
5.3.3 Bargaining Power of Buyers
5.3.4 Bargaining Power of Suppliers
5.3.5 Intensity of Competitive Rivalry
5.4 Macroeconomic Overview and Key Trends
5.4.1 Trends and Forecast of GDP
5.4.2 Trends in Automotive Industry
5.4.3 Trends in Construction Industry
5.4.4 Trends in the Aerospace Industry
6 Smart Coatings Market, By Layer (Page No. - 44)
6.1 Introduction
6.2 Multi-Layer
6.3 Single-Layer
7 Smart Coatings Market, By Function (Page No. - 48)
7.1 Introduction
7.2 Anti-Microbial
7.3 Anti-Corrosion
7.4 Anti-Fouling
7.5 Anti-Icing
7.6 Self-Cleaning
7.7 Self-Healing
7.8 Others
8 Smart Coating Market, By End-Use Industry (Page No. - 59)
8.1 Introduction
8.2 Automotive & Transportation
8.3 Marine
8.4 Building & Construction
8.5 Aerospace & Defense
8.6 Others
9 Smart Coatings Market, By Region (Page No. - 67)
9.1 Introduction
9.2 APAC
9.2.1 China
9.2.2 Japan
9.2.3 India
9.2.4 South Korea
9.2.5 Indonesia
9.2.6 Thailand
9.2.7 Malaysia
9.2.8 Rest of APAC
9.3 Europe
9.3.1 Germany
9.3.2 Russia
9.3.3 France
9.3.4 UK
9.3.5 Italy
9.3.6 Turkey
9.3.7 Spain
9.3.8 Rest of Europe
9.4 North America
9.4.1 US
9.4.2 Canada
9.4.3 Mexico
9.5 Middle East & Africa
9.5.1 Iran
9.5.2 Israel
9.5.3 South Africa
9.5.4 Rest of Middle East & Africa
9.6 South America
9.6.1 Brazil
9.6.2 Argentina
9.6.3 Rest of South America
10 Competitive Landscape (Page No. - 99)
10.1 Overview
10.2 Market Share Analysis
10.3 Competitive Scenerio
10.3.1 New Product Launches
10.3.2 Acquisitions
10.3.3 Expansions
11 Company Profiles (Page No. - 102)
(Overview, Financial*, Products & Services, Strategy, and Developments)
11.1 3M
11.2 PPG Industries
11.3 Akzonobel
11.4 Axalta Coating Systems
11.5 Hempel
11.6 Jotun
11.7 DOW Corning Corporation
11.8 Sherwin-Williams
11.9 RPM International
11.10 NEI Corporation
11.11 Additional Companies
11.11.1 Hygratek
11.11.2 Nanoshell Company
11.11.3 Ancatt
11.11.4 Tesla Nanocoatings
11.11.5 Royal Dsm
11.11.6 Greenkote
11.11.7 CG2 Nanocoatings
11.11.8 Helicity Technologies
*Details Might Not Be Captured in Case of Unlisted Companies
12 Appendix (Page No. - 126)
12.1 Discussion Guide
12.2 Knowledge Store: Marketsandmarkets Subscription Portal
12.3 Introducing RT: Real-Time Market Intelligence
12.4 Available Customizations
12.5 Related Reports
12.6 Author Details
List of Tables (86 Tables)
Table 1 Smart Coatings Market Snapshot (2017 vs 2022)
Table 2 Trends and Forecast of GDP, Change (2016-2022)
Table 3 Automotive Production, By Region, 2015-2016
Table 4 Construction Industry Spending, 2015–2017 (USD Billion)
Table 5 Global Growth Indicators of the Aerospace Industry, 2016–2035
Table 6 New Airplane Deliveries, By Region, 2016–2035
Table 7 Market Size, By Layer, 2015–2022 (Kiloton)
Table 8 Market Size, By Layer, 2015–2022 (USD Million)
Table 9 Multi-Layer Market Size, By Region, 2015–2022 (Kiloton)
Table 10 Multi-Layer Market Size, By Region, 2015–2022 (USD Million)
Table 11 Single-Layer Market Size, By Region, 2015–2022 (Kiloton)
Table 12 Single-Layer Market Size, By Region, 2015–2022 (USD Million)
Table 13 Market Size, By Function, 2015–2022 (Kiloton)
Table 14 Market Size, By Function, 2015–2022 (USD Million)
Table 15 Anti-Microbial Market Size, By Region, 2015–2022 (Kiloton)
Table 16 Anti-Microbial Market Size, By Region, 2015–2022 (USD Million)
Table 17 Anti-Corrosion Market Size, By Region, 2015–2022 (Kiloton)
Table 18 Anti-Corrosion Market Size, By Region, 2015–2022 (USD Million)
Table 19 Anti-Fouling Market Size, By Region, 2015–2022 (Kiloton)
Table 20 Anti-Fouling Market Size, By Region, 2015–2022 (USD Million)
Table 21 Anti-Icing Market Size, By Region, 2015–2022 (Kiloton)
Table 22 Anti-Icing Market Size, By Region, 2015–2022 (USD Million)
Table 23 Self-Cleaning Market Size, By Region, 2015–2022 (Kiloton)
Table 24 Self-Cleaning Market Size, By Region, 2015–2022 (USD Million)
Table 25 Self-Healing Market Size, By Region, 2015–2022 (Kiloton)
Table 26 Self-Healing Market Size, By Region, 2015–2022 (USD Million)
Table 27 Other Market Size, By Region, 2015–2022 (Kiloton)
Table 28 Other Market Size, By Region, 2015–2022 (USD Million)
Table 29 Market Size, By End-Use Industry, 2015–2022 (Kiloton)
Table 30 Market Size, By End-Use Industry, 2015–2022 (USD Million)
Table 31 Market Size in Automtoive & Transportation, By Region, 2015–2022 (Kiloton)
Table 32 Market Size in Automotive & Transportation, By Region, 2015–2022 (USD Million)
Table 33 Market Size in Marine, By Region, 2015–2022 (Kiloton)
Table 34 Market Size in Marine, By Region, 2015–2022 (USD Million)
Table 35 Market Size in Building & Construction, By Region, 2015–2022 (Kiloton)
Table 36 Market Size in Building & Construction, By Region, 2015–2022 (USD Million)
Table 37 Market Size in Aerospace & Defense, By Region, 2015–2022 (Kiloton)
Table 38 Market Size in Aerospace & Defense, By Region, 2015–2022 (USD Million)
Table 39 Market Size in Other Industries, By Region, 2015–2022 (Kiloton)
Table 40 Market Size in Other Industries, By Region, 2015–2022 (USD Million)
Table 41 Market Size, By Region, 2015–2022 (Kiloton)
Table 42 Market Size, By Region, 2015–2022 (USD Million)
Table 43 APAC: Smart Coatings Market Size, By Country, 2015–2022 (Kiloton)
Table 44 APAC: Market Size, By Country, 2015–2022 (USD Million)
Table 45 APAC: Market Size, By End-Use Industry 2015–2022 (Kiloton)
Table 46 APAC: Market Size, By End-Use Industry, 2015–2022 (USD Million)
Table 47 APAC: Market Size, By Function, 2015–2022 (Kiloton)
Table 48 APAC: Market Size, By Function, 2015–2022 (USD Million)
Table 49 APAC: Market Size, By Layer, 2015–2022 (Kiloton)
Table 50 APAC: Smart Coating Market Size, By Layer, 2015–2022 (USD Million)
Table 51 Europe: Smart Coatings Market Size, By Country, 2015–2022 (Kiloton)
Table 52 Europe: Market Size, By Country, 2015–2022 (USD Million)
Table 53 Europe: Market Size, By End-Use Industry, 2015–2022 (Kiloton)
Table 54 Europe: Market Size, By End-Use Industry, 2015–2022 (USD Million)
Table 55 Europe: Market Size, By Function, 2015–2022 (Kiloton)
Table 56 Europe: Market Size, By Function, 2015–2022 (USD Million)
Table 57 Europe: Market Size, By Layer, 2015–2022 (Kiloton)
Table 58 Europe: Market Size, By Layer, 2015–2022 (USD Million)
Table 59 North America: Smart Coatings Market Size, By Country, 2015–2022 (Kiloton)
Table 60 North America: Market Size, By Country, 2015–2022 (USD Million)
Table 61 North America: Smart Coatings Market, By End-Use Industry 2015–2022 (Kiloton)
Table 62 North America: Market Size, By End-Use Industry, 2015–2022 (USD Million)
Table 63 North America: Market, By Layer, 2015–2022 (Kiloton)
Table 64 North America: Market Size, By Layer, 2015–2022 (USD Million)
Table 65 North America: Market, By Function, 2015–2022 (Kiloton)
Table 66 North America: Smart Coating Market Size, By Function, 2015–2022 (USD Million)
Table 67 Middle East & Africa: Smart Coatings Market Size, By Country, 2015–2022 (Kiloton)
Table 68 Middle East & Africa: Market Size, By Country, 2015–2022 (USD Million)
Table 69 Middle East & Africa: Market Size, By End-Use Industry 2015–2022 (Kiloton)
Table 70 Middle East & Africa: Market Size, By End-Use Industry 2015–2022 (USD Million)
Table 71 Middle East & Africa: Market Size, By Function, 2015–2022 (Kiloton)
Table 72 Middle East & Africa: Market Size, By Function, 2015–2022 (USD Million)
Table 73 Middle East & Africa: Market Size, By Layer, 2015–2022 (Kiloton)
Table 74 Middle East & Africa: Smart Coating Market Size, By Layer, 2015–2022 (USD Million)
Table 75 South America: Smart Coatings Market Size, By Country, 2015–2022 (Kiloton)
Table 76 South America: Market Size, By Country, 2015–2022 (USD Million)
Table 77 South America: Market Size, By End-Use Industry, 2015–2022 (Kiloton)
Table 78 South America: Market Size , By End-Use Industry, 2015–2022 (USD Million)
Table 79 South America: Market Size, By Function, 2015–2022 (Kiloton)
Table 80 South America: Market Size, By Function, 2015–2022 (USD Million)
Table 81 South America: Market Size, By Layer, 2015–2022 (Kiloton)
Table 82 South America: Smart Coating Market Size , By Layer , 2015–2022 (USD Million)
Table 83 Market Ranking of Key Players (2016)
Table 84 New Product Launches, Between 2015 and 2017
Table 85 Acquisitions, Between 2015 and 2017
Table 86 Expansions, Between 2015 and 2017
List of Figures (33 Figures)
Figure 1 Smart Coatings Market: Research Design
Figure 2 Market Size Estimation: Bottom-Up Approach
Figure 3 Market Size Estimation: Top-Down Approach
Figure 4 Smart Coating Market: Data Triangulation
Figure 5 Multi-Layer Smart Coatings to Dominate the Market During the Forecast Period
Figure 6 Marine to Be the Fastest-Growing End-Use Industry in the Market During the Forecast Period
Figure 7 Smart Anti-Corrosion Coatings to Be the Fastest-Growing Segment Between 2017 and 2022
Figure 8 APAC Was the Largest Market of Smart Coatings in 2016
Figure 9 Growing Demand From End-Use Industries to Offer Lucrative Growth Opportunities for Market Players Between 2017 and 2022
Figure 10 Multi-Layer Smart Coatings to Register the Highest CAGR Between 2017 and 2022
Figure 11 Market of Smart Coatings to Register High CAGR in Developing Nations Than Developed Nations
Figure 12 Automotive & Transportation Accounted for the Largest Share of APAC Market in 2016
Figure 13 Anti-Corrosion Segment to Lead the Market of Smart Coatings During the Forecast Period
Figure 14 India to Register Highest CAGR Between 2017 and 2022
Figure 15 Drivers, Restraints, Opportunities, and Challenges in the Smart Coatings Market
Figure 16 Porter’s Five Forces Analysis
Figure 17 Multi-Layer Smart Coatings to Dominate the Market Between 2017 and 2022
Figure 18 Anti-Corrosion to Be the Largest Function of Smart Coatings During the Forecast Period
Figure 19 Automotive & Transportation to Be the Largest End User for Smart Coatings During the Forecast Period
Figure 20 India to Register the Highest CAGR in the Smart Coating Market During the Forecast Period
Figure 21 APAC: Smart Coatings Market Snapshot
Figure 22 Europe: Smart Coating Market Snapshot
Figure 23 North America: Smart Coatings Market Snapshot
Figure 24 Companies Adopted New Product Launches as the Key Growth Strategy Between 2015 and 2017
Figure 25 3M: Company Snapshot
Figure 26 PPG Industries: Company Snapshot
Figure 27 Akzonobel: Company Snapshot
Figure 28 Axalta Coating Systems: Company Snapshot
Figure 29 Hempel: Company Snapshot
Figure 30 Jotun: Company Snapshot
Figure 31 DOW Corning Corporation: Company Snapshot
Figure 32 Sherwin-Williams: Company Snapshot
Figure 33 RPM International: Company Snapshot


Growth opportunities and latent adjacency in Smart Coatings Market