Smart Retail Market Size, Share, Industry Growth, Trends & Analysis by System (Smart Payment Systems, Intelligent Vending Machines), Application (Foot-traffic Monitoring, Inventory Management), Retail Offering (Fast-moving Consumer Goods, Hardlines & Leisure Goods), & Geography - Global Forecast to 2025


Updated on : July 19 , 2023
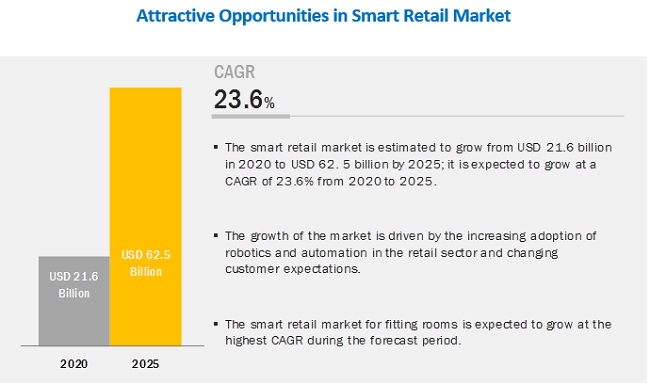
[199 Pages Report] The global smart retail market Size, Share, Industry Growth, Trends & Analysis is estimated to grow from USD 21.6 billion in 2020 to USD 62.5 billion by 2025; growing at a CAGR of 23.6%.
The key factors fueling the growth of this market are the increasing use of robots and automation to offer shopping convenience to customers and the rising adoption of big data analytics, machine learning, blockchain, and artificial intelligence technologies by retailers.
Robotics segment accounted for largest share of smart retail market in 2019
The robotics segment accounted for the largest share of the smart retail market in 2019. Robots simplify the process of finding suitable products for customers. Thus, an increase in the deployment of robots is observed in supermarkets, hypermarkets, and other retail stores to make the shopping experience easy for consumers. This leads to the growth of the robotics segment.
Foot-traffic monitoring segment accounted for largest share of smart retail market in 2019
The market for foot-traffic monitoring accounted for the largest share of the smart retail market in 2019. The dominance is attributed to the increase in awareness regarding foot-traffic monitoring among retailers. In-store foot-traffic monitoring is essential as it provides insights to retailers about different aspects of stores, including the effect of marketing efforts, as well as helps them plan growth strategies based on the purchase history of customers.
Market for foot-traffic monitoring segment is expected to grow at highest CAGR during forecast period
The market for the foot-traffic monitoring segment is expected to grow at the highest CAGR during the forecast period. The growth is attributed to the continuous increase in population, which is expected to contribute to the growth of this segment of the market.
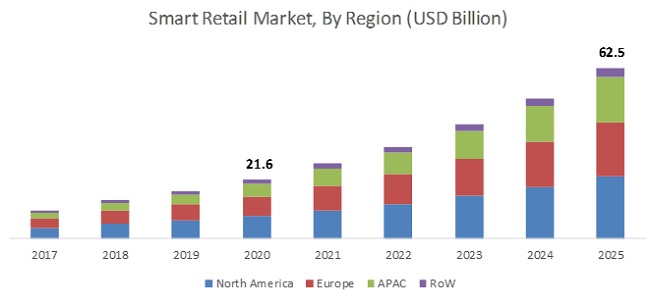
North America held major share of smart retail market in 2019
North America has a large number of supermarkets, hypermarkets, departmental stores, and other types of retail stores such as Food City (US) and Schnucks Markets, Inc. (US) that have implemented POS solutions, automatic storage and retrieval systems, smart carts, electronic shelf labels (ESLs), and self-checkout systems in their premises. Owing to this, North America held the major share of the smart retail market in 2019.
Key Market Players
IBM (New York, US), Intel Corporation (California, US), Cisco Systems, Inc. (California, US), NXP Semiconductors N.V. (The Netherlands), and Microsoft (Washington, US) are a few major companies operating in the smart retail market. These companies have adopted both organic and inorganic growth strategies such as product launches & product developments, expansions, joint ventures, partnerships, collaborations, agreements, and acquisitions to strengthen their position in the market.
Please visit 360Quadrants to see the vendor listing of e-Commerce Platforms
Smart Retail Market Report Scope :
|
Report Metric |
Details |
| Estimated Market Size | USD 21.6 billion in 2020 |
| Projected Market Size | USD 62.5 billion by 2025 |
| Growth Rate | At CAGR of 23.6%. |
|
Market size available for years |
2017–2025 |
|
Base year |
2019 |
|
Forecast period |
2020–2025 |
|
Forecast unit |
Value (USD thousand/million/billion) |
|
Segments covered |
System, application, retail offering, and region |
|
Geographic regions covered |
North America, APAC, Europe, and RoW |
|
Companies covered |
IBM (New York, US), Intel Corporation (California, US), Cisco Systems, Inc. (California, US), NXP Semiconductors N.V. (The Netherlands), Microsoft (Washington, US), Huawei Investment & Holding Co., Ltd (China), NVIDIA Corporation (California, US), Samsung Electronics (Suwon, South Korea), Google Inc. (California, US), PTC, Inc. (Massachusetts, US), Trigo (Israel), Standard Cognition (California, US), Caper Inc. (New York, US), Zippin (San Francisco, US), Walmart Inc. (Arkansas, US), Alibaba Group Holding Limited (Hangzhou, China), Amazon.com, Inc. (Washington, US), Albert Heijn BV (Ahold Delhaize) (Zaandam, the Netherlands), LOTTE (Seoul, South Korea), Estimote, Inc. (New York, US), AWM SMART SHELF (California, US), Smartcart (Helsinki, Finland), Cozy Infosystems (US), and Focal Systems Inc (California, US) |
This report categorizes the smart retail market based on system, application, retail offering, and region.
Smart retail Market, By System:
- Digital Signage Solutions
- Smart Labels
- Smart Payment Systems
- Intelligent Vending Machines
- Augmented Reality Solutions
- Virtual Reality Solutions
- POS Solutions
- Smart Carts
- Robotics
- Analytics
Smart retail Market, By Application:
- Foot-traffic Monitoring
- Inventory Management
- Loyalty Management and Payment
- Predictive Equipment Maintenance
- Brand Protection
- Smart Fitting Rooms
Smart retail Market, By Retail Offering:
- Apparel and Accessories
- Fast-moving Consumer Goods
- Hardlines and Leisure Goods
- Others
Smart retail Market, By Geography
-
North America
- US
- Canada
- Mexico
-
Europe
- UK
- Germany
- Italy
- Spain
- Rest of Europe
-
Asia Pacific (APAC)
- China
- Japan
- India
- South Korea
- Rest of APAC
-
Rest of the World (RoW)
- Middle East &Africa
- South America
Major Market Developments
- In January 2020, Intel Corporation collaborated with ARENA15 (Las Vegas), an experiential retail and entertainment complex. By using Intel’s technology and solutions AREA15 aims to improve customer shopping experiences.
- In January 2020, Intel Corporation collaborated with Sensormatic Solutions, a Johnson controls subsidiary, to deliver scalable, AI-powered solutions for retailers. Sensormatic Solutions will also leverage the Intel Distribution of OpenVINO toolkits, as well as Intel models for delivering its solutions to retailers.
- In January 2020, Walmart Inc. entered into a partnership with Bossa Nova Robotics, a Bay area-based company, to deliver shelf-scanning inventory robots to 1,000 Walmart stores in the US.
- In November 2019, Standard Cognition entered into a partnership with Mars Wrigley, a company that manufactures chocolates, chewing gums, mints, and fruity confections, to help Mars Wrigley with autonomous checkout solutions.
- In October 2019, Caper Inc. entered into a partnership with Sobeys Inc., one of the largest grocery chains in North America, to deploy its smart cart technology. The partnership intended to commercialize Caper’s products and step in the smart retail market.
Key Questions Addressed by the Report
- Where will all these developments take the industry in the mid-to-long term?
- What are the upcoming trends in the smart retail market?
- What are the opportunities for the existing players and for those who are planning to enter various stages of the smart retail value chain?
- What are the emerging applications of smart retail systems?
To speak to our analyst for a discussion on the above findings, click Speak to Analyst
TABLE OF CONTENTS
1 INTRODUCTION (Page No. - 20)
1.1 STUDY OBJECTIVES
1.2 MARKET DEFINITION & SCOPE
1.2.1 INCLUSIONS AND EXCLUSIONS
1.3 SCOPE
1.3.1 MARKETS COVERED
1.3.2 YEARS CONSIDERED
1.4 CURRENCY
1.5 LIMITATIONS
1.6 MARKET STAKEHOLDERS
2 RESEARCH METHODOLOGY (Page No. - 24)
2.1 RESEARCH DATA
2.1.1 SECONDARY DATA
2.1.1.1 Secondary sources
2.1.2 PRIMARY DATA
2.1.2.1 Primary sources
2.1.2.2 Key industry insights
2.1.2.3 Breakdown of primaries
2.2 MARKET SIZE ESTIMATION
2.2.1 BOTTOM-UP APPROACH
2.2.1.1 Approach for capturing market size using bottom-up analysis (demand side)
2.2.2 TOP-DOWN APPROACH
2.2.2.1 Approach for capturing market share using top-down analysis (supply side)
2.3 MARKET BREAKDOWN AND DATA TRIANGULATION
2.4 RESEARCH ASSUMPTIONS
3 EXECUTIVE SUMMARY (Page No. - 35)
4 PREMIUM INSIGHTS (Page No. - 39)
4.1 ATTRACTIVE GROWTH OPPORTUNITIES IN SMART RETAIL MARKET
4.2 MARKET, BY REGION
4.3 MARKET, BY SYSTEM AND APPLICATION
4.4 MARKET, BY COUNTRY
5 MARKET OVERVIEW (Page No. - 42)
5.1 INTRODUCTION
5.2 MARKET DYNAMICS
5.2.1 DRIVERS
5.2.1.1 Increasing use of robots and automation to offer shopping convenience to customers
5.2.1.2 Rising adoption of big data analytics, machine learning, blockchain, and artificial intelligence technologies by retailers
5.2.1.3 Changing customer expectations leading to increased use of smart technologies by retailers
5.2.2 RESTRAINTS
5.2.2.1 Increased maintenance costs of advanced high-end computing systems
5.2.2.2 High risks of customer data thefts
5.2.3 OPPORTUNITIES
5.2.3.1 Increase in number of smart stores to lead to rise in adoption of self-delivery vehicles
5.2.3.2 Rise in use of technologies by retailers to directly connect with end users
5.2.4 CHALLENGES
5.2.4.1 Increase in instances of shoplifting
5.3 VALUE CHAIN ANALYSIS
6 INDUSTRY TRENDS AND CASE STUDIES (Page No. - 50)
6.1 INTRODUCTION
6.2 INDUSTRY TRENDS
6.2.1 IN-STORE EXPERIENCE
6.2.1.1 Do it yourself (DIY)
6.2.1.2 Product customization
6.2.1.3 Extended services
6.2.1.4 Entertainment
6.2.1.5 New store concepts
6.2.1.6 Innovative merchandising
6.2.2 BUILDING COMMUNITY
6.2.2.1 Creating social links
6.2.2.2 Sharing and developing expertise
6.2.3 RETAIL FOR GOOD
6.2.3.1 Transparency and traceability
6.2.3.2 Sustainability
6.2.3.3 Making the world better place
6.2.4 HIGH-TECH STORES
6.2.4.1 Personalized experience
6.2.4.2 Visual recognition and cashierless stores
6.2.4.3 Mobile apps
6.2.4.4 AR, VR, and voice commerce
6.2.4.5 Robots
6.3 CASE STUDY
6.3.1 SEPHORA (SPAIN): AI-BASED MIRROR (SMART MIRROR)
6.3.2 AMAZON GO (US): AUTOMATED RETAIL STORE
6.3.3 KROGER (US): DIGITAL DISPLAY SOLUTION
6.3.4 ZARA (SPAIN): AUGMENTED REALITY SOLUTION
6.3.5 JACK & JONES (CHINA): FACIAL RECOGNITION SOLUTION
6.3.6 HEMA SUPERMARKET (CHINA): CASHIERLESS STORE
7 SMART RETAIL MARKET-COVID-19 IMPACT ANALYSIS (Page No. - 56)
8 SMART RETAIL MARKET, BY SYSTEM (Page No. - 57)
8.1 INTRODUCTION
8.2 DIGITAL SIGNAGE SOLUTIONS
8.2.1 DISPLAYS
8.2.1.1 Rise in demand for high picture quality, attractive designs, and high specification-based displays spurring demand for digital signage solutions in retail stores
8.2.2 MEDIA PLAYERS, PCS, AND SET-TOP BOXES
8.2.2.1 Increase in use of digital signage solutions in retail stores to engage customers
8.2.3 MOUNTS & CABLES
8.2.3.1 Emergence of mounts & cables as essential components of digital signage hardware
8.3 SMART LABELS
8.3.1 SMART BEACONS
8.3.1.1 Rise in adoption of smartphones increases demand for smart beacons
8.3.1.2 BLE
8.3.1.2.1 Low cost, long battery life, and simple design of BLE to spur its market growth
8.3.1.3 Hybrid
8.3.1.3.1 Rise in number of sensors increases demand for hybrid Bluetooth solutions
8.3.2 ELECTRONIC SHELF LABELS
8.3.2.1 LCD electronic shelf labels
8.3.2.1.1 Low costs of LCD ESLs lead to increase in their demand
8.3.2.2 Segmented E-paper electronic shelf labels
8.3.2.2.1 Segmented E-paper ESLs enable energy savings
8.3.2.3 Full-graphic E-paper electronic shelf labels
8.3.2.3.1 Advancements in segmented E-paper ESLs lead to increase in their demand
8.4 SMART PAYMENT SYSTEMS
8.4.1 NFC-READY POS TERMINALS
8.4.1.1 Increase in use of NFC-ready POS terminals due to their advanced features
8.4.2 NFC-READY MPOS TERMINALS
8.4.2.1 Mobile point-of-sale terminals enable smooth financial transactions to improve customer experience
8.5 INTELLIGENT VENDING MACHINES
8.5.1 INTELLIGENT VENDING MACHINES HELP IMPROVE CUSTOMER EXPERIENCE AND INCREASE PROFIT MARGINS
8.6 AUGMENTED REALITY SOLUTIONS
8.6.1 TECHNOLOGICAL ADVANCEMENTS IN AR SOLUTIONS TO FUEL GROWTH OF SMART RETAIL MARKET
8.7 VIRTUAL REALITY SOLUTIONS
8.7.1 VIRTUAL REALITY TECHNOLOGY ENHANCES CUSTOMER EXPERIENCE LEADING TO INCREASE STORE FOOT-TRAFFIC
8.8 POS SOLUTIONS
8.8.1 CONTACTLESS CHECKOUTS INCREASE DEMAND FOR ADVANCED POS SOLUTIONS
8.8.2 INTERACTIVE KIOSKS
8.8.2.1 Deployment of interactive kiosks speeds up checkout lines in stores
8.8.3 SELF-CHECKOUT SOLUTIONS
8.8.3.1 Ease of use and management of self-checkout solutions maximize merchandising, increase advertisement space, and promote brand presence of retailers
8.9 SMART CARTS
8.9.1 DEMAND FOR EASY SELF-CHECKOUTS TO INCREASE DEMAND FOR SMART CARTS
8.10 ROBOTICS
8.10.1 RISE IN ADOPTION OF ROBOTS IN RETAIL STORES TO PERFORM VARIOUS TASKS
8.11 ANALYTICS
8.11.1 ARTIFICIAL INTELLIGENCE
8.11.1.1 Increase in adoption of AI technology in retail stores to enhance shopping experience of customers
9 SMART RETAIL MARKET, BY APPLICATION (Page No. - 88)
9.1 INTRODUCTION
9.2 FOOT-TRAFFIC MONITORING
9.2.1 FOOT-TRAFFIC MONITORING SEGMENT HELD LARGEST SHARE OF SMART RETAIL MARKET IN 2019
9.3 PREDICTIVE EQUIPMENT MAINTENANCE
9.3.1 INCREASE IN ADOPTION OF PREDICTIVE MAINTENANCE SOLUTIONS TO SAVE TIME AND MONEY OF RETAILERS
9.4 INVENTORY MANAGEMENT
9.4.1 RISE IN DEMAND FOR ROBOTS AND ELECTRONIC SHELF LABELS IN RETAIL STORES TO MANAGE INVENTORIES
9.5 SMART FITTING ROOMS
9.5.1 SURGE IN DEPLOYMENT OF SMART FITTING ROOMS IN STORES
9.6 BRAND PROTECTION
9.6.1 INCREASE IN ADOPTION OF BRAND PROTECTION SOLUTIONS BY RETAILERS TO PROTECT THEIR NAME AND CUSTOMERS
9.7 LOYALTY MANAGEMENT AND PAYMENTS
9.7.1 RISE IN NUMBER OF LOYALTY PROGRAMS BY RETAILERS TO RETAIN AND VALUE THEIR CUSTOMERS
10 SMART RETAIL MARKET, BY RETAIL OFFERING (Page No. - 93)
10.1 INTRODUCTION
10.2 APPAREL AND ACCESSORIES
10.2.1 CHANGE IN EXPECTATIONS OF CUSTOMERS TO INCREASE DEMAND FOR SMART MIRRORS IN APPAREL AND ACCESSORIES STORES WORLDWIDE
10.3 FAST-MOVING CONSUMER GOODS
10.3.1 SMART RETAIL TECHNOLOGIES HELP CUSTOMERS TO LOCATE FRAUDULENT PRODUCTS AND AWARE THEM ABOUT HIGH PRICES OF PRODUCTS
10.4 HARDLINES AND LEISURE GOODS
10.4.1 INCREASE IN DEMAND FOR AR/VR SOLUTIONS TO ELIMINATE ONLINE BUY-TRY AND RETURN PROCESS
10.5 OTHERS
11 TECHNOLOGIES USED FOR SMART RETAIL OPERATIONS (Page No. - 97)
11.1 INTRODUCTION
11.2 VISUAL RECOGNITION
11.3 BLOCKCHAIN
11.4 ARTIFICIAL INTELLIGENCE (AI)
11.5 MOBILE
12 GEOGRAPHIC ANALYSIS (Page No. - 99)
12.1 INTRODUCTION
12.2 NORTH AMERICA
12.2.1 US
12.2.1.1 Presence of smart retail solution providers and consumers in US
12.2.2 CANADA
12.2.2.1 Increase in number of international brand stores to spur growth of market in Canada
12.2.3 MEXICO
12.2.3.1 Entry of well-established retail players to propel market growth in Mexico
12.3 EUROPE
12.3.1 UK
12.3.1.1 Presence of prominent retail supermarkets in UK to spur market growth
12.3.2 GERMANY
12.3.2.1 Existence of prominent retail stores to fuel growth of smart retail market in Germany
12.3.3 FRANCE
12.3.3.1 Rise in use of automation to overcome challenges faced during in-store processes
12.3.4 ITALY
12.3.4.1 Presence of numerous retailers to contribute to growth of smart retail market in Italy
12.3.5 SPAIN
12.3.5.1 Increase in adoption of advanced smart retail solutions by shopping centers to lead to growth of smart retail market in Spain
12.3.6 REST OF EUROPE
12.4 APAC
12.4.1 CHINA
12.4.1.1 Significant dominance of retail industry in China expected to create growth opportunities for smart retail market in country
12.4.2 JAPAN
12.4.2.1 Government initiatives to promote cashierless stores in Japan to fuel growth of market
12.4.3 SOUTH KOREA
12.4.3.1 Entry of new players in retail industry of South Korea to fuel growth of smart retail market in country
12.4.4 INDIA
12.4.4.1 Emergence of cashierless stores in India to propel growth of smart retail market in country
12.4.5 REST OF APAC
12.5 ROW
12.5.1 MIDDLE EAST AND AFRICA
12.5.1.1 Rapidly growing population to contribute growth of smart retail market in Middle East and Africa
12.5.2 SOUTH AMERICA
12.5.2.1 Urbanization and increased focus of global players on adoption of advanced technologies to contribute to growth of smart retail market in South America
13 COMPETITIVE LANDSCAPE (Page No. - 113)
13.1 INTRODUCTION
13.2 MARKET RANKING ANALYSIS OF PLAYERS IN SMART RETAIL MARKET, 2019
13.3 COMPETITIVE LEADERSHIP MAPPING
13.3.1 VISIONARY LEADERS
13.3.2 DYNAMIC DIFFERENTIATORS
13.3.3 INNOVATORS
13.3.4 EMERGING COMPANIES
13.4 COMPETITIVE SCENARIO
13.4.1 PRODUCT LAUNCHES AND DEVELOPMENTS
13.4.2 EXPANSIONS
13.4.3 PARTNERSHIPS, AGREEMENTS, JOINT VENTURES, AND COLLABORATIONS
13.4.4 ACQUISITIONS
14 COMPANY PROFILES (Page No. - 126)
(Business Overview, Products/Solutions/Services Offered, Recent Developments, SWOT Analysis, and MnM View)*
14.1 INTRODUCTION
14.2 KEY PLAYERS
14.2.1 IBM
14.2.2 INTEL CORPORATION
14.2.3 CISCO SYSTEMS INC.
14.2.4 NXP SEMICONDUCTORS N.V.
14.2.5 MICROSOFT
14.2.6 HUAWEI INVESTMENT & HOLDING CO., LTD.
14.2.7 NVIDIA CORPORATION
14.2.8 SAMSUNG ELECTRONICS
14.2.9 GOOGLE INC.
14.2.10 PTC INC.
14.2.11 TRIGO
14.2.12 STANDARD COGNITION
14.2.13 CAPER INC.
14.2.14 ZIPPIN
14.3 RIGHT TO WIN
14.4 OTHER KEY PLAYERS
14.4.1 LG DISPLAY CO., LTD.
14.4.2 PAR TECHNOLOGY CORPORATION
14.4.3 TEXAS INSTRUMENTS INC.
14.4.4 STMICROELECTRONICS N.V.
14.4.5 HONEYWELL INTERNATIONAL INC.
14.4.6 ROBERT BOSCH GMBH
14.4.7 SOFTBANK ROBOTICS GROUP CORP.
14.4.8 BROADCOM INC.
14.4.9 INGENICO
14.4.10 VERIFONE, INC.
14.4.11 FIRST DATA CORPORATION
14.4.12 NCR CORPORATION
14.4.13 INFINEON TECHNOLOGIES AG
14.4.14 DIEBOLD NIXDORF, INCORPORATED
14.4.15 PRICER
14.4.16 PROBIZ TECHNOLOGIES PRVT LTD.
14.4.17 SES-IMAGOTAG
14.4.18 E INK HOLDINGS INC.
14.4.19 BOSSA NOVA ROBOTICS
14.4.20 FIVE ELEMENTS ROBOTICS
14.5 END USERS
14.5.1 AMAZON.COM, INC.
14.5.2 ALIBABA GROUP HOLDING LIMITED
14.5.3 WALMART INC.
14.5.4 ALBERT HEIJN BV (AHOLD DELHAIZE)
14.5.5 LOTTE
14.6 OTHER PLAYERS
14.6.1 ESTIMOTE, INC.
14.6.2 AWM SMART SHELF
14.6.3 SMARTCART
14.6.4 COZY INFOSYSTEMS
14.6.5 FOCAL SYSTEMS INC.
*Details on Business Overview, Products/Solutions/Services Offered, Recent Developments, SWOT Analysis, and MnM View might not be captured in case of unlisted companies.
15 APPENDIX (Page No. - 193)
15.1 DISCUSSION GUIDE
15.2 KNOWLEDGE STORE: MARKETSANDMARKETS’ SUBSCRIPTION PORTAL
15.3 AVAILABLE CUSTOMIZATIONS
15.4 RELATED REPORTS
15.5 AUTHOR DETAILS
LIST OF TABLES (77 TABLES)
TABLE 1 SMART RETAIL MARKET, BY SYSTEM, 2017–2025 (USD MILLION)
TABLE 2 MARKET FOR DIGITAL SIGNAGE SOLUTIONS, BY OFFERING, 2017–2025 (USD MILLION)
TABLE 3 MARKET FOR DIGITAL SIGNAGE SOLUTIONS, BY HARDWARE, 2017–2025 (USD MILLION)
TABLE 4 MARKET FOR DIGITAL SIGNAGE SOLUTIONS, BY DISPLAY, 2017–2025 (USD MILLION)
TABLE 5 MARKET FOR DIGITAL SIGNAGE SOLUTIONS, BY DISPLAY, 2017–2025 (MILLION UNITS)
TABLE 6 MARKET FOR DIGITAL SIGNAGE SOLUTIONS, BY APPLICATION, 2017–2025 (MILLION UNITS)
TABLE 7 MARKET FOR DIGITAL SIGNAGE SOLUTIONS, BY REGION, 2017–2025 (USD MILLION)
TABLE 8 MARKET FOR SMART BEACONS, BY TYPE, 2017–2025 (USD MILLION)
TABLE 9 MARKET FOR SMART BEACONS, BY OFFERING, 2017–2025 (USD MILLION)
TABLE 10 MARKET FOR SMART BEACONS, BY HARDWARE, 2017–2025 (USD MILLION)
TABLE 11 MARKET FOR SMART BEACONS, BY SOFTWARE, 2017–2025 (USD MILLION)
TABLE 12 MARKET FOR SMART BEACONS, BY REGION, 2017–2025 (USD MILLION)
TABLE 13 MARKET FOR ESL, BY PRODUCT, 2017–2025 (USD MILLION)
TABLE 14 MARKET FOR ESL, BY COMMUNICATION TECHNOLOGY, 2017–2025 (USD MILLION)
TABLE 15 MARKET FOR ESL, BY COMPONENT, 2017–2025 (USD MILLION)
TABLE 16 MARKET FOR ESL, BY REGION, 2017–2025 (USD MILLION)
TABLE 17 MARKET FOR ESL, BY REGION, 2017–2025 (MILLION UNITS)
TABLE 18 SMART RETAIL MARKET FOR SMART PAYMENT SYSTEMS, BY POS TERMINAL, 2017–2025 (MILLION UNITS)
TABLE 19 MARKET FOR SMART PAYMENT SYSTEMS, BY POS TERMINAL, 2017–2025 (USD MILLION)
TABLE 20 MARKET FOR POS TERMINAL, BY REGION, 2017–2025 (USD MILLION)
TABLE 21 MARKET FOR INTELLIGENT VENDING MACHINES, BY REGION, 2017–2025 (USD MILLION)
TABLE 22 MARKET FOR AUGMENTED REALITY SOLUTIONS, BY OFFERING, 2017–2025 (USD MILLION)
TABLE 23 SMART RETAIL MARKET FOR AUGMENTED REALITY SOLUTIONS, BY DEVICE TYPE, 2017–2025 (USD MILLION)
TABLE 24 MARKET FOR AUGMENTED REALITY SOLUTIONS, BY DEVICE TYPE, 2017–2025 (THOUSAND UNITS)
TABLE 25 MARKET FOR AUGMENTED REALITY SOLUTIONS, BY APPLICATION, 2017–2025 (USD MILLION)
TABLE 26 SMART RETAIL MARKET FOR AUGMENTED REALITY SOLUTIONS, BY RETAIL TYPE, 2017–2025 (MILLION UNITS)
TABLE 27 MARKET FOR AUGMENTED REALITY SOLUTIONS, BY REGION, 2017–2025 (USD MILLION)
TABLE 28 MARKET FOR VIRTUAL REALITY SOLUTIONS, BY DEVICE TYPE, 2017–2025 (USD MILLION)
TABLE 29 MARKET FOR VIRTUAL REALITY SOLUTIONS, BY DEVICE TYPE, 2017–2025 (THOUSAND UNITS)
TABLE 30 MARKET FOR VIRTUAL REALITY SOLUTIONS, BY REGION, 2017–2025 (THOUSAND UNITS)
TABLE 31 MARKET FOR POS SOLUTIONS, BY SYSTEM, 2017–2025 (USD MILLION)
TABLE 32 MARKET FOR POS SOLUTIONS, BY SYSTEM, 2017–2025 (THOUSAND UNITS)
TABLE 33 MARKET FOR POS SOLUTIONS, BY REGION, 2017–2025 (USD MILLION)
TABLE 34 MARKET FOR INTERACTIVE KIOSKS, BY REGION, 2017–2025 (USD MILLION)
TABLE 35 MARKET FOR SELF-CHECKOUT SOLUTIONS, BY REGION, 2017–2025 (USD MILLION)
TABLE 36 MARKET FOR SMART CARTS, BY REGION, 2017–2025 (USD MILLION)
TABLE 37 MARKET FOR SMART CARTS, BY REGION, 2017–2025 (UNITS)
TABLE 38 SMART RETAIL MARKET FOR ROBOTICS, BY APPLICATION, 2017–2025 (UNITS)
TABLE 39 MARKET FOR ROBOTICS, BY APPLICATION, 2017–2025 (USD MILLION)
TABLE 40 MARKET FOR ROBOTICS, BY REGION, 2017–2025 (USD MILLION)
TABLE 41 MARKET FOR ROBOTICS, BY OFFERING, 2017–2025 (MILLION UNITS)
TABLE 42 MARKET FOR AI, BY OFFERING, 2017–2025 (USD MILLION)
TABLE 43 MARKET FOR AI, BY HARDWARE, 2017–2025 (USD MILLION)
TABLE 44 MARKET FOR AI, BY PROCESSOR, 2017–2025 (USD MILLION)
TABLE 45 MARKET FOR AI IN HARDWARE, BY REGION, 2017–2025 (USD MILLION)
TABLE 46 MARKET FOR AI, BY SOFTWARE, 2017–2025 (USD MILLION)
TABLE 47 MARKET FOR AI IN SOFTWARE, BY DEPLOYMENT TYPE, 2017–2025 (USD MILLION)
TABLE 48 MARKET FOR AI, BY PLATFORM, 2017–2025 (USD MILLION)
TABLE 49 MARKET FOR AI, BY SERVICE, 2017–2025 (USD MILLION)
TABLE 50 MARKET FOR AI, BY TECHNOLOGY, 2017–2025 (USD MILLION)
TABLE 51 MARKET FOR AI IN MACHINE LEARNING, BY TYPE, 2017–2025 (USD MILLION)
TABLE 52 MARKET FOR AI IN CONTEXT AWARENESS, BY PROCESS, 2017–2025 (USD MILLION)
TABLE 53 MARKET FOR AI, BY APPLICATION, 2017–2025 (USD MILLION)
TABLE 54 MARKET FOR AI IN SHELF MONITORING, BY REGION, 2017–2025 (USD MILLION)
TABLE 55 MARKET FOR AI IN CUSTOMER RELATIONSHIP MANAGEMENT, BY REGION, 2017–2025 (USD MILLION)
TABLE 56 SMART RETAIL MARKET FOR AI IN VISUAL MONITORING, BY REGION, 2017–2025 (USD MILLION)
TABLE 57 MARKET FOR AI IN PRICE OPTIMIZATION, BY REGION, 2017–2025 (USD MILLION)
TABLE 58 MARKET FOR AI IN LOCATION-BASED MARKETING, BY REGION, 2017–2025 (USD MILLION)
TABLE 59 MARKET FOR AI IN SELF-CHECKOUT SYSTEMS, BY REGION, 2017–2025 (USD MILLION)
TABLE 60 MARKET FOR AI, BY REGION, 2017–2025 (USD MILLION)
TABLE 61 MARKET, BY APPLICATION, 2017–2025 (USD MILLION)
TABLE 62 MARKET, BY RETAIL OFFERING, 2017–2025 (USD MILLION)
TABLE 63 MARKET, BY REGION, 2017–2025 (USD MILLION)
TABLE 64 MARKET IN NORTH AMERICA, BY COUNTRY, 2017–2025 (USD MILLION)
TABLE 65 MARKET IN EUROPE, BY COUNTRY, 2017–2025 (USD MILLION)
TABLE 66 MARKET IN APAC, BY COUNTRY, 2017–2025 (USD MILLION)
TABLE 67 MARKET IN ROW, BY REGION, 2017–2025 (USD MILLION)
TABLE 68 RANKING ANALYSIS OF KEY COMPANIES FOR DIGITAL SIGNAGE SOLUTIONS
TABLE 69 RANKING ANALYSIS OF KEY COMPANIES FOR SMART LABELS
TABLE 70 RANKING ANALYSIS OF KEY COMPANIES FOR SMART PAYMENT SYSTEMS
TABLE 71 RANKING ANALYSIS OF KEY COMPANIES FOR INTELLIGENT SYSTEMS
TABLE 72 RANKING ANALYSIS OF KEY COMPANIES FOR ROBOTICS
TABLE 73 RANKING ANALYSIS OF KEY COMPANIES FOR ANALYTICS
TABLE 74 PRODUCT LAUNCHES AND DEVELOPMENTS, 2017–2019
TABLE 75 EXPANSIONS, 2017–2020
TABLE 76 PARTNERSHIPS, AGREEMENT, JOINT VENTURES, AND COLLABORATIONS, 2017–2020
TABLE 77 ACQUISITIONS, 2019
LIST OF FIGURES (55 FIGURES)
FIGURE 1 SMART RETAIL MARKET: RESEARCH DESIGN
FIGURE 2 MARKET SIZE ESTIMATION METHODOLOGY: APPROACH 1 BOTTOM-UP (SUPPLY SIDE): REVENUE GENERATED BY COMPANIES FROM SALES OF SMART RETAIL SOLUTIONS
FIGURE 3 MARKET SIZE ESTIMATION METHODOLOGY: APPROACH 1 BOTTOM-UP (SUPPLY SIDE): ILLUSTRATIVE EXAMPLE OF COMPANY OPERATING IN SMART RETAIL MARKET
FIGURE 4 MARKET SIZE ESTIMATION METHODOLOGY: APPROACH 2 – BOTTOM UP (DEMAND SIDE): REGIONS COVERED UNDER SMART RETAIL MARKET
FIGURE 5 MARKET SIZE ESTIMATION METHODOLOGY: BOTTOM-UP APPROACH
FIGURE 6 MARKET SIZE ESTIMATION METHODOLOGY: TOP-DOWN APPROACH
FIGURE 7 DATA TRIANGULATION
FIGURE 8 SMART PAYMENT SYSTEMS SEGMENT TO ACCOUNT FOR LARGEST SIZE OF SMART RETAIL MARKET FROM 2020 TO 2025
FIGURE 9 SMART FITTING ROOMS SEGMENT OF SMART RETAIL MARKET TO GROW AT HIGHEST CAGR FROM 2020 TO 2025
FIGURE 10 FAST-MOVING CONSUMER GOODS SEGMENT OF SMART RETAIL MARKET TO GROW AT HIGHEST CAGR FROM 2020 TO 2025
FIGURE 11 NORTH AMERICA TO ACCOUNT FOR LARGEST SHARE OF SMART RETAIL MARKET IN 2025
FIGURE 12 INCREASING ADOPTION OF ROBOTICS AND AUTOMATION IN RETAIL SECTOR TO SPUR GROWTH OF SMART RETAIL MARKET FROM 2020 TO 2025
FIGURE 13 NORTH AMERICA TO RECORD LARGEST SHARE IN SMART RETAIL MARKET IN 2019 AND 2025
FIGURE 14 SMART PAYMENT SYSTEMS AND FOOT-TRAFFIC MONITORING SEGMENTS TO ACCOUNT FOR LARGEST SHARES OF SMART RETAIL MARKET IN 2025
FIGURE 15 MARKET IN CHINA TO GROW AT HIGHEST CAGR FROM 2020 TO 2025
FIGURE 16 MARKET: DRIVERS, RESTRAINTS, OPPORTUNITIES, AND CHALLENGES
FIGURE 17 MARKET: DRIVERS AND THEIR IMPACT
FIGURE 18 MARKET: RESTRAINTS AND THEIR IMPACT
FIGURE 19 MARKET: OPPORTUNITIES AND THEIR IMPACT
FIGURE 20 MARKET: CHALLENGES AND THEIR IMPACT
FIGURE 21 VALUE CHAIN OF SMART RETAIL MARKET
FIGURE 22 MARKET, BY SYSTEM
FIGURE 23 ROBOTICS SEGMENT IS EXPECTED TO WITNESS HIGHEST CAGR IN SMART RETAIL MARKET FROM 2020 TO 2025
FIGURE 24 HYBRID SEGMENT OF SMART BEACON MARKET EXPECTED TO GROW AT HIGH CAGR FROM 2020 TO 2025
FIGURE 25 HEAD-MOUNTED DISPLAYS SEGMENT OF MARKET FOR AUGMENTED REALITY SOLUTIONS TO GROW AT HIGHEST CAGR FROM 2020 TO 2025
FIGURE 26 SHELF AUDITING SEGMENT OF MARKET FOR TO GROW AT HIGH CAGR FROM 2020 TO 2025
FIGURE 27 MARKET, BY APPLICATION
FIGURE 28 SMART FITTING ROOMS SEGMENT OF SMART RETAIL MARKET PROJECTED TO GROW AT HIGHEST CAGR FROM 2020 TO 2025
FIGURE 29 MARKET, BY RETAIL OFFERING
FIGURE 30 FAST-MOVING CONSUMER GOODS SEGMENT OF SMART RETAIL MARKET PROJECTED TO GROW AT HIGHEST CAGR FROM 2020 TO 2025
FIGURE 31 TECHNOLOGIES USED FOR SMART RETAIL OPERATIONS
FIGURE 32 REGIONAL SEGMENTATION OF MARKET
FIGURE 33 SMART RETAIL MARKET IN APAC TO GROW AT HIGHEST CAGR FROM 2020 TO 2025
FIGURE 34 NORTH AMERICA: MARKET SNAPSHOT
FIGURE 35 EUROPE: MARKET SNAPSHOT
FIGURE 36 APAC: MARKET SNAPSHOT
FIGURE 37 MARKET IN CHINA TO GROW AT HIGHEST CAGR FROM 2020 TO 2025
FIGURE 38 COMPANIES ADOPTED PRODUCT LAUNCHES AND DEVELOPMENTS AS KEY GROWTH STRATEGY FROM JANUARY 2017 TO JANUARY 2020
FIGURE 39 RANKING OF TOP 5 PLAYERS IN SMART RETAIL MARKET
FIGURE 40 MARKET (GLOBAL) COMPETITIVE LEADERSHIP MAPPING, 2019
FIGURE 41 MARKET EVALUATION FRAMEWORK- PRODUCT LAUNCHES AND DEVELOPMENTS FUELED GROWTH AND INNOVATIONS FROM 2017 TO 2020
FIGURE 42 IBM: COMPANY SNAPSHOT
FIGURE 43 INTEL CORPORATION: COMPANY SNAPSHOT
FIGURE 44 CISCO SYSTEMS INC.: COMPANY SNAPSHOT
FIGURE 45 NXP SEMICONDUCTORS N.V.: COMPANY SNAPSHOT
FIGURE 46 MICROSOFT: COMPANY SNAPSHOT
FIGURE 47 HUAWEI INVESTMENT & HOLDING CO., LTD.: COMPANY SNAPSHOT
FIGURE 48 NVIDIA CORPORATION: COMPANY SNAPSHOT
FIGURE 49 SAMSUNG ELECTRONICS: COMPANY SNAPSHOT
FIGURE 50 GOOGLE INC.: COMPANY SNAPSHOT
FIGURE 51 PTC INC.: COMPANY SNAPSHOT
FIGURE 52 AMAZON.COM, INC.: COMPANY SNAPSHOT
FIGURE 53 ALIBABA GROUP HOLDING LIMITED: COMPANY SNAPSHOT
FIGURE 54 WALMART INC.: COMPANY SNAPSHOT
FIGURE 55 ALBERT HEIJN BV (AHOLD DELHAIZE): COMPANY SNAPSHOT
The study involved four major activities for estimating the size of the smart retail market. Exhaustive secondary research was carried out to collect information relevant to the market, the peer market, and the parent market. Primary research was undertaken to validate these findings, assumptions, and sizing with the industry experts across the value chain of the smart retail ecosystem. Both top-down and bottom-up approaches were employed to estimate the complete market size. These were followed by the market breakdown and data triangulation methods that were used to estimate the size of the different segments and subsegments of the market.
Secondary Research
The research methodology used to estimate and forecast the size of the smart retail market began with capturing data related to the revenues of key vendors in the market through secondary research. This study involved the extensive use of secondary sources, directories, and databases (such as Hoovers, Bloomberg Businessweek, Factiva, and OneSource) to identify and collect information useful for a technical, market-oriented, and commercial study of the smart retail market. Vendor offerings were taken into consideration to determine the market segmentation. The entire research methodology included the study of the annual reports, press releases, and investor presentations of companies; white papers; and certified publications and articles by recognized authors, directories, and databases.
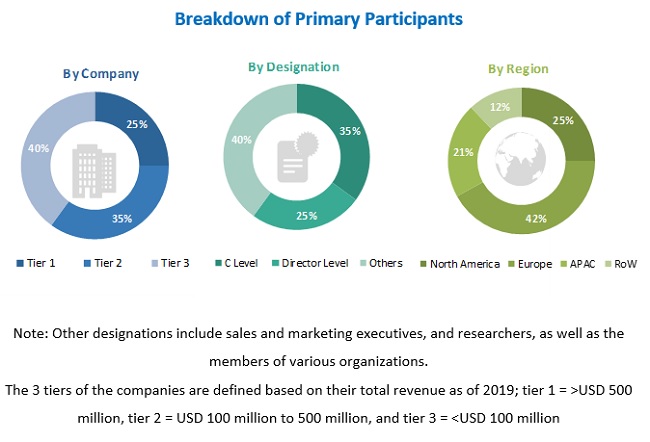
Primary Research
The smart retail market comprises several stakeholders such as the suppliers of systems and technology providers. The demand side of this market is characterized by the end users of smart retail systems. The supply side is characterized by advancements carried out in different smart retail systems such as digital signage solutions, smart labels, smart payment systems, AR and VR solutions, POS solutions, intelligent vending machines, smart carts, robotics, and analytics. Various primary sources from both the supply and demand sides of the market were interviewed to obtain qualitative and quantitative information. Following is the breakdown of primary respondents.
To know about the assumptions considered for the study, download the pdf brochure
Market Size Estimation
Both top-down and bottom-up approaches were used to estimate and validate the size of the smart retail market and its segments. The research methodology used to estimate the market size included the following:
- Key players in the market were identified through extensive secondary research.
- The supply chain of the manufacturing industry and the size of the smart retail market, in terms of value and volume, were determined through primary and secondary research processes.
- All percentage shares, splits, and breakdowns were determined using secondary sources and verified through primary sources.
Data Triangulation
After arriving at the overall market size from the market size estimation process explained above, the total market has been split into several segments and subsegments. To complete the overall market engineering process and arrive at the exact statistics for all segments and subsegments, the market breakdown and data triangulation procedures have been employed wherever applicable. The data has been triangulated by studying various factors and trends from both the demand and supply sides. Along with this, the market has been validated using both top-down and bottom-up approaches.
Research Objectives
- To define and describe the global smart retail market segmented based on system, application, and retail offering
- To forecast the market size in terms of value for various segments with regard to the following regions: North America, Europe, APAC, and RoW
- To provide detailed information regarding the major factors influencing the growth of the market (drivers, restraints, opportunities, and industry-specific challenges)
- To strategically analyze the micromarkets1 with respect to individual growth trends, future prospects, and contribution to the total market
- To analyze the opportunities in the market for stakeholders by identifying the high-growth segments of the global smart retail market
- To strategically profile the key players and comprehensively analyze their market rankings and core competencies2, along with detailing the competitive landscape for the market leaders
- To track and analyze competitive developments such as product launches & product developments, expansions, joint ventures, partnerships, collaborations, agreements, and acquisitions in the global smart retail market
Available Customizations
Along with the market data, MarketsandMarkets offers customizations according to the specific requirements of companies. The following customization options are available for the report:
Company Information
- Detailed analysis and profiling of additional market players (up to 5)
Critical Questions
- What are the new application areas being explored by the providers of smart retail systems?
- Who are the key players in the smart retail market, and how intense is the competition in this market?


Growth opportunities and latent adjacency in Smart Retail Market