Smart Waste Management Market by Solution (Asset Management, Analytics & Reporting, Fleet Tracking & Monitoring, Mobile Workforce Management), Service (Consulting, Managed), Application (Retail, Manufacturing, Healthcare) - Global Forecast to 2021


[131 Pages Report] The Smart Waste Management market is estimated to grow from USD 1.08 Billion in 2016 to USD 2.37 Billion by 2021, at a Compound Annual Growth Rate (CAGR) of 16.9% during 2016-2021
The major growth drivers of the market include the increasing number of smart city initiatives and need for adherence to strict regulatory mandates. It is The year 2015 has been considered as the base year for the study, while the forecast period is from 2016 to 2021.
The objective of the report is to define, describe, and forecast the smart waste management market on the basis of solutions, services, applications, and regions and also to provide detailed information regarding the major factors influencing the growth of the market (drivers, restraints, opportunities, and challenges).
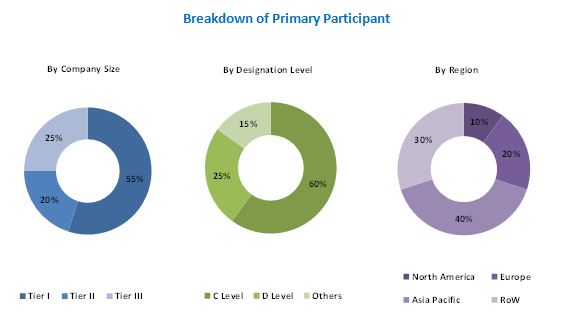
The research methodology used to estimate and forecast the smart waste management market begins with capturing data on key vendor revenues through secondary research. The vendor offerings are also taken into consideration to determine market segmentation. The bottom-up procedure was employed to arrive at the overall market size of the global market from the revenue of the key players in the market. After arriving at the overall market size, the total market was split into several segments and subsegments, which were then verified through primary research by conducting extensive interviews with key industry personnel, such as CEOs, VPs, directors, and executives. The breakdown of the profiles of primary discussion participants is depicted in the below figure:
To know about the assumptions considered for the study, download the pdf brochure
The target audiences of the market report are given below:
- Government and regulatory bodies
- Smart waste solution vendors
- Municipal corporations
- Waste management associations
- Platform providers
- Network solution providers
- Consulting firms
- System integrators
- Managed service providers
�The study answers several questions for the stakeholders; primarily, which market segments to focus in the next two to five years for prioritizing the efforts and investments.�
Scope of the Smart Waste Management Market Report
|
Report Metrics |
Details |
|
Market size available for years |
2014�2021 |
|
Base year considered |
2015 |
|
Forecast period |
2016�2021 |
|
Forecast units |
Billion (USD) |
|
Segments covered |
Solution (Asset Management, Analytics & Reporting, Fleet Tracking & Monitoring, Mobile Workforce Management), Service (Consulting, Managed), Application (Retail, Manufacturing, Healthcare). |
|
Geographies covered |
North America, Europe, APAC, Latin America, and MEA |
|
Companies covered |
IBM Corporation, SAP SE, Waste Management, Inc., Enevo Oy, BigBelly Solar, Inc., SmartBin, Ecube Labs, Urbiotica SL, WAVIoT, and Pepperl+Fuchs. |
Market by Solution:
- Optimization Solutions
- Analytics and Reporting Solutions
- Asset Management
- Network Management
- Others
Smart Waste Management Market by Service:
- Professional Services
- Managed Services
Market by Application:
- Food & Retail
- Construction
- Manufacturing & Industrial
- HealthCare
- Municipalities
- Colleges & Universities
Smart Waste Management Market by Region:
- North America
- Europe
- Middle East and Africa (MEA)
- Asia-Pacific (APAC)
- Latin America
Available Customizations
With the given market data, MarketsandMarkets offers customizations as per the company�s specific needs. The following customization options are available for the report:
Geographic Analysis
- Further breakdown of the North American market
- Further breakdown of the European market
- Further breakdown of the APAC market
- Further breakdown of the MEA market
- Further breakdown of the Latin American smart waste management market
Company Information
- Detailed analysis and profiling of additional market players
The smart waste management market report has been segmented on the basis of solutions, services, applications, and regions. Major solutions in the market are optimization solutions, analytics & reporting solutions, asset management, network management, and others. The analytics and reporting solutions segment is expected to hold the largest share of the smart waste management solution market. The key trend contributing to this market growth is the increased usage of connected devices that results in massive data deluge.
Among the services, the professional services segment holds the largest share of the smart waste management services market. The primary driving force for the adoption of professional services is the complexity of smart solutions infrastructure which leads to increased need for consulting services. The managed services segment is projected to witness the highest growth rate due to the growing need of organizations to attain economies of scale and comply with different regulatory compliances across the globe.
Major application areas for smart waste management are food & retail, construction, manufacturing & industrial, healthcare, municipalities, and colleges & universities. The manufacturing and industrial application segment is expected to hold the largest share of the smart waste management application market due to the generation of large quantities of hazardous waste that have different disposal regulations.
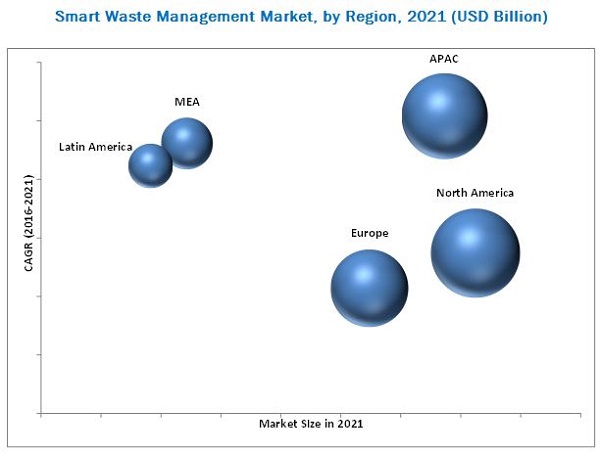
The global smart waste management report segments the market on the basis of regions into North America, Europe, Asia-Pacific (APAC), Middle East and Africa (MEA), and Latin America. The North American region is expected to be the largest revenue generating region for smart waste management solution and service vendors owing to the early adoption of IoT and strict regulations in the region. APAC, on the other hand, is projected to grow at the highest CAGR between 2016 and 2021 owing to increasing technological adoption in the emerging economies.
The lack of large scale funding and low levels of operational efficiency in developing economies are hindering the growth of the smart waste management market. Lack of awareness about the importance of waste management adds to the challenges in the adoption of smart waste management solutions.
The smart waste management ecosystem comprises solution vendors, such as IBM Corporation, SAP SE, Waste Management, Inc., Enevo Oy, BigBelly Solar, Inc., SmartBin, Ecube Labs, Urbiotica SL, WAVIoT, and Pepperl+Fuchs; service providers; system integrators; and end users. Other stakeholders of the smart waste management market include service providers, consulting service providers, IT service providers, resellers, enterprise users, and technology providers. The companies are taking different measures such as mergers & acquisitions, partnerships & collaborations, and product development to increase their share in the market. These activities have also been tracked and mentioned in the report.
Frequently Asked Questions (FAQ):
What is Smart Waste Management?
The smart waste management market includes solutions and services that are provided to minimize the cost of operations in waste management by the process of automation through smart technologies such as analytics and Internet of Things (IoT). It helps in scheduling the waste pick-up by monitoring the fill level of the smart dustbins and containers through the use of sensors and providing real-time information and location data through Geographic Information System (GIS).
These containers and bins are connected using sensors and Radio Frequency Identification (RFID) and the information obtained is analyzed and operations are controlled through web portals and dashboards thereby helping in reducing fuel and unnecessary occupancy of workforce.
Who are the top vendors in the smart waste management market?
What are the different types of smart waste management solutions?
What is the market size of smart waste management?
What are the benefits of smart waste management?
Following are the few benefits of smart waste management:
- It decreases traffic flow and consecutively noise due to less air pollution as result of less waste collection vehicles on the roads.
- It further reduces manpower requirements to handle the garbage collection process.
- It helps administration to generate extra revenue by advertisements on smart devices.
To speak to our analyst for a discussion on the above findings, click Speak to Analyst
Table of Contents
1 Introduction (Page No. - 14)
1.1 Objectives of the Report
1.2 Market Definition
1.3 Market Scope
1.3.1 Markets Covered
1.3.2 Years Considered in the Report
1.4 Currency
1.5 Limitations
1.6 Stakeholders
2 Research Methodology (Page No. - 17)
2.1 Introduction
2.1.1 Secondary Data
2.1.1.1 Key Data From Secondary Sources
2.1.2 Primary Data
2.1.2.1 Key Data From Primary Sources
2.1.2.2 Key Industry Insights
2.1.2.3 Breakdown of Primaries
2.2 Market Size Estimation
2.2.1 Bottom-Up Approach
2.2.2 Top-Down Approach
2.3 Market Breakdown and Data Triangulation
2.4 Research Assumptions and Limitations
2.4.1 Assumptions
2.4.2 Limitations
3 Executive Summary (Page No. - 26)
4 Premium Insights (Page No. - 30)
4.1 Attractive Market Opportunities in the Smart Waste Management Market
4.2 Market By Region (2016 vs 2021)
4.3 Market By Application, 2016-2021
4.4 Market Regions vs Solutions, 2016�2021
4.5 Lifecycle Analysis, By Region 2016
4.6 Market Investment Scenario
5 Market Overview (Page No. - 35)
5.1 Introduction
5.2 Market Evolution
5.3 Smart Waste Management Market Segmentation
5.3.1 By Solution
5.3.2 By Service
5.3.3 By Application
5.3.4 By Region
5.4 Market Dynamics
5.4.1 Drivers
5.4.1.1 Need for Energy and Time Efficiency
5.4.1.2 Need to Adhere to the Regulatory Compliances
5.4.1.3 Increasing Smart City Initiatives
5.4.2 Restraints
5.4.2.1 Lack of Proper Funding and High Initial Cost
5.4.2.2 Low Level of Operational Efficiency and Technology Infrastructure in the Emerging Countries
5.4.3 Opportunities
5.4.3.1 Evolution of Internet of Things and Smart Technology
5.4.3.2 Environmental Concerns and Green Initiatives
5.4.4 Challenges
5.4.4.1 Lack of Awareness Regarding Smart Waste Management Solutions
6 Industry Trends (Page No. - 44)
6.1 Introduction
6.2 Value Chain Analysis
6.3 Strategic Benchmarking
7 Smart Waste Management Market Analysis, By Solution (Page No. - 46)
7.1 Introduction
7.2 Optimization Solutions
7.2.1 Fleet Tracking and Monitoring
7.2.2 Remote Device Monitoring
7.2.3 Mobile Workforce Management
7.3 Analytics and Reporting Solutions
7.3.1 Advanced Analytics
7.3.2 Data Management
7.3.3 Dashboards and Platforms
7.4 Asset Management
7.5 Network Management
7.6 Others
8 Smart Waste Management Market Analysis, By Service (Page No. - 58)
8.1 Introduction
8.2 Professional Services
8.2.1 Consulting Services
8.2.2 Integration and Deployment Services
8.2.3 Support and Maintenance Services
8.3 Managed Services
9 Smart Waste Management Market Analysis, By Application (Page No. - 65)
9.1 Introduction
9.2 Manufacturing and Industrial
9.3 Food and Retail
9.4 Municipalities
9.5 Construction
9.6 Healthcare
9.7 Colleges and Universities
10 Geographic Analysis (Page No. - 71)
10.1 Introduction
10.2 North America
10.3 Europe
10.4 Asia-Pacific (APAC)
10.5 Middle East and Africa (MEA)
10.6 Latin America
11 Competitive Landscape (Page No. - 94)
11.1 Overview
11.2 Portfolio Comparison
11.3 Competitive Situation and Trends
11.3.1 Partnerships and Collaborations
11.3.2 Business Expansions
11.3.3 New Product Launches
11.3.4 Mergers and Acquisitions
12 Company Profiles (Page No. - 100)
12.1 Introduction
(Business Overview, Products & Services, Key Insights, Recent Developments, SWOT Analysis, Ratio Analysis, MnM View)*
12.2 IBM Corporation
12.3 SAP SE
12.4 Waste Management, Inc.
12.5 Enevo OY
12.6 Bigbelly Solar, Inc.
12.7 Smartbin
12.8 Ecube Labs Co., Ltd.
12.9 Urbi�tica, S.L
12.10 Waviot
12.11 Pepperl+Fuchs GmbH
*Details on Business Overview, Products & Services, Key Insights, Recent Developments, SWOT Analysis, MnM View Might Not Be Captured in Case of Unlisted Companies.
13 Appendix (Page No. - 123)
13.1 Insight of Industry Experts
13.2 Discussion Guide
13.3 Knowledge Store: Marketsandmarkets� Subscription Portal
13.4 Introducing RT: Real-Time Market Intelligence
13.5 Available Customizations
13.6 Related Reports
List of Tables (71 Tables)
Table 1 Smart Waste Management Market Size, By Component, 2014�2021 (USD Million)
Table 2 Market Size, By Solution, 2014�2021 (USD Million)
Table 3 Smart Waste Management Solution Market Size, By Region, 2014�2021 (USD Million)
Table 4 Optimization Solutions: Market Size, 2014�2021 (USD Million)
Table 5 Optimization Solutions: Market Size, By Region 2014�2021 (USD Million)
Table 6 Fleet Tracking and Monitoring: Market Size, By Region, 2014�2021 (USD Million)
Table 7 Remote Device Monitoring: Market Size, By Region, 2014�2021 (USD Million)
Table 8 Mobile Workforce Management: Market Size, By Region, 2014�2021 (USD Million)
Table 9 Analytics and Reporting Solutions: Market Size, 2014�2021 (USD Million)
Table 10 Analytics and Reporting Solutions: Market Size, By Region 2014�2021 (USD Million)
Table 11 Advanced Analytics: Smart Waste Management Market Size, By Region, 2014�2021 (USD Million)
Table 12 Data Management: Market Size, By Region, 2014�2021 (USD Million)
Table 13 Dashboards and Platforms: Market Size, By Region, 2014�2021 (USD Million)
Table 14 Asset Management: Market Size, By Region, 2014�2021 (USD Million)
Table 15 Network Management: Market Size, By Region, 2014�2021 (USD Million)
Table 16 Others: Market Size, By Region, 2014�2021 (USD Million)
Table 17 Smart Waste Management Market Size, By Service, 2014-2021 (USD Million)
Table 18 Smart Waste Management Services Market Size, By Region, 2014�2021 (USD Million)
Table 19 Professional Services: Market Size, 2014�2021 (USD Million)
Table 20 Professional Services: Market Size, By Region, 2014�2021 (USD Million)
Table 21 Consulting Services: Market Size, By Region, 2014�2021 (USD Million)
Table 22 Integration and Deployment Services: Market Size, By Region, 2014�2021 (USD Million)
Table 23 Support and Maintenance Services: Market Size, By Region, 2014�2021 (USD Million)
Table 24 Managed Services: Market Size, By Region, 2014�2021 (USD Million)
Table 25 Smart Waste Management Market Size, By Application, 2014�2021 (USD Million)
Table 26 Manufacturing and Industrial: Market Size, By Region, 2014�2021 (USD Million)
Table 27 Food and Retail: Market Size, By Region, 2014�2021 (USD Million)
Table 28 Municipalities: Market Size, By Region, 2014�2021 (USD Million)
Table 29 Construction: Market Size, By Region, 2014�2021 (USD Million)
Table 30 Healthcare: Market Size, By Region, 2014�2021 (USD Million)
Table 31 Colleges and Universities: Market Size, By Region, 2014�2021 (USD Million)
Table 32 Smart Waste Management Market Size, By Region, 2014�2021 (USD Million)
Table 33 North America: Market Size, By Component, 2014�2021 (USD Million)
Table 34 North America: Market Size, By Solution, 2014�2021 (USD Million)
Table 35 North America: Optimization Solution Market Size, By Type, 2014�2021 (USD Million)
Table 36 North America: Analytics and Reporting Solution Market Size, By Type, 2014�2021 (USD Million)
Table 37 North America: Market Size, By Service, 2014�2021 (USD Million)
Table 38 North America: Professional Services Market Size, By Type, 2014�2021 (USD Million)
Table 39 North America: Smart Waste Management Market Size, By Application, 2014�2021 (USD Million)
Table 40 Europe: Market Size, By Component, 2014�2021 (USD Million)
Table 41 Europe: Market Size, By Solution, 2014�2021 (USD Million)
Table 42 Europe: Optimization Solution Market Size, By Type, 2014�2021 (USD Million)
Table 43 Europe: Analytics and Reporting Solution Market Size, By Type, 2014�2021 (USD Million)
Table 44 Europe: Market Size, By Service, 2014�2021 (USD Million)
Table 45 Europe: Professional Services Market Size, By Type, 2014�2021 (USD Million)
Table 46 Europe: Market Size, By Application, 2014�2021 (USD Million)
Table 47 Asia-Pacific: Market Size, By Component, 2014�2021 (USD Million)
Table 48 Asia-Pacific: Market Size, By Solution, 2014�2021 (USD Million)
Table 49 Asia-Pacific: Optimization Solution Market Size, By Type, 2014�2021 (USD Million)
Table 50 Asia-Pacific: Analytics and Reporting Solution Market Size, By Type, 2014�2021 (USD Million)
Table 51 Asia-Pacific: Market Size, By Service, 2014�2021 (USD Million)
Table 52 Asia-Pacific: Professional Services Market Size, By Type, 2014�2021 (USD Million)
Table 53 Asia-Pacific: Market Size, By Application, 2014�2021 (USD Million)
Table 54 Middle East and Africa: Smart Waste Management Market Size, By Component, 2014�2021 (USD Million)
Table 55 Middle East and Africa: Market Size, By Solution, 2014�2021 (USD Million)
Table 56 Middle East and Africa: Optimization Solution Market Size, By Type, 2014�2021 (USD Million)
Table 57 Middle East and Africa: Analytics and Reporting Solutions Market Size, By Type, 2014�2021 (USD Million)
Table 58 Middle East and Africa: Market Size, By Service, 2014�2021 (USD Million)
Table 59 Middle East and Africa: Professional Services Market Size, By Type, 2014�2021 (USD Million)
Table 60 Middle East and Africa: Market Size, By Application, 2014�2021 (USD Million)
Table 61 Latin America: Market Size, By Component, 2014�2021 (USD Million)
Table 62 Latin America: Market Size, By Solution, 2014�2021 (USD Million)
Table 63 Latin America: Optimization Solution Market Size, By Type, 2014�2021 (USD Million)
Table 64 Latin America: Analytics and Reporting Solutions Market Size, By Type, 2014�2021 (USD Million)
Table 65 Latin America: Market Size, By Service, 2014�2021 (USD Million)
Table 66 Latin America: Professional Services Market Size, By Type, 2014�2021 (USD Million)
Table 67 Latin America: Smart Waste Management Market Size, By Application, 2014�2021 (USD Million)
Table 68 Partnerships and Collaborations, 2014�2016
Table 69 Business Expansions, 2014�2016
Table 70 New Product Launches, 2014�2016
Table 71 Mergers and Acquisitions, 2014�2016
List of Figures (41 Figures)
Figure 1 Global Smart Waste Management Market: Research Design
Figure 2 Market Size Estimation Methodology: Bottom-Up Approach
Figure 3 Market Size Estimation Methodology: Top-Down Approach
Figure 4 Market Breakdown and Data Triangulation
Figure 5 Smart Waste Management Market is Expected to Witness High Growth During the Forecast Period
Figure 6 Top Three Segments for the Market During 2016�2021
Figure 7 North America is Expected to Hold the Largest Market Share in 2016
Figure 8 Regulatory Compliance is Driving the Market Towards Growth
Figure 9 Asia-Pacific is Expected to Witness the Highest Growth Rate During the Forecast Period
Figure 10 Healthcare Segment to Grow at the Highest Rate in the Smart Waste Management Application Market
Figure 11 Analytics and Reporting Solutions Segment is Expected to Lead the Smart Waste Management Market in Terms of Market Share in 2016
Figure 14 Evolution of Smart Waste Management Market
Figure 15 Market Segmentation: By Solution
Figure 16 Market Segmentation: By Service
Figure 17 Market Segmentation: By Application
Figure 18 Market Segmentation: By Region
Figure 19 Market: Drivers, Restraints, Opportunities, and Challenges
Figure 20 Market: Value Chain Analysis
Figure 21 Companies Adopt Different Strategies to Gain Competitive Advantage
Figure 22 Analytics and Reporting Solutions Segment is Expected to Lead the Smart Waste Management Solutions Market in Terms of Market Size in 2016
Figure 23 Majority of the Market is Expected to Be Dominated By Professional Services During the Forecast Period
Figure 24 Healthcare Segment Holds the Maximum Opportunity for Growth During the Forecast Period
Figure 25 Asia-Pacific: an Attractive Destination for Smart Waste Management Market, 2016�2021
Figure 26 Asia-Pacific has the Highest Growth Rate From 2016 to 2021
Figure 27 Regional Snapshot: Asia-Pacific as A Hotspot During the Period 2016�2021
Figure 28 North America Market Snapshot
Figure 29 Asia-Pacific Market Snapshot
Figure 30 Companies Adopted Partnerships, Agreements, and Collaborations as the Key Growth Strategy Between 2014 and 2016
Figure 31 Smart Waste Management Market: Portfolio Comparison
Figure 32 Market Evaluation Framework
Figure 33 Battle for Market Share: New Product Launch is the Key Strategy Adopted By Companies in the Market Between 2014 and 2016
Figure 34 IBM Corporation: Company Snapshot
Figure 35 IBM Corporation: SWOT Analysis
Figure 36 SAP SE: Company Snapshot
Figure 37 SAP SE: SWOT Analysis
Figure 38 Waste Management, Inc.: Company Snapshot
Figure 39 Waste Management, Inc.: SWOT Analysis
Figure 40 Enevo OY: SWOT Analysis
Figure 41 Bigbelly Solar, Inc.: SWOT Analysis


Growth opportunities and latent adjacency in Smart Waste Management Market
Understand the smart waste management System.
Analyse the market trends of a recycling plant and landflll in Kenya.