Software-Defined Security Market by Component (Solution and Services), Enforcement Point (Virtual Machines, Network Security Gateway), Deployment Mode (Cloud and On-Premise), End User (Enterprise, Telecom/Cloud Service Provider) - Global Forecast to 2021


[158 Pages Report] MarketsandMarkets predicts the global Software-Defined Security market to grow from USD 1.59 Billion in 2016 to USD 6.76 Billion by 2021, at a Compound Annual Growth Rate (CAGR) of 33.6%. 2015 has been considered as the base year while the forecast period is 2016-2021.
Request for Customization to get the global Software-Defined Security market forecasts to 2023
This report is aimed to estimate the market size and future growth potential and opportunities in the global Software-Defined Security market across different possible segments such as components, enforcement point, solution, services, deployment mode, end user and regions. Each sub-segment is thoroughly analyzed with respect to different trends and factors responsible for growth of the market and to deliver comprehensive information regarding the major aspects influencing the development of the market (drivers, restraints, opportunities, and industry specific challenges). The report offers competitive intelligence from market analysis and devise revenue growth strategies from the market size and forecast statistics.
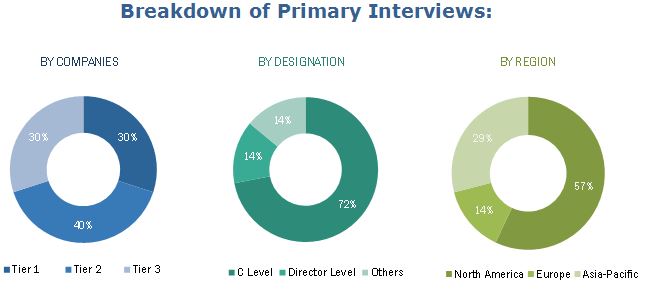
The research methodology used to estimate and forecast the global Software-Defined Security market begins with the collection and analysis of data on key vendor revenues through secondary research. The vendor�s product and solution offerings are also analyzed to determine the market segmentation. The bottom-up procedure is used to arrive at the total market size of the global SDSec market from the revenue of key players in the market. After estimating the total market size, it is split into the segments and sub-segments which are then verified through primary research by conducting extensive interviews with key people, such as CEOs, VPs, Directors and executives. This data triangulation and market breakdown procedures were employed to complete the overall market engineering process and arrive at the accurate statistics for all segments and sub-segments. The breakdown of profiles of primary is depicted in the below figure:
To know about the assumptions considered for the study, download the pdf brochure
The SDSec ecosystem comprises vendors, such as are Check Point Technologies (Israel), Cisco Systems (California), Intel Corporation (California), VMware, Inc. (California), Symantec Corporation (California), EMC Corporation (Massachusetts), Fortinet, Inc. (California), Juniper Networks (California) and Palo Alto Networks (California) and various others such as service providers and enterprises. Other stakeholders of the Software-Defined Security market include those who integrate the SDSec solutions and sell them to end users to cater to their unique business requirements.
Target Audience:
- SDSec solution providers
- Telecommunication service providers
- Cloud service providers
- Security software vendors
- Solution integrators
- Consultants and IT security agencies
Get online access to the report on the World's First Market Intelligence Cloud
Request Sample Scope of the Report
:

The research report categorizes the Software-Defined Security market to forecast the revenues and analyze the trends in each of the following sub-markets:
On the basis of Components:
- Solutions
- Services
On the basis of Enforcement Point:
- Application and Mobile Device Security
- Virtual Machines (VMs)/Server/Storage Security
- Network Security Gateways
- Others (Cloud, Database, and Web)
On the basis of Solutions:
- Security Software
- Control Automation and Orchestration Solution
- Security Compliance and Policy Management
- Performance Management and Reporting
On the basis of Services:
- Support and Maintenance
- Training and Education
- Integration and Testing
- Consulting
On the basis of Deployment Mode:
- Cloud
- On Premise
On the basis of End User:
- Telecom Service Providers
- Cloud Service Providers
- Enterprises
On the basis of Regions:
- North America
- Europe
- Asia-Pacific (APAC)
- Middle East & Africa (MEA)
- Latin America
Available Customizations
With the given market data, MarketsandMarkets offers customizations as per the company�s specific needs. The following customization options are available for the report:
Product Analysis
Product matrix, which gives a detailed comparison of product portfolio of each company
Geographic Analysis
Further breakdown of the North American market into the U.S. and Canada
Further breakdown of the APAC market into India, China, and others
Company Information
Detailed analysis and profiling of additional market players (up to five)
Also early buyers will receive 10% customization on the Software-Defined Security market report or other related report. Under customization, further segmentation of regions into different countries can be provided.
The Software-Defined Security market size is expected to grow from USD 1.59 Billion in 2016 to USD 6.76 Billion by 2021, at an estimated Compound Annual Growth Rate (CAGR) of 33.6%. Major growth drivers of the SDSec market are need for policy-driven, scalable, and programmable security architecture; faster response against threats/risks and requirement for increased security; security staffing and budgeting constraints along with increasing surge in cloud services. These factors are expected to shape the future of the SDSec market.
The market in this report has been segmented into different enforcement points. Mobile device security; virtual machines/server security/ storage security; and network security gateways are expected to have the highest market share. Among these enforcement points, network security gateways are expected to lead due to the need for high privacy when it comes to communication.
The market consists of solutions. Control automation and orchestration solution is expected to grow at a higher CAGR. The increasing need for managing complex network�s security and agility are expected to remain the primary driver for the growth of the market.
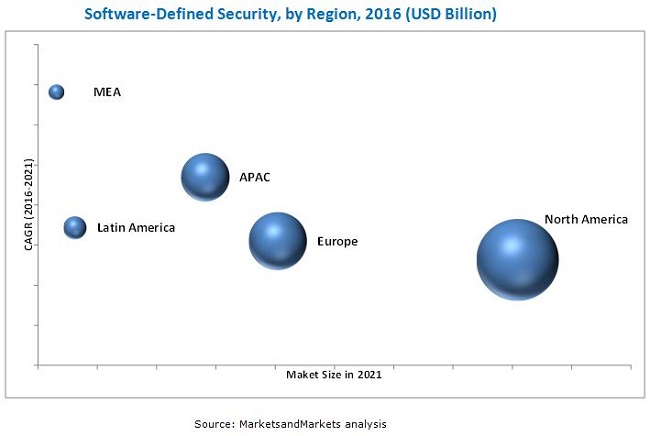
The global Software-Defined Security market has been segmented on the basis of regions into North America, Asia Pacific (APAC), Europe, Middle East and Africa (MEA), and Latin America, to provide a region-specific analysis in the report. North America occupies the largest share in the market while MEA is expected to grow with the highest CAGR. The awareness about the potential benefits of SDSec in MEA is expected to drive the market. Many companies are strategically adding resellers and distribution partners in their marketing channel in the region to leverage the potential market and increase their market reach.
The restraining factors of Software-Defined Security market are lack of industry standard and need for security awareness in virtualization environment. The SDSec security model is in the process of expansion and improvement. It is still being considered as a new technology under the umbrella of security solutions.
Major vendors that offer their products and services in this market are Check Point Software Technologies Ltd. (Tel Aviv, Israel), Cisco Systems, Inc. (California), Intel Corporation (California), VMware, Inc. (California), Symantec Corporation (California), EMC Corporation (Massachusetts), Fortinet, Inc. (California), Juniper Networks, Inc. (California), and Palo Alto Networks (California). The dominant players in the market include Intel Corporation and Symantec Corporation (California). The companies have adopted different types of organic and inorganic growth strategies such as new product launches, partnerships & collaborations, and mergers & acquisitions to expand their offerings in the SDSec market.
The market involves a large number of vendors such as security solutions providers. Players in this market have adopted various strategies to expand their global presence and increase their market shares. Partnerships, agreements, collaborations, acquisitions, expansions, and new product launches are some of the major strategies adopted by the market players to achieve growth in the Software-Defined Security market. The strategy of new product launches was the key strategy adopted by the industry players to achieve growth in the SDSec market.
To speak to our analyst for a discussion on the above findings, click Speak to Analyst
Table of Contents
1 Introduction (Page No. - 15)
1.1 Objective of the Study
1.2 Software-Defined Security Market Definition
1.3 Market Scope
1.3.1 Markets Covered
1.3.2 Years Considered
1.4 Currency
1.5 Limitations
1.6 Stakeholders
1.7 Key Takeaways
2 Research Methodology (Page No. - 19)
2.1 Software-Defined Security Market Size Estimation
2.2 Market Breakdown and Data Triangulation
2.2.1 Data From Secondary Sources
2.2.2 Data From Primary Sources
2.2.2.1 Key Industry Insights
2.2.3 Assumptions
3 Executive Summary (Page No. - 28)
4 Premium Insights (Page No. - 34)
4.1 Attractive Market Opportunities in the Market
4.2 Global Market By Solution
4.3 Global Software Defined Security Market
4.4 Lifecycle Analysis, By Region 2016
4.5 Global Market By Region
4.6 Region Wise Adoption Scenario
5 Market Overview (Page No. - 38)
5.1 Introduction
5.2 Software-Defined Security Market Segmentation
5.3 Market Segmentation
5.3.1 By Enforcement Point
5.3.2 By Component
5.3.3 By Deployment Mode
5.3.4 By End User
5.3.5 By Region
5.4 Market Dynamics
5.4.1 Drivers
5.4.1.1 Need for Policy-Driven, Scalable, and Programmable Security Architecture
5.4.1.2 Need for Faster Response and Increased Security
5.4.1.3 Upsurge in Cloud Services Adoption
5.4.1.4 Security Staffing and Budgeting Constraints
5.4.2 Restraints
5.4.2.1 Lack of Security Awareness in Virtualization Environment
5.4.2.2 Lack of Industry Standard
5.4.3 Opportunities
5.4.3.1 Growing Market for Sdn
5.4.3.2 Growing Spending By the Emerging Economies on Security Solutions
5.4.3.3 Need for Advanced Next-Generation Security Solutions
5.4.4 Challenge
5.4.4.1 Emergence of New, Advanced, and Sophisticated Threats
6 Industry Trends (Page No. - 46)
6.1 Introduction
6.2 Pillars of Software Defined Security
6.2.1 Abstraction
6.2.2 Automation
6.2.3 Orcestration
6.2.4 Scalability
6.2.5 Api Enabled
6.2.6 Architecture of Software Defined Security Model
6.2.7 Strategic Benchmarking
7 Software-Defined Security Market Analysis, By Enforcement Point (Page No. - 49)
7.1 Introduction
7.2 Application and Mobile Device Security
7.3 Virtual Machines/Server/Storage Security
7.4 Network Security Gateway
7.5 Others
8 Software Defined Security Market Analysis, By Component (Page No. - 58)
8.1 Introduction
8.2 Solutions
8.2.1 Security Software
8.2.1.1 Risk Analytics and Visualization
8.2.1.2 Access Control, Ids, and Ips
8.2.1.3 Data Loss Prevention
8.2.1.4 Others
8.2.2 Control Automation and Orchestration Solution
8.2.3 Security Compliance and Policy Management
8.2.4 Performance Management and Reporting
8.3 Services
8.3.1 Support and Maintenance
8.3.2 Training and Education
8.3.3 Integration and Testing
8.3.4 Consulting
9 Market Analysis, By Deployment Mode (Page No. - 73)
9.1 Introduction
9.2 Cloud
9.3 on Premises
10 Software Defined Security Market Analysis, By End User (Page No. - 77)
10.1 Introduction
10.2 Telecom Service Providers
10.3 Cloud Service Providers
10.4 Enterprises
10.4.1 Information Technology Enabled Services
10.4.2 Defense
10.4.3 Banking, Financial Services, and Insurance
10.4.4 Media and Entertainment
10.4.5 Government
10.4.6 Education
10.4.7 Healthcare
10.4.8 Others
11 Geographic Analysis (Page No. - 87)
11.1 Introduction
11.2 North America
11.3 Europe
11.4 Asia-Pacific
11.5 Middle East and Africa
11.6 Latin America
12 Competitive Landscape (Page No. - 108)
12.1 Overview
12.2 Competitive Situation and Trends
12.2.1 New Product Launches and Enhancements
12.2.2 Partnerships, Agreements, and Collaboration, 2013-2016
12.2.3 Mergers and Acquisitions, 2013-2016
12.2.4 Integrations and Expansions, 2013-2016
13 Company Profiles (Page No. - 115)
(Business Overview, Products & Services, Key Insights, Recent Developments, SWOT Analysis, MnM View)*
13.1 Introduction
13.2 Check Point Software Technologies Ltd.
13.3 Cisco Systems, Inc.
13.4 Intel Corporation
13.5 VMware, Inc.
13.6 Symantec Corporation
13.7 EMC Corporation
13.8 Fortinet, Inc.
13.9 Juniper Networks, Inc.
13.10 Palo Alto Networks
*Details on Business Overview, Products & Services, Key Insights, Recent Developments, SWOT Analysis, MnM View Might Not Be Captured in Case of Unlisted Companies.
14 Key Innovators (Page No. - 146)
14.1 Catbird Networks, Inc.
14.1.1 Business Overview
14.1.2 Strategies and Insights
14.2 Versa Networks, Inc.
14.2.1 Business Overview
14.2.2 Strategies and Insights
14.3 Certes Networks Inc.
14.3.1 Business Overview
14.3.2 Strategies and Insights
14.4 Hillstone Networks Inc.
14.4.1 Business Overview
14.4.2 Strategies and Insights
14.5 Cloudpassage, Inc.
14.5.1 Business Overview
14.5.2 Strategies and Insights
15 Appendix (Page No. - 149)
15.1 Industry Experts
15.2 Discussion Guide
15.3 Knowledge Store: Marketsandmarkets� Subscription Portal
15.4 Introducing RT: Real-Time Market Intelligence
15.5 Related Reports
List of Tables (95 Tables)
Table 1 Global Software-Defined Security Market Size and Growth Rate, 2014-2021 (USD Million, Y-O-Y %)
Table 2 Market Size, By Enforcement Point, 2014�2021 (USD Million)
Table 3 Application and Mobile Device Security: Market Size, By Region, 2014�2021 (USD Million)
Table 4 Application and Mobile Device Security: Market Size, By End User, 2014�2021 (USD Million)
Table 5 Application and Mobile Device Security: Market Size, By Enterprises, 2014�2021 (USD Million)
Table 6 VM/Server/Storage Security: Market Size, By Region, 2014�2021 (USD Million)
Table 7 VM/Server/Storage Security: Market Size, By End User, 2014�2021 (USD Million)
Table 8 VM/Server/Storage Security: Market Size, By Enterprises, 2014�2021 (USD Million)
Table 9 Network Security Gateway: Market Size, By Region, 2014�2021 (USD Million)
Table 10 Network Security Gateway: Market Size, By End User, 2014�2021 (USD Million)
Table 11 Network Security Gateway: Market Size, By Vertical, 2014�2021 (USD Million)
Table 12 Others: Market Size, By Region, 2014�2021 (USD Million)
Table 13 Others: Market Size, By End User, 2014�2021 (USD Million)
Table 14 Enterprises: Market Size, By Vertical, 2014�2021 (USD Million)
Table 15 Software-Defined Security Market Size, By Component, 2014�2021 (USD Million)
Table 16 Solutions: Market Size, By Type, 2014�2021 (USD Million)
Table 17 Security Software: Market Size, By Region, 2014�2021 (USD Million)
Table 18 Security Software: Market Size, By Type, 2014�2021 (USD Million)
Table 19 Control Automation and Orchestration Solution: Market Size, By Region, 2014�2021 (USD Million)
Table 20 Security Compliance and Policy Management: Market Size, By Region, 2014�2021 (USD Million)
Table 21 Performance Management and Reporting: Market Size, By Region, 2014�2021 (USD Million)
Table 22 Market Size, By Service, 2014�2021 (USD Million)
Table 23 Support and Maintenance: Market Size, By Region, 2014�2021 (USD Million)
Table 24 Support and Maintenance: Market Size, By End User, 2014�2021 (USD Million)
Table 25 Support and Maintenance: Market Size, By Vertical, 2014�2021 (USD Million)
Table 26 Training and Education: Market Size, By Region, 2014�2021 (USD Million)
Table 27 Training and Education: Market Size, By End User, 2014�2021 (USD Million)
Table 28 Training and Education: Market Size, By Vertical, 2014�2021 (USD Million)
Table 29 Integration and Testing: Market Size, By Region, 2014�2021 (USD Million)
Table 30 Integration and Testing: SDSec Market Size, By End User, 2014�2021 (USD Million)
Table 31 Integration and Testing: Market Size, By Vertical, 2014�2021 (USD Million)
Table 32 Consulting: Market Size, By Region, 2014�2021 (USD Million)
Table 33 Consulting: Market Size, By End User, 2014�2021 (USD Million)
Table 34 Consulting: Market Size, By Vertical, 2014�2021 (USD Million)
Table 35 Market Size, By Deployment Mode, 2014�2021 (USD Million)
Table 36 Cloud: Market Size, By Region, 2014�2021 (USD Million)
Table 37 on Premises: Market Size, By Region, 2014�2021 (USD Million)
Table 38 Software-Defined Security Market Size, By End User, 2014�2021 (USD Million)
Table 39 Telecom Service Providers: Market Size, By Region, 2014�2021 (USD Million)
Table 40 Cloud Service Providers: Market Size, By Region, 2014�2021 (USD Million)
Table 41 Enterprises: Market Size, By Region, 2014�2021 (USD Million)
Table 42 Enterprises: Market Size, By Vertical, 2014�2021 (USD Million)
Table 43 Information Technology Enabled Services: Market Size, By Region, 2014�2021 (USD Million)
Table 44 Defense: Market Size, By Region, 2014�2021 (USD Million)
Table 45 Banking, Financial Services, and Insurance: Market Size, By Region, 2014�2021 (USD Million)
Table 46 Media and Entertainment: Market Size, By Region, 2014�2021 (USD Million)
Table 47 Government: Market Size, By Region, 2014�2021 (USD Million)
Table 48 Education: Market Size, By Region, 2014�2021 (USD Million)
Table 49 Healthcare: Market Size, By Region, 2014�2021 (USD Million)
Table 50 Others: Market Size, By Region, 2014�2021 (USD Million)
Table 51 Market Size, By Region, 2014�2021 (USD Million)
Table 52 North America: Software-Defined Security Market Size, By Component, 2014�2021 (USD Million)
Table 53 North America: Market Size, By Enforcement Point, 2014�2021 (USD Million)
Table 54 North America: Market Size, By Solution, 2014�2021 (USD Million)
Table 55 North America: Market Size, By Security Software, 2014�2021 (USD Million)
Table 56 North America: Market Size, By Service, 2014�2021 (USD Million)
Table 57 North America: Market Size, By Deployment Mode, 2014�2021 (USD Million)
Table 58 North America: Market Size, By End User, 2014�2021 (USD Million)
Table 59 North America: Market Size, By Enterprises, 2014�2021 (USD Million)
Table 60 Europe: Software-Defined Security Market Size, By Component, 2014�2021 (USD Million)
Table 61 Europe: Market Size, By Enforcement Point, 2014�2021 (USD Million)
Table 62 Europe: Market Size, By Solution, 2014�2021 (USD Million)
Table 63 Europe: Market Size, By Security Software, 2014�2021 (USD Million)
Table 64 Europe: Market Size, By Service, 2014�2021 (USD Million)
Table 65 Europe: Market Size, By Deployment Mode, 2014�2021 (USD Million)
Table 66 Europe: Market Size, By End User, 2014�2021 (USD Million)
Table 67 Europe: Market Size, By Enterprises, 2014�2021 (USD Million)
Table 68 Asia-Pacific: Software-Defined Security Market Size, By Component, 2014�2021 (USD Million)
Table 69 Asia-Pacific: Market Size, By Enforcement Point, 2014�2021 (USD Million)
Table 70 Asia-Pacific: Market Size, By Solution, 2014�2021 (USD Million)
Table 71 Asia-Pacific: Market Size, By Security Software, 2014�2021 (USD Million)
Table 72 Asia-Pacific: Market Size, By Service, 2014�2021 (USD Million)
Table 73 Asia-Pacific: Market Size, By Deployment Mode, 2014�2021 (USD Million)
Table 74 Asia-Pacific: Market Size, By End User, 2014�2021 (USD Million)
Table 75 Asia-Pacific: Market Size, By Enterprises, 2014�2021 (USD Million)
Table 76 Middle East and Africa: Software-Defined Security Market Size, By Component, 2014�2021 (USD Million)
Table 77 Middle East and Africa: Market Size, By Enforcement Point, 2014�2021 (USD Million)
Table 78 Middle East and Africa: Market Size, By Solution, 2014�2021 (USD Million)
Table 79 Middle East and Africa: Market Size, By Security Software, 2014�2021 (USD Million)
Table 80 Middle East and Africa: Market Size, By Service, 2014�2021 (USD Million)
Table 81 Middle East and Africa: SDSec Market Size, By Deployment Mode, 2014�2021 (USD Million)
Table 82 Middle East and Africa: Market Size, By End User, 2014�2021 (USD Million)
Table 83 Middle East and Africa: Market Size, By Enterprises, 2014�2021 (USD Million)
Table 84 Latin America: Software-Defined Security Market Size, By Component, 2014�2021 (USD Million)
Table 85 Latin America: Market Size, By Enforcement Point, 2014�2021 (USD Million)
Table 86 Latin America: Market Size, By Solution, 2014�2021 (USD Million)
Table 87 Latin America: Market Size, By Security Software, 2014�2021 (USD Million)
Table 88 Latin America: Market Size, By Service, 2014�2021 (USD Million)
Table 89 Latin America: Market Size, By Deployment Mode, 2014�2021 (USD Million)
Table 90 Latin America: Market Size, By End User, 2014�2021 (USD Million)
Table 91 Latin America: Market Size, By Enterprises, 2014�2021 (USD Million)
Table 92 New Product Launches and Enhancements, 2013-2016
Table 93 Partnerships, Agreements, and Collaborations
Table 94 Mergers and Acquisitions
Table 95 Integrations and Expansions
List of Figures (54 Figures)
Figure 1 Global Software-Defined Security Market: Research Methodology
Figure 2 Market Size Estimation Methodology: Bottom-Up Approach
Figure 3 Market Size Estimation Methodology: Top-Down Approach
Figure 4 Breakdown of Primaries: By Company, Designation, and Region
Figure 5 Market Breakdown and Data Triangulation
Figure 6 Software Defined Security: Key Insights
Figure 7 Market Size, By Enforcement Point (2016 & 2021): Others (Cloud, Database, and Web) are Expected to Dominate the Market Throughout the Forecast Period
Figure 8 Market Size, By Component (2016-2021): Services are Expected to Grow at A Higher CAGR
Figure 9 Market Share, By Solution (2016 & 2021) : Security Software is Expected Have the Largest Market Share
Figure 10 Market Size, By Service (2016 & 2021): Consulting is Expected to Lead the Market
Figure 11 Market Size, By End User (2016 & 2021): Cloud Service Providers are Expected to Lead the Market
Figure 12 Global Market Share � North America is Estimated to Hold the Largest Market Share in 2016
Figure 13 The Global Market Presents Lucrative Opportunities
Figure 14 Software Defined Security Market By Security Software Solution, 2014 �2021, (USD Million)
Figure 15 MEA is Estimated to Witness the Maximum Growth Rate in the Market (2016)
Figure 16 Regional Lifecycle � Middle East and Africa and Latin America are in the Introductory Phase in 2016
Figure 17 MEA is Expected to Have the Highest Growth Potential During the Forecast Period
Figure 18 Asia-Pacific Market to Grow Faster Than Other Regions
Figure 19 Market Segmentation
Figure 20 Market Segmentation By Enforcement Point
Figure 21 Market Segmentation By Component
Figure 22 Market Segmentation By Deployment Mode
Figure 23 Market Segmentation By End User
Figure 24 Market Segmentation By Region
Figure 25 Software Defined Security: Drivers, Restrains, Opportunities, and Challenge
Figure 26 Pillars of SDSec Security Model
Figure 27 Strategic Benchmarking: Acquisitions, Partnerships, and New Product Developments Were the Key Growth Strategies Adopted By Key Market Players From 2014 to 2016
Figure 28 Virtual Machines/Server/Storage Security is Expected to Grow at A Higher CAGR During the Forecast Period
Figure 29 Services Component is Expected to Grow at A Higher CAGR During the Forecast Period
Figure 30 Support and Maintenance Services are Expected to Grow at the Highest CAGR During the Forecast Period
Figure 31 Cloud Deployment is Expected to Grow at A Higher CAGR During the Forecast Period
Figure 32 Cloud Service Providers End User Segment is Expected to Grow at the Highest CAGR During the Forecast Period
Figure 33 Middle East and Africa Region is Projected to Exhibit the Highest Growth in the Software Defined Security Market
Figure 34 Geographic Snapshot: North America is Estimated to Account for the Largest Share in the Market
Figure 35 North America Market Snapshot
Figure 36 Middle East and Africa Market Snapshot
Figure 37 Companies Adopted Partnerships and Agreements as the Key Growth Strategy Over the Last Three Years
Figure 38 Market Evaluation Framework
Figure 39 Battle for Market Share: New Product Launch and Enhancement Was the Key Growth Strategy of the Software-Defined Security Market
Figure 40 Region-Wise Revenue Mix of the Top 5 Market Players
Figure 41 Check Point Software Technologies Ltd.: Company Snapshot
Figure 42 Check Point Software Technologies Ltd.: SWOT Analysis
Figure 43 Cisco Systems, Inc. : Company Snapshot
Figure 44 Cisco Systems: SWOT Analysis
Figure 45 Intel Corporation: Company Snapshot
Figure 46 Intel Corporation: SWOT Analysis
Figure 47 VMware, Inc.: Company Snapshot
Figure 48 VMware, Inc.: SWOT Analysis
Figure 49 Symantec Corporation: Company Snapshot
Figure 50 Symantec Corporation: SWOT Analysis
Figure 51 EMC Corporation: Company Snapshot
Figure 52 Fortinet, Inc.: Company Snapshot
Figure 53 Juniper Networks, Inc.: Company Snapshot
Figure 54 Palo Alto Networks: Company Snapshot


Growth opportunities and latent adjacency in Software-Defined Security Market