Solar Backsheet Market by Type (Fluoropolymer and Non-Fluoropolymer), Application (Utility, Industrial, Commercial, Residential, and Military), Installation (Roof-Mounted, Ground-Mounted, and Floating Power Plant), and Region - Global Forecast to 2023


[123 Pages Report] The global solar backsheet market was valued at USD 1.71 Billion in 2018 and is expected to grow at a CAGR of 7.02%, during the forecast period, to reach USD 2.40 Billion by 2023. The market growth for solar backsheet is mainly driven by increasing solar PV installation as well as policy support from governments to enable the adoption of renewable technologies. Another factor driving the demand for solar backsheet is the need to reduce carbon emissions.
The years considered for the study are as follows:
- Base Year- 2017
- Estimated Year- 2018
- Projected Year- 2023
- Forecast Period- 2018 to 2023
The base year considered for company profiles is 2017. Whenever information was unavailable for the base year, the prior year has been considered.
Objectives of the Study
- To define, describe, segment, and forecast the solar backsheet market by type, application, installation, and region
- To provide detailed information on the major factors influencing the growth of the market (drivers, restraints, opportunities, and industry-specific challenges)
- To strategically analyze the market with respect to individual growth trends, future expansions, and contribution to the market
- To forecast the expansion of the market with respect to the main regions (Asia Pacific, North America, Europe, and the rest of the world)
- To analyze market opportunities for stakeholders and details of a competitive landscape for market leaders
- To analyze competitive developments such as contracts & agreements, mergers & acquisitions, new product developments, and expansions in the market
Research Methodology
This research study involved the use of extensive secondary sources, directories, and databases, such as Hoover�s, Bloomberg Businessweek, Factiva, and OneSource, to identify and collect information useful for a technical, market-oriented, and commercial study of the global market. Primary sources are mainly industry experts from the core and related industries, service providers, technology developers, standards and certification organizations of companies, and organizations related to all segments of this industry�s value chain. The research methodology is explained below.
- Study of the annual revenues and market developments of the major players providing solar backsheet
- Assessment of future trends, technology developments, and growth of the market
- Assessment of the market with respect to the demand for each type of application
- Analysis of market trends in various regions or countries by studying the future solar PV installation targets
- Finalization of the overall market sizes by triangulating the supply-side data, which includes product developments and annual revenues of companies providing solar backsheet across the globe
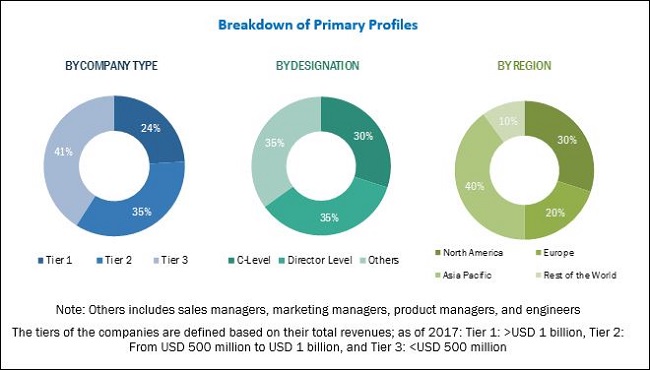
After arriving at the overall market size, the total market has been split into several segments and sub-segments. The figure below illustrates the breakdown of primaries conducted during the research study by company type, designation, and region.
To know about the assumptions considered for the study, download the pdf brochure
Market Ecosystem
The solar backsheet market ecosystem comprises raw material suppliers such as DowDuPont (US) and Arkema (France). It includes solar backsheet manufacturers such as Cybrid (China), Jolywood (China), Hangzhou (China), and ISOVOLTAIC (Austria). It also comprises solar panel manufacturers such as JinkoSolar (China), Trina Solar (China), Canadian Solar (Canada), and JA Solar (China).
Target Audience
The target audience of this report includes:
- Backsheet manufacturers and suppliers
- BOS providers
- Raw material supplying companies
- Systems integrators
- Solar power plant developing companies
- Utilities and independent power producers
Scope of the Report
- By Application
- Utility
- Industrial
- Commercial
- Residential
- Military
- By Type
- Fluoropolymer
- Non-Fluoropolymer
- By Installation
- Roof-Mounted
- Ground-Mounted
- Floating Power Plant
- By Region
- North America
- Asia Pacific
- Europe
- Rest of the World
Available Customizations:
With the given market data, MarketsandMarkets offers customizations as per the client�s specific needs. The following customization options are available for this report:
Regional Analysis
Further breakdown of region or country-specific analysis
Company Information
Detailed analyses and profiling of additional market players (up to 5)
The global solar backsheet market is projected to grow at a CAGR of 7.02%, from 2018 to 2023, to reach a market size of USD 2.40 Billion by 2023, from an estimated market size of USD 1.71 Billion in 2018. The global market growth is driven by increasing global solar PV installations as well as policy support from governments to enable the adoption of renewable technologies, coupled with the rising need to reduce carbon emissions.
The report segments the solar backsheet market, by application, into utility, industrial, commercial, residential, and military. The utility segment is expected to be the largest market. This segment is driven mainly by the global increase in installations of solar power plants, both for utility and distributed power generation applications, to meet the global power demand.
The report segments the solar backsheet, by installation, into roof-mounted, ground-mounted, and floating power plant. The floating power plant market is expected to grow at the highest CAGR during the forecast period. The growth of the market can be attributed to the ability of these plants to generate more power due to the cooling nature of water. Floating power plants also solve land constraints issues, which is a major hurdle in ground-mounted solar installations.
The solar backsheet market has been further segmented, based on type, into fluoropolymer and non-fluoropolymer. The non-fluoropolymer segment is expected to grow at the fastest rate during the forecast period. This growth can be attributed to its cost-effectiveness as compared to fluoropolymer-based backsheet.
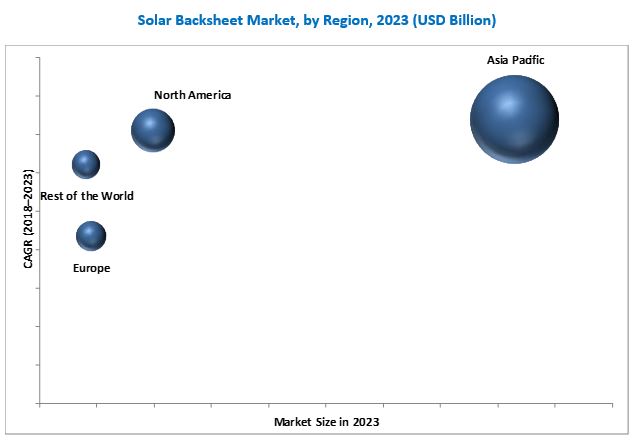
In this report, the market has been analyzed with respect to 4 regions, namely, North America, Europe, Asia Pacific, and the rest of the world. Asia Pacific is projected to dominate the global solar backsheet market during the forecast period due to the significant increase in solar PV installation in China and India. China is the largest market in Asia Pacific and is heavily investing in solar PV to reduce carbon emissions and fulfill its power needs. Asia Pacific is also expected to be the fastest-growing market, followed by North America.
The major factor restraining the growth of the market is high installation and storage costs of solar photovoltaic power.
Some of the leading players in the solar backsheet market include Cybrid (China), Jolywood (China), Coveme (Italy), Krempel (Germany), and Hangzhou First (China). Contracts & agreements was the most common strategy adopted by top players, followed by investments and expansions.
To speak to our analyst for a discussion on the above findings, click Speak to Analyst
Table of Contents
1 Introduction (Page No. - 14)
1.1 Objectives of the Study
1.2 Market Definition
1.3 Market Scope
1.3.1 Markets Covered
1.3.2 Regional Scope
1.3.3 Years Considered for the Study
1.4 Currency
1.5 Stakeholders
2 Research Methodology (Page No. - 17)
2.1 Research Data
2.1.1 Secondary Data
2.1.1.1 Key Secondary Sources
2.1.2 Primary Data
2.1.2.1 Key Data From Primary Sources
2.1.2.2 Key Industry Insights
2.1.2.3 Breakdown of Primaries
2.2 Market Size Estimation
2.2.1 Market Size Estimation Methodology: Bottom-Up Approach
2.2.2 Market Size Estimation Methodology: Top-Down Approach
2.3 Market Breakdown & Data Triangulation
2.4 Research Limitations
2.5 Research Assumptions
3 Executive Summary (Page No. - 25)
4 Premium Insights (Page No. - 29)
4.1 Attractive Opportunities in the Solar Backsheet Market
4.2 Market, By Type
4.3 Market, By Application
4.4 North America Market, By Installation & Country
4.5 Market, By Country
5 Market Overview (Page No. - 32)
5.1 Introduction
5.2 Market Dynamics
5.2.1 Drivers
5.2.1.1 Increasing Solar PV Installation
5.2.1.2 Policy Supports From Governments to Enable Adoption of Renewable Technologies
5.2.2 Restraints
5.2.2.1 High Installation and Storage Cost of Solar PV Power
5.2.3 Opportunities
5.2.3.1 Technology Advancement
5.2.4 Challenge
5.2.4.1 PV Panel Failures Due to Poor Testing Standard of Backsheets
6 Solar Backsheet Market, By Region (Page No. - 36)
6.1 Introduction
6.2 North America
6.3 Asia Pacific
6.4 Europe
6.5 Rest of the World
7 Solar Backsheet Market, By Type (Page No. - 42)
7.1 Introduction
7.2 Fluoropolymer
7.3 Non-Fluoropolymer
8 Solar Backsheet Market, By Installation (Page No. - 46)
8.1 Introduction
8.2 Roof Mounted
8.3 Ground Mounted
8.4 Floating Power Plant
9 Solar Backsheet Market, By Application (Page No. - 51)
9.1 Introduction
9.2 Utility
9.3 Residential
9.4 Commercial
9.5 Industrial
9.6 Military
10 Solar Backsheet Market, By Region (Page No. - 57)
10.1 Introduction
10.2 Asia Pacific
10.2.1 By Application
10.2.2 By Installation
10.2.3 By Type
10.2.4 By Country
10.2.4.1 China
10.2.4.2 Japan
10.2.4.3 India
10.2.4.4 South Korea
10.2.4.5 Australia
10.2.4.6 Rest of Asia Pacific
10.3 North America
10.3.1 By Application
10.3.2 By Installation
10.3.3 By Type
10.3.4 By Country
10.3.4.1 US
10.3.4.2 Canada
10.3.4.3 Mexico
10.4 Europe
10.4.1 By Application
10.4.2 By Installation
10.4.3 By Type
10.4.4 By Country
10.4.4.1 Germany
10.4.4.2 UK
10.4.4.3 France
10.4.4.4 Italy
10.4.4.5 Spain
10.4.4.6 Rest of Europe
10.5 Rest of the World (RoW)
10.5.1 By Application
10.5.2 By Installation
10.5.3 By Type
10.5.4 By Country
10.5.4.1 Chile
10.5.4.2 South Africa
10.5.4.3 Israel
10.5.4.4 Turkey
10.5.4.5 Others
11 Competitive Landscape (Page No. - 88)
11.1 Introduction
11.2 Ranking of Players and Market Structure
11.3 Competitive Scenario
11.3.1 Contracts & Agreements
11.3.2 New Product Launches
11.3.3 Investments & Expansions
12 Company Profiles (Page No. - 92)
(Business Overview, Products Offered, Recent Developments, MnM View)*
12.1 Benchmarking
12.2 Agfa
12.3 Dupont
12.4 Jolywood
12.5 Coveme
12.6 Isovoltaic
12.7 3M
12.8 Hangzhou First
12.9 Honeywell
12.10 Toray
12.11 Cybrid
12.12 Dunmore
12.13 Krempel
12.14 Mitsubishi Polyester Film
12.15 Targray
*Business Overview, Products Offered, Recent Developments, MnM View Might Not Be Captured in Case of Unlisted Companies.
13 Appendix (Page No. - 115)
13.1 Insights of Industry Experts
13.2 Discussion Guide
13.3 Knowledge Store: Marketsandmarkets� Subscription Portal
13.4 Introducing RT: Real-Time Market Intelligence
13.5 Available Customizations
13.6 Related Reports
13.7 Author Details
List of Tables (69 Tables)
Table 1 Solar Backsheet Market Snapshot
Table 2 Solar Backsheet Consumption Market Size, By Region, 2016�2023 (USD Million)
Table 3 Solar Backsheet Consumption Market Size, By End User, 2016�2023 (USD Million)
Table 4 North America: Solar Backsheet Consumption Market Size, By Country, 2016�2023 (USD Million)
Table 5 Asia Pacific: Solar Backsheet Consumption Market Size, By Country, 2016�2023 (USD Million)
Table 6 Europe: Solar Backsheet Consumption Market Size, By Country, 2016�2023 (USD Million)
Table 7 Rest of the World: Solar Backsheet Consumption Market Size, By Country, 2016�2023 (USD Million)
Table 8 Solar Backsheet Market Size, By Type, 2016�2023 (Million Sq. Meters)
Table 9 Market Size, By Type, 2016�2023 (USD Million)
Table 10 Fluoropolymer: Market Size, By Region, 2016�2023 (Million Sq. Meters)
Table 11 Fluoropolymer: Market Size, By Region, 2016�2023 (USD Million)
Table 12 Non-Fluoropolymer: Market Size, By Region, 2016�2023 (Million Sq. Meters)
Table 13 Non-Fluoropolymer: Market Size, By Region, 2016�2023 (USD Million)
Table 14 Solar Backsheet Market Size, By Installation, 2016�2023 (USD Million)
Table 15 Roof Mounted: Market Size, By Region, 2016�2023 (USD Million)
Table 16 Ground Mounted: Market Size, By Region, 2016�2023 (USD Million)
Table 17 Floating Power Plant: Market Size, By Region, 2016�2023 (USD Million)
Table 18 Solar Backsheet Market Size, By Application, 2016�2023 (USD Million)
Table 19 Utility: Market Size, By Region, 2016�2023 (USD Million)
Table 20 Residential: Market Size, By Region, 2016�2023 (USD Million)
Table 21 Commercial: Market Size, By Region, 2016�2023 (USD Million)
Table 22 Industrial: Market Size, By Region, 2016�2023 (USD Million)
Table 23 Military: Market Size, By Region, 2016�2023 (USD Thousand)
Table 24 Market Size, By Region, 2016�2023 (USD Million)
Table 25 Asia Pacific: Solar Backsheet Market Size, By Application, 2016�2023 (USD Million)
Table 26 Asia Pacific: Market Size, By Installation, 2016�2023 (USD Million)
Table 27 Asia Pacific: Market Size, By Type, 2016�2023 (Million Sq. Meters)
Table 28 Asia Pacific: Market Size, By Type, 2016�2023 (USD Million)
Table 29 Asia Pacific: Market Size, By Country, 2016�2023 (USD Million)
Table 30 China: Market Size, By Application, 2016�2023 (USD Million)
Table 31 Japan: Market Size, By Application, 2016�2023 (USD Million)
Table 32 India: Market Size, By Application, 2016�2023 (USD Million)
Table 33 South Korea: Market Size, By Application, 2016�2023 (USD Million)
Table 34 Australia: Market Size, By Application, 2016�2023 (USD Million)
Table 35 Rest of Asia Pacific: Market Size, By Application, 2016�2023 (USD Million)
Table 36 North America: Solar Backsheet Market Size, By Application, 2016�2023 (USD Million)
Table 37 North America: Market Size, By Installation, 2016�2023 (USD Million)
Table 38 North America: Market Size, By Type, 2016�2023 (Million Sq. Meters)
Table 39 North America: Market Size, By Type, 2016�2023 (USD Million)
Table 40 North America: Market Size, By Country, 2016�2023 (USD Million)
Table 41 US: Market Size, By Application, 2016�2023 (USD Million)
Table 42 Canada: Market Size, By Application, 2016�2023 (USD Million)
Table 43 Mexico: Market Size, By Application, 2016�2023 (USD Million)
Table 44 Europe: Solar Backsheet Market Size, By Application, 2016�2023 (USD Million)
Table 45 Europe: Market Size, By Installation, 2016�2023 (USD Million)
Table 46 Europe: Market Size, By Type, 2016�2023 (Million Sq. Meters)
Table 47 Europe: Market Size, By Type, 2016�2023 (USD Million)
Table 48 Europe: Market Size, By Country, 2016�2023 (USD Million)
Table 49 Germany: Market Size, By Application, 2016�2023 (USD Million)
Table 50 UK: Market Size, By Application, 2016�2023 (USD Million)
Table 51 France: Market Size, By Application, 2016�2023 (USD Million)
Table 52 Italy: Market Size, By Application, 2016�2023 (USD Million)
Table 53 Spain: Market Size, By Application, 2016�2023 (USD Million)
Table 54 Rest of Europe: Market Size, By Application, 2016�2023 (USD Million)
Table 55 Rest of the World (RoW): Market Size, By Application, 2016�2023 (USD Million)
Table 56 Rest of the World: Market Size, By Installation, 2016�2023 (USD Million)
Table 57 Rest of the World: Market Size, By Type, 2016�2023 (Million Sq. Meters)
Table 58 Rest of the World: Market Size, By Type, 2016�2023 (USD Million)
Table 59 Rest of the World (RoW): Market Size, By Country, 2016�2023 (USD Million)
Table 60 Chile: Market Size, By Application, 2016�2023 (USD Million)
Table 61 South Africa: Market Size, By Application, 2016�2023 (USD Million)
Table 62 Israel: Market Size, By Application, 2016�2023 (USD Million)
Table 63 Turkey: Market Size, By Application, 2016�2023 (USD Million)
Table 64 Others: Market Size, By Application, 2016�2023 (USD Million)
Table 65 Top 5 Players Held 73% Share of the Market in 2016
Table 66 Coveme, the Most Active Player in the Market Between 2014 and 2017
Table 67 Contracts & Agreements, 2017�2018
Table 68 New Product Launches, 2017
Table 69 Investments & Expansions, 2015�2017
List of Figures (31 Figures)
Figure 1 Solar Backsheet Market: Research Design
Figure 2 Bottom-Up Approach
Figure 3 Top-Down Approach
Figure 4 Data Triangulation Methodology
Figure 5 Assumptions of the Research Study
Figure 6 Market, By Region (Value), 2018
Figure 7 Market, By Application, 2018�2023 (USD Million)
Figure 8 Market, By Region, 2018�2023 (USD Billion)
Figure 9 Increasing Investments in Renewable Power Generation Worldwide During the Forecast Period
Figure 10 Non-Fluoropolymer Segment is Expected to Grow at the Highest CAGR During the Forecast Period
Figure 11 Utility Segment is Expected to Dominate the Solar Backsheet Market, in 2023
Figure 12 Ground Mounted Installation Segment & the US Held the Largest Market Shares Within North America in 2017
Figure 13 India & Australia are Expected to Be the Fastest Growing Markets During the Forecast Period
Figure 14 Market Dynamics for the Solar Backsheet Market
Figure 15 Net Addition of Solar PV Installation (MW) in Key Regions, 2006-2016
Figure 16 The Asia Pacific Segment is Expected to Dominate the Market in 2023
Figure 17 Fluoropolymer Segment Accounted for the Largest Market Share in 2017
Figure 18 Ground Mounted Segment is Estimated to Dominate the Market in 2018
Figure 19 Utility Segment is Expected to Dominate the Market in 2023
Figure 20 Asia Pacific is Expected to Grow at the Highest CAGR During the Forecast Period
Figure 21 Asia Pacific Led the Market in 2017
Figure 22 Asia Pacific: Market Snapshot
Figure 23 North America: Market Snapshot
Figure 24 Recent Key Developments in the Solar Backsheet Market
Figure 25 Agfa: Company Snapshot
Figure 26 Dupont: Company Snapshot
Figure 27 Jolywood: Company Snapshot
Figure 28 3M: Company Snapshot
Figure 29 Hangzhou First: Company Snapshot
Figure 30 Honeywell: Company Snapshot
Figure 31 Toray: Company Snapshot


Growth opportunities and latent adjacency in Solar Backsheet Market