Soundproof Curtains Market by Type (Sound-insulating, Sound-reducing, Sound-blocking), Material (Glass Wool, Rock Wool, Natural Fabrics, Plastic Foam), End-use Sector (Residential, Commercial, Industrial), and Region - Global Forecast to 2022


[165 Pages Report] Soundproofing curtains are used to control or reduce the amount of noise in a given environment by preventing the sound from entering or leaving the space. Different types of materials are used to accomplish noise reduction or elimination. These soundproof curtains are made from thicker materials when compared to black-out curtains and are specifically made to reduce the amount of noise entering the internal space. They can also serve as energy savers by reducing the transfer of heat and can block light from coming through buildings.
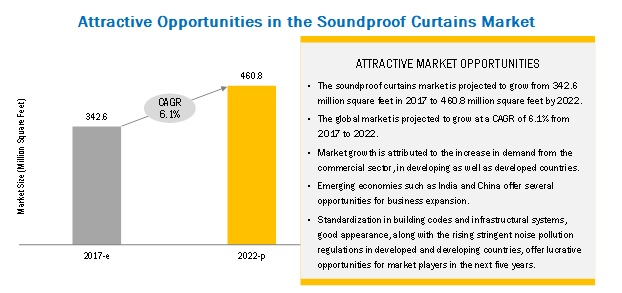
In 2017, the soundproof curtains market is estimated to be valued at USD 1,647.6 million; this is projected to reach USD 2,381.5 million by 2022, registering a CAGR of 7.7% during the forecast period. The soundproof curtains market is projected to grow from 342.6 million square feet in 2017 to 460.8 million square feet by 2022. The soundproof curtains market is witnessing considerable growth due to advancements in soundproof material technology and the growing building & construction industry. Growing demand from commercial, residential, and industrial sectors, along with global environmental concerns and their legal implications, are the key factors driving the growth of the soundproof curtains market.
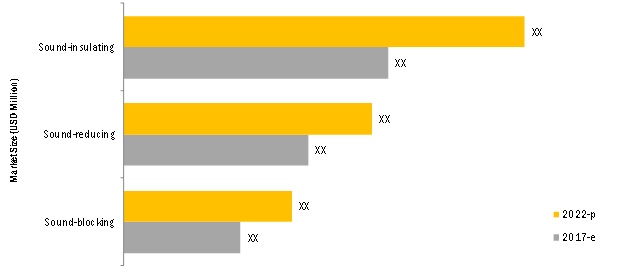
Sound insulating segment to dominate the market through 2022
In terms of value, the sound-insulating curtains segment accounted for the largest market share in 2016 and is projected to grow at the highest CAGR from 2017 to 2022. The growth of this segment is attributed to the growing construction industry and an increase in demand for energy-efficient soundproof buildings.
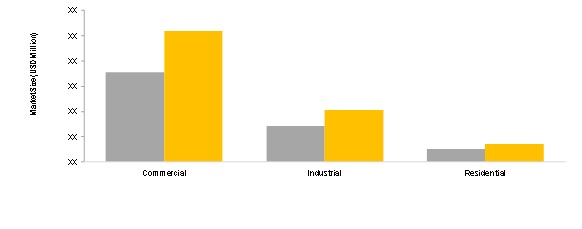
Commercial Buildings to dominate the market for soundproof curtains through 2022
The use of soundproof curtains in the commercial buildings sector is projected to grow at the highest CAGR from 2017. This growth is attributed to the newly developing building standards in the Asia Pacific and other developing regions, which demand advancements in present building safety, along with developed technologies and successful installation of soundproof curtains. This, in turn, will drive the soundproof curtains market for commercial buildings.
Glass wool is projected to grow at the highest rate from 2017 to 2022
Glass wool provides more thermal and acoustic insulation when compared to other materials; it also provides better safety and handling, which drives the demand for glass wool as a material for soundproof curtains.
Europe dominated the soundproof curtains market in 2016
Europe was the largest market for soundproof curtains. It is a developed market for soundproof curtains and is driven by the rising stringent environmental regulations and recovery of the construction industry.
Market Dynamics
Driver Rising health issues among people
lting in disorders such as hearing loss, sleep disturbance, and risks of stress and heart disease. Public spending on soundproof solutions as a result of rising health issues from heavy noise pollution has been increasing. On the other hand, regulations limiting noise are being imposed by many developing countries. For instance, in the US, the Occupational Noise Exposure Regulation mandates that industrial employers must limit noise exposure of their employees to 90 dB. Similar regulations across the globe have been increasing the usage of soundproof curtains.
Acoustic insulation materials such as glass wool and vinyl are widely used by different industry players to reduce the ill-effects of noise pollution among workers. These materials are witnessing an upsurge in the market owing to their increased use in the building & construction industry, especially in the residential segment.
Restraint: Price volatility of raw materials
The price of raw materials such as fiberglass, vinyl, natural fibers, and sealants adds significantly to the production cost of soundproof curtains. The price volatility of raw materials influences the price of soundproof curtains and their installation along the supply chain. This poses a challenge for players, especially new entrants, in establishing their footprint in the market. This, in turn, hinders the growth of the market for soundproof curtains.
Opportunity: Increasing global noise pollution
Rapid industrialization and urbanization are the main sources of excess noise in the environment. New development in industrial machines, transportation systems, commercial activities, indoor machines, building activities, domestic appliances, and music performances can lead to conditions such as hypertension, hearing loss, sleep disturbance, issues in child development, cardiovascular dysfunctions, dementia, and psychological dysfunctions. According to the World Health Organization, sound levels of less than 70 dB are not damaging to living organisms but exposure for more than 8 hours to constant noise beyond 85 dB may be hazardous. With this increasing noise pollution, the necessity of soundproof coverings on windows and doors is expected to drive the growth of the soundproof curtains market.
Challenge: Limited recyclability of fiberglass and vinyl
Glass wool and vinyl are used as raw materials in soundproof curtains, as they are low-cost and efficient insulation materials. However, it is difficult to recycle them, which poses a major challenge for the soundproof curtains industry. Proper techniques are required to dispose of glass wool and vinyl. It requires masks and protective clothing for the physical safety of the personnel involved in the disposal process. The lack of infrastructure needed for this safe disposal as well as recycling, especially in emerging economies, poses a challenge for the growth of this market. Considering that the Asia Pacific region is the largest market for glass wool, and most countries in the region are developing, efforts to improve recycling techniques are needed for the material.
Get online access to the report on the World's First Market Intelligence Cloud
- Easy to Download Historical Data & Forecast Numbers
- Company Analysis Dashboard for high growth potential opportunities
- Research Analyst Access for customization & queries
- Competitor Analysis with Interactive dashboard
- Latest News, Updates & Trend analysis
Request Sample Scope of the Report
Get online access to the report on the World's First Market Intelligence Cloud
- Easy to Download Historical Data & Forecast Numbers
- Company Analysis Dashboard for high growth potential opportunities
- Research Analyst Access for customization & queries
- Competitor Analysis with Interactive dashboard
- Latest News, Updates & Trend analysis

|
Report Metric |
Details |
|
Market size available for years |
2015�2022 |
|
Base year considered |
2016 |
|
Forecast period |
2017�2022 |
|
Forecast units |
USD million and million square feet |
|
Segments covered |
Type, End-use Sector, Material, and Region |
|
Geographies covered |
North America (US, Canada, Mexico), South America (Brazil, Argentina, and Rest of South America), Europe (Germany, UK, France, Russia, Italy, Spain, and Rest of Europe), Asia Pacific (China, Japan, India, Australia, South Korea, and Rest of Asia Pacific) and the Middle East & Africa (UAE, Turkey, Saudi Arabia, South Africa and Rest of Middle East & Africa) |
|
Companies covered |
Sound Seal (US), Lantal Textiles (Switzerland), Kinetics Noise Control (US), Amcraft Manufacturing (US), Great Lakes Textiles (US), Flexshield (Australia), Haining Duletai New Material (China), Acoustical Surfaces (US), eNoise Control (US), and HOFA-Akustik (Germany) |
The research report segments the soundproof curtains market into the following submarkets:
By Type
- Sound-insulating
- Sound-reducing
- Sound-blocking
By Material:
- Glass wool
- Rock wool
- Plastic foam
- Natural fabrics
By End-use Sector:
- Residential
- Commercial
- Industrial
By Region:
- North America
- Europe
- Asia Pacific
- Middle East & Africa
- South America
Key Market Players
Sound Seal (US), Lantal Textiles (Switzerland), Kinetics Noise Control (US), Amcraft Manufacturing (US), Great Lakes Textiles (US)Recent Developments
- In September 2017, Acoustical Surfaces, Inc., a leader in the business of soundproofing, introduced Envirocoustic Wood Wool, a range of acoustical wall and ceiling panels. Envirocoustic Wood Wool performs well by absorbing sound while thermally insulating. The product is available in many sizes and color variations that can be designed to fit nearly any decor.
- In July 2017, Sound Seal (US) acquired The Proudfoot Company (US), the pioneer of noise control in concrete. The acquisition would enable the company to penetrate new markets and applications in noise control solutions. Moreover, with this acquisition, Sound Seal will expand its leadership position as a premier supplier to the US noise control market.
- In January 2016, Sound Seal (US), a leading manufacturer of acoustical and noise control products, acquired IAC Acoustics (US). IAC Acoustics is a New York-based industrial noise control expert. The acquisition will help Sound Seal to expand its product portfolio as well as expand its reach into additional markets and industry applications.
Critical questions the report answers:
- What are the upcoming trends for the soundproof curtains market?
- Which segment in the soundproof curtains market provides the most opportunity for growth?
- Who are the leading vendors operating in this market?
- What are the opportunities for new market entrants in the soundproof curtains market?
To speak to our analyst for a discussion on the above findings, click Speak to Analyst
Table of Contents
1 Introduction (Page No. - 15)
1.1 Objectives of the Study
1.2 Market Definition
1.3 Market Scope
1.3.1 Years Considered for the Study
1.4 Currency Considered
1.5 Unit Considered
1.6 Stakeholders
2 Research Methodology (Page No. - 18)
2.1 Research Data
2.1.1 Secondary Data
2.1.1.1 Key Data From Secondary Sources
2.1.2 Primary Data
2.1.2.1 Key Data From Primary Sources
2.1.2.2 Key Industry Insights
2.2 Market Size Estimation
2.2.1 Bottom-Up Approach
2.2.2 Top-Down Approach
2.3 Data Triangulation
2.4 Research Assumptions
2.5 Limitations
3 Executive Summary (Page No. - 26)
4 Premium Insights (Page No. - 31)
4.1 Attractive Opportunities in the Soundproof Curtains Market
4.2 Soundproof Curtains Market, By Type
4.3 Soundproof Curtains Market, By End-Use Sector
4.4 Europe Soundproof Curtains Market, By End-Use Sector and Country
4.5 Soundproof Curtains Market Geographic Snapshot
5 Market Overview (Page No. - 35)
5.1 Introduction
5.2 Market Dynamics
5.2.1 Drivers
5.2.1.1 Rising Health Issues Among People
5.2.1.2 Growth in Residential and Non-Residential Construction Activities
5.2.1.3 Technological Advancements in Raw Material
5.2.2 Restraints
5.2.2.1 Strong Demand for Acoustic Panels and Other Soundproof Products
5.2.2.2 Price Volatility of Raw Materials
5.2.3 Opportunities
5.2.3.1 Increasing Global Noise Pollution
5.2.3.2 Stringent Environmental Regulations
5.2.4 Challenges
5.2.4.1 Limited Recyclability of Fiberglass and Vinyl
5.2.4.2 Lack of Awareness About Soundproof Solutions
5.3 Porter�s Five Forces Analysis
5.3.1 Threat of New Entrants
5.3.2 Threat of Substitutes
5.3.3 Bargaining Power of Suppliers
5.3.4 Bargaining Power of Buyers
5.3.5 Intensity of Competitive Rivalry
6 Macroeconomic Overview (Page No. - 43)
6.1 Introduction
6.2 Rise in Population
6.3 Increase in the Middle-Class Population, 2009�2030
6.4 Development of Economy, GDP (Purchasing Power Parity), 2015
6.5 GDP & Construction Contribution to Industry, By Region
7 Soundproof Curtains Market, By Type (Page No. - 49)
7.1 Introduction
7.2 Sound-Insulating
7.3 Sound-Reducing
7.4 Sound-Blocking
8 Soundproof Curtains Market, By Material (Page No. - 52)
8.1 Introduction
8.2 Glass Wool
8.3 Rock Wool
8.4 Plastic Foams
8.5 Natural Fibers
9 Soundproof Curtains Market, By End-Use Sector (Page No. - 56)
9.1 Introduction
9.2 Commercial
9.3 Residential
9.4 Industrial
10 Soundproof Curtains Market, By Region (Page No. - 60)
10.1 Introduction
10.2 North America
10.2.1 US
10.2.2 Canada
10.2.3 Mexico
10.3 Europe
10.3.1 Germany
10.3.2 UK
10.3.3 Russia
10.3.4 France
10.3.5 Spain
10.3.6 Italy
10.3.7 Rest of Europe
10.4 Asia Pacific
10.4.1 China
10.4.2 India
10.4.3 Japan
10.4.4 Australia
10.4.5 South Korea
10.4.6 Rest of Asia Pacific
10.5 Middle East & Africa (MEA)
10.5.1 UAE
10.5.2 Turkey
10.5.3 Saudi Arabia
10.5.4 South Africa
10.5.5 Rest of Middle East & Africa
10.6 South America
10.6.1 Brazil
10.6.2 Argentina
10.6.3 Rest of South America
11 Competitive Landscape (Page No. - 129)
11.1 Overview
11.2 Market Ranking of Key Players
11.3 Competitive Scenario
11.3.1 New Product Launches
11.3.2 Mergers & Acquisitions
12 Company Profiles (Page No. - 133)
(Overview, Products and Services, Financials, Strategy & Development)*
12.1 Sound Seal
12.2 Lantal Textiles
12.3 Kinetics Noise Control
12.4 Amcraft Manufacturing
12.5 Great Lakes Textiles
12.6 Flexshield
12.7 Haining Duletai New Material
12.8 Acoustical Surfaces
12.9 Enoise Control
12.10 Hofa-Akustik
12.11 Other Key Players
12.11.1 Complete Soundproofing
12.11.2 SGF
12.11.3 Steel Guard Safety
12.11.4 ZAK Acoustics
12.11.5 Acoustic Curtains
12.11.6 Residential Acoustics
12.11.7 Audimute
12.11.8 Sound Control Services
12.11.9 Envirotech Systems
12.11.10 Hodgson & Hodgson
12.11.11 PES (UK)
12.11.12 Ecotone Systems
12.11.13 Acoustical Solutions
12.11.14 Robert Soper Limited (Soper�s)
12.11.15 Rite-Hite
*Details on Overview, Products and Services, Financials, Strategy & Development Might Not Be Captured in Case of Unlisted Companies.
13 Appendix (Page No. - 157)
13.1 Discussion Guide
13.2 Knowledge Store: Marketsandmarkets� Subscription Portal
13.3 Introducing RT: Real-Time Market Intelligence
13.4 Available Customizations
13.5 Related Reports
13.6 Author Details
List of Tables (147 Tables)
Table 1 Numbers (Million) and Share (Percent) of the Global Middle Class, 2009-2030
Table 2 Trends and Forecast of GDP in North America, 2015�2022 (USD Billion)
Table 3 North America: Contribution of Construction Industry to GDP, By Country, 2014�2021 (USD Billion)
Table 4 Trends and Forecast of GDP in Europe, 2015�2022 (USD Billion)
Table 5 Europe: Contribution of Construction Industry to GDP, By Country, 2014�2021 (USD Billion)
Table 6 Trends and Forecast of GDP in Asia Pacific, 2015�2022 (USD Billion)
Table 7 Asia Pacific: Contribution of Construction Industry to GDP, By Country, 2014�2021 (USD Billion)
Table 8 Trends and Forecast of GDP in Middle East & Africa, 2015�2022 (USD Billion)
Table 9 Middle East & Africa: Contribution of Construction Industry to GDP, By Country, 2014�2021 (USD Billion)
Table 10 Trends and Forecast of GDP in South America, 2015�2022 (USD Billion)
Table 11 South America: Contribution of Construction Industry to GDP, By Country, 2014�2021 (USD Billion)
Table 12 Soundproof Curtains Market Size, By Type, 2015�2022 (USD Million)
Table 13 Soundproof Curtains Market Size, By Type, 2015�2022 (Million Square Feet)
Table 14 Soundproof Curtains Market Size, By Material, 2015�2022 (USD Million)
Table 15 Soundproof Curtains Market Size, By End-Use Sector, 2015�2022 (USD Million)
Table 16 Soundproof Curtains Market Size, By End-Use Sector, 2015�2022 (Million Square Feet)
Table 17 Soundproof Curtains Market Size, By Region, 2015�2022 (USD Million)
Table 18 Soundproof Curtains Market Size, By Region, 2015�2022 (Million Square Feet)
Table 19 North America: Soundproof Curtains Market Size, By Country, 2015�2022 (USD Million)
Table 20 North America: Soundproof Curtains Market Size, By Country, 2015�2022 (Million Square Feet)
Table 21 North America: Soundproof Curtains Market Size, By Type, 2015�2022 (USD Million)
Table 22 North America: Soundproof Curtains Market Size, By Type, 2015�2022 (Million Square Feet)
Table 23 North America: Soundproof Curtains Market Size, By End-Use Sector, 2015�2022 (USD Million)
Table 24 North America: Soundproof Curtains Market Size, By End-Use Sector, 2015�2022 (Million Square Feet)
Table 25 US: Soundproof Curtains Market Size, By Type, 2015�2022 (USD Million)
Table 26 US: Soundproof Curtains Market Size, By Type, 2015�2022 (Million Square Feet)
Table 27 US: Soundproof Curtains Market Size, By End-Use Sector, 2015�2022 (USD Million)
Table 28 US: Soundproof Curtains Market Size, By End-Use Sector, 2015�2022 (Million Square Feet)
Table 29 Canada: Soundproof Curtains Market Size, By Type, 2015�2022 (USD Million)
Table 30 Canada: Soundproof Curtains Market Size, By Type, 2015�2022 (Million Square Feet)
Table 31 Canada: Soundproof Curtains Market Size, By End-Use Sector, 2015�2022 (USD Million)
Table 32 Canada: Soundproof Curtains Market Size, By End-Use Sector, 2015�2022 (Thousand Square Feet)
Table 33 Mexico: Soundproof Curtains Market Size, By Type, 2015�2022 (USD Million)
Table 34 Mexico: Soundproof Curtains Market Size, By Type, 2015�2022 (Thousand Square Feet)
Table 35 Mexico: Soundproof Curtains Market Size, By End-Use Sector, 2015�2022 (USD Million)
Table 36 Mexico: Soundproof Curtains Market Size, By End-Use Sector, 2015�2022 (Million Square Feet)
Table 37 Europe: Soundproof Curtains Market Size, By Country, 2015�2022 (USD Million)
Table 38 Europe: Soundproof Curtains Market Size, By Country, 2015�2022 (Million Square Feet)
Table 39 Europe: Soundproof Curtains Market Size, By Type, 2015�2022 (USD Million)
Table 40 Europe: Soundproof Curtains Market Size, By Type, 2015�2022 (Million Square Feet)
Table 41 Europe: Soundproof Curtains Market Size, By End-Use Sector, 2015�2022 (USD Million)
Table 42 Europe: Soundproof Curtains Market Size, By End-Use Sector, 2015�2022 (Million Square Feet)
Table 43 Germany: Soundproof Curtains Market Size, By Type, 2015�2022 (USD Million)
Table 44 Germany: Soundproof Curtains Market Size, By Type, 2015�2022 (Million Square Feet)
Table 45 Germany: Soundproof Curtains Market Size, By End-Use Sector, 2015�2022 (USD Million)
Table 46 Germany: Soundproof Curtains Market Size, By End-Use Sector, 2015�2022 (Million Square Feet)
Table 47 UK: Soundproof Curtains Market Size, By Type, 2015�2022 (USD Million)
Table 48 UK: Soundproof Curtains Market Size, By Type, 2015�2022 (Million Square Feet)
Table 49 UK: Soundproof Curtains Market Size, By End-Use Sector, 2015�2022 (USD Million)
Table 50 UK: Soundproof Curtains Market Size, By End-Use Sector, 2015�2022 (Million Square Feet)
Table 51 Russia: Soundproof Curtains Market Size, By Type, 2015�2022 (USD Million)
Table 52 Russia: Soundproof Curtains Market Size, By Type, 2015�2022 (Million Square Feet)
Table 53 Russia: Soundproof Curtains Market Size, By End-Use Sector, 2015�2022 (USD Million)
Table 54 Russia: Soundproof Curtains Market Size, By End Use Sector, 2015�2022 (Million Square Feet)
Table 55 France: Soundproof Curtains Market Size, By Type, 2015�2022 (USD Million)
Table 56 France: Soundproof Curtains Market Size, By Type, 2015�2022 (Million Square Feet)
Table 57 France: Soundproof Curtains Market Size, By End Use, 2015�2022 (USD Million)
Table 58 France: Soundproof Curtains Market Size, By End Use Sector, 2015�2022 (Million Square Feet)
Table 59 Spain: Soundproof Curtains Market Size, By Type, 2015�2022 (USD Million)
Table 60 Spain: Soundproof Curtains Market Size, By Type, 2015�2022 (Million Square Feet)
Table 61 Spain: Soundproof Curtains Market Size, By End Use Sector, 2015�2022 (USD Million)
Table 62 Spain: Soundproof Curtains Market Size, By End-Use Sector, 2015�2022 (Thousand Square Feet)
Table 63 Italy: Soundproof Curtains Market Size, By Type, 2015�2022 (USD Million)
Table 64 Italy: Soundproof Curtains Market Size, By Type, 2015�2022 (Million Square Feet )
Table 65 Italy: Soundproof Curtains Market Size, By End-Use Sector, 2015�2022 (USD Million)
Table 66 Italy: Soundproof Curtains Market Size, By End-Use Sector, 2015�2022 (Thousand Square Feet)
Table 67 Rest of Europe: Soundproof Curtains Market Size, By Type, 2015�2022 (USD Million)
Table 68 Rest of Europe: Soundproof Curtains Market Size, By Type, 2015�2022 (Million Square Feet)
Table 69 Rest of Europe: Soundproof Curtains Market Size, By End Use Sector, 2015�2022 (USD Million)
Table 70 Rest of Europe: Soundproof Curtains Market Size, By End Use Sector, 2015�2022 (Million Square Feet)
Table 71 Asia Pacific: Soundproof Curtains Market Size, By Country, 2015�2022 (USD Million)
Table 72 Asia Pacific: Soundproof Curtains Market Size, By Country, 2015�2022 (Million Square Feet)
Table 73 Asia Pacific: Soundproof Curtains Market Size, By Type, 2015�2022 (USD Million)
Table 74 Asia Pacific: Soundproof Curtains Market Size, By Type, 2015�2022 (Million Square Feet)
Table 75 Asia Pacific: Soundproof Curtains Market Size, By End-Use Sector, 2015�2022 (USD Million)
Table 76 Asia Pacific: Soundproof Curtains Market Size, By End-Use Sector, 2015�2022 (Million Square Feet)
Table 77 China: Soundproof Curtains Market Size, By Type, 2015�2022 (USD Million)
Table 78 China: Soundproof Curtains Market Size, By Type, 2015�2022 (Million Square Feet)
Table 79 China: Soundproof Curtains Market Size, By End-Use Sector, 2015�2022 (USD Million)
Table 80 China: Soundproof Curtains Market Size, By End-Use Sector, 2015�2022 (Million Square Feet)
Table 81 India: Soundproof Curtains Market Size, By Type, 2015�2022 (USD Million)
Table 82 India: Soundproof Curtains Market Size, By Type, 2015�2022 (Million Square Feet)
Table 83 India: Soundproof Curtains Market Size, By End-Use Sector, 2015�2022 (USD Million)
Table 84 India: Soundproof Curtains Market Size, By End-Use Sector, 2015�2022 (Million Square Feet)
Table 85 Japan: Soundproof Curtains Market Size, By Type, 2015�2022 (USD Million)
Table 86 Japan: Soundproof Curtains Market Size, By Type, 2015�2022 (Million Square Feet)
Table 87 Japan: Soundproof Curtains Market Size, By End-Use Sector, 2015�2022 (USD Million)
Table 88 Japan: Soundproof Curtains Market Size, By End-Use Sector, 2015�2022 (Million Square Feet)
Table 89 Australia: Soundproof Curtains Market Size, By Type, 2015�2022 (USD Million)
Table 90 Australia: Soundproof Curtains Market Size, By Type, 2015�2022 (Thousand Square Feet)
Table 91 Australia: Soundproof Curtains Market Size, By End-Use Sector, 2015�2022 (USD Million)
Table 92 Australia: Soundproof Curtains Market Size, By End-Use Sector, 2015�2022 (Thousand Square Feet)
Table 93 South Korea: Soundproof Curtains Market Size, By Type, 2015�2022 (USD Million)
Table 94 South Korea: Soundproof Curtains Market Size, By Type, 2015�2022 (Thousand Square Feet)
Table 95 South Korea: Soundproof Curtains Market Size, End-Use Sector, 2015�2022 (USD Million)
Table 96 South Korea: Soundproof Curtains Market Size, End-Use Sector, 2015�2022 (Thousand Square Feet)
Table 97 Rest of Asia Pacific: Soundproof Curtains Market Size, By Type, 2015�2022 (USD Million)
Table 98 Rest of Asia Pacific: Soundproof Curtains Market Size, By Type, 2015�2022 (Million Square Feet)
Table 99 Rest of Asia Pacific: Soundproof Curtains Market Size, By End-Use Sector, 2015�2022 (USD Million)
Table 100 Rest of Asia Pacific: Soundproof Curtains Market Size, By End-Use Sector, 2015�2022 (Thousand Square Feet)
Table 101 Middle East & Africa: Soundproof Curtains Market Size, By Country, 2015�2022 (USD Million)
Table 102 Middle East & Africa: Soundproof Curtains Market Size, By Country, 2015�2022 (Million Square Feet)
Table 103 Middle East & Africa: Soundproof Curtains Market Size, By Type, 2015�2022 (USD Million)
Table 104 Middle East & Africa: Soundproof Curtains Market Size, By Type, 2015�2022 (Million Square Feet)
Table 105 Middle East & Africa: Soundproof Curtains Market Size, By End-Use Sector, 2015�2022 (USD Million)
Table 106 Middle East & Africa: Soundproof Curtains Size, By End-Use Sector, 2015�2022 (Million Square Feet)
Table 107 UAE: Soundproof Curtains Market Size, By Type, 2015�2022 (USD Million)
Table 108 UAE: Soundproof Curtains Market Size, By Type, 2015�2022 (Thousand Square Feet)
Table 109 UAE: Soundproof Curtain Market Size, By End-Use Sector, 2015�2022 (USD Million)
Table 110 UAE: Soundproof Curtains Size, By End-Use Sector, 2015�2022 (Thousand Square Feet)
Table 111 Turkey: Soundproof Curtains Market Size, By Type, 2015�2022 (USD Million)
Table 112 Turkey: Soundproof Curtains Market Size, By Type, 2015�2022 (Thousand Square Feet)
Table 113 Turkey: Soundproof Curtains Market Size, By End-Use Sector, 2015�2022 (USD Million)
Table 114 Turkey: Soundproof Curtains Size, By End-Use Sector, 2015�2022 (Thousand Square Feet)
Table 115 Saudi Arabia: Soundproof Curtains Market Size, By Type, 2015�2022 (USD Million)
Table 116 Saudi Arabia: Soundproof Curtains Market Size, By Material, 2015�2022 (Thousand Square Feet)
Table 117 Saudi Arabia: Soundproof Curtains Market Size, By End-Use Sector, 2015�2022 (USD Million)
Table 118 Saudi Arabia: Soundproof Curtains Size, By End-Use Sector, 2015�2022 (Thousand Square Feet)
Table 119 South Africa: Soundproof Curtains Market Size, By Type, 2015�2022 (USD Million)
Table 120 South Africa: Soundproof Curtains Market Size, By Type, 2015�2022 (Thousand Square Feet)
Table 121 South Africa: Soundproof Curtain Market Size, By End-Use Sector, 2015�2022 (USD Million)
Table 122 South Africa: Soundproof Curtains Size, By End-Use Sector, 2015�2022 (Thousand Square Feet)
Table 123 Rest of Middle East & Africa: Soundproof Curtains Market Size, By Type, 2015�2022 (USD Million)
Table 124 Rest of Middle East & Africa: Soundproof Curtains Market Size, By Type, 2015�2022 (Thousand Square Feet)
Table 125 Rest of Middle East & Africa: Soundproof Curtains Market Size, By End-Use Sector, 2015�2022 (USD Million)
Table 126 Rest of Middle East & Africa: Soundproof Curtains Size, By End-Use Sector, 2015�2022 (Thousand Square Feet)
Table 127 South America: Soundproof Curtains Market Size, By Country, 2015�2022 (USD Million)
Table 128 South America: Soundproof Curtains Market Size, By Country, 2015�2022 (Million Square Feet)
Table 129 South America: Soundproof Curtains Market Size, By Type, 2015�2022 (USD Million)
Table 130 South America: Soundproof Curtains Market Size, By Type, 2015�2022 (Million Square Feet)
Table 131 South America: Soundproof Curtains Market Size, By End-Use Sector, 2015�2022 (USD Million)
Table 132 South America: Soundproof Curtains Market Size, By End-Use Sector, 2015�2022 (Million Square Feet)
Table 133 Brazil: Soundproof Curtains Market Size, By Type, 2015�2022 (USD Million)
Table 134 Brazil: Soundproof Curtains Market Size, By Type, 2015�2022 (Million Square Feet)
Table 135 Brazil: Soundproof Curtains Market Size, By End-Use Sector, 2015�2022 (USD Million)
Table 136 Brazil: Soundproof Curtains Market Size, By End-Use Sector, 2015�2022 (Thousand Square Feet)
Table 137 Argentina: Soundproof Curtains Market Size, By Type, 2015�2022 (USD Million)
Table 138 Argentina: Soundproof Curtains Market Size, By Type, 2015�2022 (Thousand Square Feet)
Table 139 Argentina: Soundproof Curtains Market Size, By End-Use Sector, 2015�2022 (USD Million)
Table 140 Argentina: Soundproof Curtains Market Size, By End-Use Sector, 2015�2022 (Thousand Square Feet)
Table 141 Rest of South America: Soundproof Curtains Market Size, By Type, 2015�2022 (USD Million)
Table 142 Rest of South America: Soundproof Curtains Market Size, By Type, 2015�2022 (Thousand Square Feet)
Table 143 Rest of South America: Soundproof Curtains Market Size, By End-Use Sector, 2015�2022 (USD Million)
Table 144 Rest of South America: Soundproof Curtains Market Size, By End-Use Sector, 2015�2022 (Thousand Square Feet)
Table 145 Market Ranking of Key Players
Table 146 New Product Launches (2014�2017)
Table 147 Mergers & Acquisitions (2014�2017)
List of Figures (23 Figures)
Figure 1 Soundproof Curtains Market: Research Design
Figure 2 Market Size Estimation Methodology: Bottom-Up Approach
Figure 3 Market Size Estimation Methodology: Top-Down Approach
Figure 4 Soundproof Curtains Market: Data Triangulation
Figure 5 Sound Insulating Segment to Dominate the Market Through 2022
Figure 6 Commercial Buildings to Dominate the Market for Soundproof Curtains Through 2022
Figure 7 Glass Wool is Projected to Grow at the Highest Rate From 2017 to 2022
Figure 8 Europe Dominated the Soundproof Curtains Market in 2016
Figure 9 Soundproof Curtains Market to Record Significant Growth Between 2017 and 2022
Figure 10 Sound-Insulating Segment to Grow at the Highest Rate From 2017 to 2022
Figure 11 Commercial Buildings to Dominate the Market Through 2022
Figure 12 Commercial Sector Accounted for the Largest Share in Europe in 2016
Figure 13 China is Projected to Grow at the Highest Rate From 2017 to 2022
Figure 14 Soundproof Curtains Market Dynamics
Figure 15 Porter�s Five Forces Analysis
Figure 16 GDP Per Capita, By Country, 2014�2021 (USD Billion)
Figure 17 Sound-Insulating Segment Projected to Register the Highest Growth Rate From 2017 to 2022
Figure 18 Glass Wool is Projected to Record the Largest Demand for Soundproof Curtains From 2017 to 2022
Figure 19 Commercial Segment Projected to Record the Highest Demand for Soundproof Curtains Through 2022
Figure 20 Geographic Snapshot (2017�2022): China to Be the Fastest Growing Market for Soundproof Curtains
Figure 21 Eurpoe Soundproof Curtains Market Snapshot: Germany is Projected to Be the Fastest-Growing Market Between 2017 & 2022
Figure 22 Asia Pacific Soundproof Curtains Market Snapshot: China is Projected to Be the Fastest-Growing Market Between 2017 & 2022
Figure 23 New Product Launches Were Most Preferred Growth Strategy Adopted By Key Players From 2014 to 2017


Growth opportunities and latent adjacency in Soundproof Curtains Market