Soy Protein Ingredients Market

Soy Protein Ingredients Market by Type (Soy Protein Concentrates, Soy Protein Isolates, Textured Soy Protein, and Soy Flours), Application (Food and Feed), Form (Dry and Liquid), Nature, Function, and Region - Global Forecast to 2027

Report Code: FB 2092 Jan, 2023, by marketsandmarkets.com

Soy Protein Ingredients Market Insights & Overview

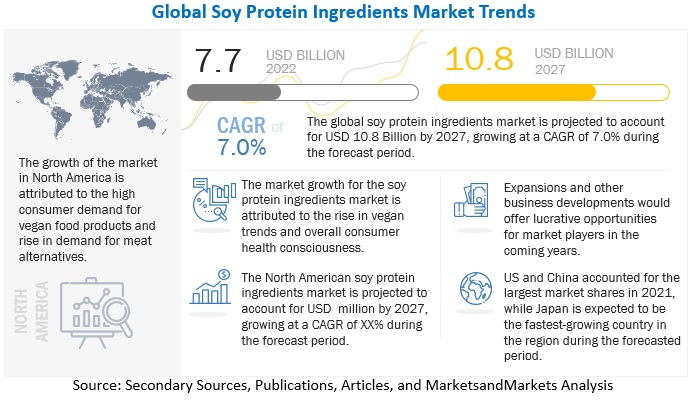
Global soy protein ingredients market size was valued at USD 7.7 billion in 2022 and is poised to grow USD 10.8 billion by 2027, growing at a CAGR of 7.0% in the forecast period (2022-2027).

Soy protein ingredients are produced by processing soymeal to obtain ingredients with higher protein concentrations, which can be used as a protein source in a range of food and animal feed applications. The demand for soy protein is growing in the food and animal feed industries, owing to their health benefits and functional properties. It is also a cheaper substitute for animal protein. The market is likely to grow at a significantly higher rate compared to other vegetable proteins.
 

Soy Protein Ingredients Market

To know about the assumptions considered for the study, Request for Free Sample Report

Soy Protein Ingredients Market Growth Insights

Drivers: Demand for cheaper protein source

Increased crop cultivation in developing regions such as South America and Asia Pacific, in addition to the already widespread cultivation across the globe, has increased the availability of soy proteins. Raw materials are, therefore, easy to obtain from contract farmers or oilseed crushers offering soy meal. The low processing costs associated with soy protein are suitable for the operational demands of manufacturers and thereby allow the processors to spend effectively on product development. As a result of these trends, soy proteins are cheaper when compared to that of other protein sources such as meat, dairy, and whey proteins. Additionally, the prices of conventional dairy products have increased in the recent past, and soy protein, one of the major plant sources of protein, is one of the best alternatives in terms of price.

Restraints: Ban on soy products of GM origin

The cultivation of genetically modified crops is forbidden in developed regions like Europe, where some member states of the European Union have passed laws prohibiting it. Germany, France, Northern Ireland, and Scotland are among the important nations. The conventional soybean market in the area has been impacted, and future expansion is predicted to be hampered by this. It is also anticipated to have an impact on the export of soybeans from developing nations like Argentina, where GM-based soybean crops are the norm.

Risks to human health and the environment have been linked to genetically modified (GM) soybeans by scientists. As a result, certain food producers in the US, Canada, Europe, and Japan are asking for soybeans that aren't genetically modified. Organizations in regions such as the Asia-Pacific and Europe have made it mandatory to declare genetic modification of food ingredients through labels on the packaging of all processed foods. Developing countries such as India, in 2013, have brought into effect the rule that requires GM-based food products to mention the same on packaged labels. European countries such as Germany and the U.K. have made the inclusion of GMO/non-GMO mentioned on the labels of dairy and processed meat products a mandate industry is restraining the market growth.

Opportunities: Demand for organic soy protein

The organic soy protein market has the potential to change the business landscape in the overall soy protein ingredients market. According to the Research Institute of Organic Agriculture (FiBL), around 1.8 million farmers across 162 countries carried out organic cultivation on more than 37.0 million hectares of agricultural land in 2013. Growth in the organic food products market is also expected to boost the growth of the organic market. Government and non-government organizations offer financial aid, R&D programs, and subsidies to support traditional farmers in switching to organic farming. These organizations include the Research Institute of Organic Agriculture, Switzerland (FiBL), the Agricultural & Processed Food Products Export Development Authority (APEDA) in India, and the US Department of Agriculture (USDA) in the US. Demand for organic food ingredients is high in developed regions such as North America and Europe. The consumer preference for healthy products is rising due to the increasing consumer awareness about the health benefits of consuming organic food products. As a result, marketing campaigns are planned to highlight their use and health benefit claims.

Challenges: Exhibition of unappealing flavor by soy products

Lately consumer shift towards “cholesterol-free” food items have elevated the demand for soy protein ingredients, slightly negatively impacting the demand for animal sourced proteins. However, soy protein is not recommended for eating due to its unpleasant flavour. Aldehydes, ketones, furans, and alcohols are among the substances that contribute to this off-flavor. One of the main causes of the beany and grassy taste of soy products is medium-chain aldehydes. The sole thing driving researchers to create novel and appealing soy product flavours is soy's inexpensive cost and great nutritional content. The addition of sugar molecules or during the extraction process are two potential neutralising methods being explored.

Soy Protein Isolates soy protein type in the soy protein ingredients market is projected to grow at the highest CAGR of 7.4% during the forecast period

Soy protein isolates are used not only to improve the texture of meat products but also to increase protein content, enhance moisture retention, and emulsify. The additional benefit of using soy protein isolates is their bland taste and high protein content; also, they are low in fat, oligosaccharides, and fiber, causing less flatulence due to bacterial fermentation. They are considered significant ingredients by food industries for their functional benefits. The food industry is the largest user of pure SPI, which is also used in the health/pharmaceutical industry. Soy protein isolates are also important ingredients in bakery products. They have the highest protein content (around 90%) out of all the types of soy protein available which is projected to drive their demand in the market.

Dry segment by form is estimated to dominate over the forecasted period

In the industry, powdered or dry ingredients are excellent texture enhancers. Moreover, with the rise in demand for meat alternatives, with growing trends for plant-based foods, industries are focused on maintaining the texture of soy-based food. They are trying to make it as close as to the texture of meat. Players in the market thus include texturized soy protein ingredients in their portfolios. They are mostly in dry form; thus, the rise in demand for texturized soy protein is driving the demand for dry form soy protein. Moreover, their longer shelf life, convenient packaging, ease of use in recipes, and ability to blend with other components is driving their demand in the market.

The food segment by application dominated the market with an estimated value of USD 6,282.1 million in 2022

Soybean and processed products are the most important ingredients in the food & beverage industry, and their functionality is still being studied. They have a major share in the meat alternatives and functional food segments. Technological advancements have helped enhance the functionality of soy protein, which has led to the successful replacement of meat protein with soy protein. Infant formulations for lactose intolerants comprise a large amount of soy protein isolates containing no lactose. Soy protein are formulated to suit specific applications, such as bakery, confectionery, beverage, dairy replacers, or meat alternatives. Consumer shift towards plant-based food is expected to drive the food segment in soy protein ingredients market.

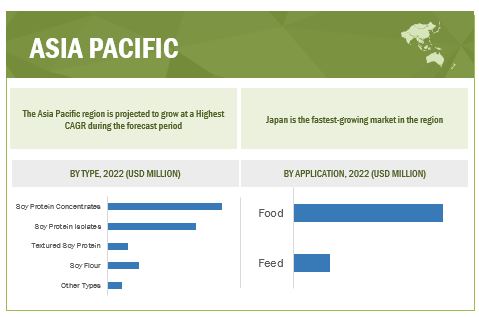
Asia Pacific is projected to be the fastest growing region in market, in 2022; it is anticipated to grow at a significant CAGR
Soy Protein Ingredients Market in APAC Region

To know about the assumptions considered for the study, download the pdf brochure

The soy protein ingredients market in Asia Pacific is projected to witness strong growth driven by large economies, such as China, India, Japan, and Australia. The level of overall investment in the region has increased substantially over the past decade, especially in China. The region has also witnessed a rise in vegan food consumption in recent years. The perceived benefits regarding people’s health, environment, and religious considerations significantly contribute to the adoption of vegan and vegetarian diets in the region. Also, the rising health concerns have led people to reduce their meat intake and add plant-based foods, including soy proteins, to their diets.

Key Players in Soy Protein Ingredients Industry

The key players in this market include ADM (US), Wilmar International Co., Ltd. (Singapore), Cargill, Incorporated (US), CHS, Inc. (US), and Fuji Oil Holdings Inc (Japan)

Soy Protein Ingredients Market Report Scope

Report Metric

Details

Market Valuation in 2022

USD 7.7 billion

Revenue Forecast in 2027

USD 10.8 billion

Surge rate

CAGR of 7.0%

Regions covered

North America, Asia Pacific, Europe, South America and RoW

Companies studied

  • ADM (US)
  • Wilmar International Ltd (Singapore)
  • Cargill, Incorporated (US)
  • International Flavors & Fragrances Inc. (US)
  • CHS Inc. (US)
  • BRF Global (Brazil)
  • Fuji Oil Holdings Inc. (Japan)
  • Devansoy (US)
  • Crown Protein Soya Group Company (China)
  • AG Processing Inc. (US)
  • The Scoular Company (US)

Target Audience:

  • Soy protein raw material (ingredients) suppliers
  • Soy Protein based product manufacturers
  • Intermediate suppliers, such as traders and distributors of soy protein ingredients based food and feed
  • Soy protein ingredients based food and feed exporting companies
  • Government and soy protein research organizations
  • Associations, regulatory bodies, and other industry-related bodies:
    • Food and Agriculture Organization (FAO)
    • European Food Safety Authority (EFSA)
    • The Association of American Feed Control Officials
    • Food Standards Australia New Zealand
    • US Food and Drug Administration (FDA) (US)
    • World Health Organization (WHO)

Soy Protein Ingredients Market Report Segmentation:

Segment

Subsegment

Market by Type
  • Soy Protein Concentrates
  • Soy Protein Isolates
  • Textured Soy Protein
  • Soy Flours
  • Other Types
Market by Application
  • Food
    • Meat Alternatives
    • Dairy Alternatives
    • Bakery Products
    • Performance Nutrition
    • Convenience Foods
    • Beverages
    • Other Food Applications
  • Feed
    • Cattle
    • Swine
    • Poultry
    • Pet Food
    • AquaFeed
Market by Form
  • Dry
  • Liquid
Market by Nature
  • Conventional
  • Organic
Market by Function
  • Muscle Health
  • Heart Health
  • Weight Management
  • Other Functions
Market by Region
  • North America
  • Europe
  • Asia Pacific
  • South America
  • Rest of the World (RoW)

Recent Developments in Soy Protein Ingredients Market 

  • In August 2022, ADM signed an agreement with US-based food and feed ingredients manufacturer, Benson Hill. The agreement provides ADM with exclusive license in North America to process grain derived from Benson Hill’s ultra-high protein soybeans to produce and sell protein concentrates, texturized protein concentrates, protein isolates and high protein texturized flour for the human food ingredients market. This will enhance the quality of soy proteins offered by ADM, with greater protein content.
  • In November 2019, Wilmar International Ltd announced to collaborate with US-based Bunge Limited in Vietnam’s meal market. Wilmar assumed the responsibility for sales of soymeal, corn, feed, wheat, and other agri products. This collaboration will help both the companies cater to the Vietnamese market, which will contribute to their sales revenue.
  • In November 2022, Cargill, Incorporated entered into an agreement to add Owensboro Grain Company (US) to its North American agricultural supply chain business. The acquisition will help Cargill offer more soy products such as protein meal and hull pellets for animal feeds.
  • In November 2022, International Flavors & Fragrances Inc. launched Supro Tex, a soy-based plant protein ingredient. The ingredient has 80% protein content which gives it’s a protein profile comparable to animal meat. It is the newest addition to IFF’s Reimagine-Protein Program commenced in 2017. The launch will help IFF expand its product portfolio in the soy protein ingredients category.

Frequently Asked Questions (FAQ):

To speak to our analyst for a discussion on the above findings, click Speak to Analyst

TABLE OF CONTENTS
 
1 INTRODUCTION OF SOY PROTEIN INGREDIENTS MARKET (Page No. - 24)
    1.1 STUDY OBJECTIVES 
    1.2 MARKET DEFINITION 
    1.3 STUDY SCOPE 
           FIGURE 1 MARKET SEGMENTATION
    1.4 REGIONS COVERED 
    1.5 YEARS CONSIDERED 
    1.6 UNITS CONSIDERED 
           1.6.1 CURRENCY
                    TABLE 1 USD EXCHANGE RATES CONSIDERED, 2018–2021
           1.6.2 VOLUME
    1.7 STAKEHOLDERS 
    1.8 SUMMARY OF CHANGES 
 
2 RESEARCH METHODOLOGY (Page No. - 30)
    2.1 RESEARCH DATA 
           FIGURE 2 MARKET: RESEARCH DESIGN
           2.1.1 SECONDARY DATA
                    2.1.1.1 Key data from secondary sources
           2.1.2 PRIMARY DATA
                    2.1.2.1 Key data from primary sources
                    2.1.2.2 Breakdown of primaries
                    2.1.2.3 Key primary insights
    2.2 MARKET SIZE ESTIMATION 
           2.2.1 APPROACH ONE: BOTTOM-UP (BASED ON TYPE, BY REGION)
           2.2.2 APPROACH TWO: TOP-DOWN (BASED ON GLOBAL MARKET)
    2.3 DATA TRIANGULATION 
           FIGURE 3 DATA TRIANGULATION METHODOLOGY
    2.4 STUDY ASSUMPTIONS 
    2.5 STUDY LIMITATIONS AND RISK ASSESSMENT 
 
3 EXECUTIVE SUMMARY (Page No. - 39)
    TABLE 2 SOY PROTEIN INGREDIENTS MARKET SNAPSHOT, 2021 VS. 2027 
    FIGURE 4 MARKET, BY TYPE, 2022 VS. 2027 (USD MILLION) 
    FIGURE 5 MARKET, BY APPLICATION, 2022 VS. 2027 (USD MILLION) 
    FIGURE 6 MARKET, BY FORM, 2022 VS. 2027 (USD MILLION) 
    FIGURE 7 MARKET, BY NATURE, 2022 VS. 2027 (USD MILLION) 
    FIGURE 8 MARKET SHARE (VALUE), BY REGION, 2021 
 
4 PREMIUM INSIGHTS (Page No. - 44)
    4.1 ATTRACTIVE OPPORTUNITIES FOR MARKET PLAYERS 
           FIGURE 9 RISE IN DEMAND FOR MEAT ALTERNATIVES AND VEGAN FOOD TO DRIVE MARKET
    4.2 NORTH AMERICA: MARKET, BY TYPE AND COUNTRY 
           FIGURE 10 SOY PROTEIN CONCENTRATES AND US ACCOUNTED FOR LARGEST RESPECTIVE MARKET SHARES IN NORTH AMERICA IN 2021
    4.3 MARKET, BY TYPE 
           FIGURE 11 SOY PROTEIN CONCENTRATES TO LEAD DURING FORECAST PERIOD
    4.4 MARKET, BY APPLICATION 
           FIGURE 12 FOOD APPLICATIONS TO DOMINATE DURING FORECAST PERIOD
    4.5 MARKET, BY FORM 
           FIGURE 13 DRY FORM TO DOMINATE MARKET DURING FORECAST PERIOD
    4.6 MARKET, BY NATURE 
           FIGURE 14 CONVENTIONAL INGREDIENTS TO DOMINATE DURING FORECAST PERIOD
 
5 MARKET OVERVIEW (Page No. - 48)
    5.1 INTRODUCTION 
    5.2 MACROECONOMIC INDICATORS 
           5.2.1 RISE IN FOOD DEMAND FROM GROWING POPULATION
                    FIGURE 15 GLOBAL POPULATION PROJECTED TO REACH MORE THAN 9.5 BILLION BY 2050
           5.2.2 INCREASE IN GLOBAL FEED PRODUCTION
                    FIGURE 16 GLOBAL FEED PRODUCTION, 2012–2021 (MILLION TON)
           5.2.3 INCREASE IN SOYBEAN PRODUCTION
                    FIGURE 17 SOYBEAN PRODUCTION, BY KEY COUNTRY, 2016–2020 (MILLION TON)
    5.3 MARKET DYNAMICS 
           FIGURE 18 SOY PROTEIN INGREDIENTS MARKET: DRIVERS, RESTRAINTS, OPPORTUNITIES, AND CHALLENGES
           5.3.1 DRIVERS
                    5.3.1.1 Demand for cheaper protein source
                    5.3.1.2 Preference for soy as meat and dairy protein alternative
                    5.3.1.3 High nutritive value of soy
           5.3.2 RESTRAINTS
                    5.3.2.1 Anti-nutritional components of soy protein
                    5.3.2.2 Ban on soy products of GM origin
           5.3.3 OPPORTUNITIES
                    5.3.3.1 Demand for organic soy protein
                    5.3.3.2 Growth in demand in other applications
                    5.3.3.3 Demand for plant-based protein from growing vegan population
           5.3.4 CHALLENGES
                    5.3.4.1 Unpleasant flavor of soy products
 
6 INDUSTRY TRENDS (Page No. - 56)
    6.1 INTRODUCTION 
    6.2 VALUE CHAIN ANALYSIS 
           6.2.1 RESEARCH AND PRODUCT DEVELOPMENT
           6.2.2 RAW MATERIAL SOURCING
           6.2.3 PRODUCTION & PROCESSING
           6.2.4 DISTRIBUTION
           6.2.5 MARKETING & SALES
                    FIGURE 19 VALUE CHAIN
    6.3 SUPPLY CHAIN ANALYSIS 
           FIGURE 20 SUPPLY CHAIN
    6.4 TECHNOLOGY ANALYSIS 
           6.4.1 EXTRUSION
    6.5 PRICING ANALYSIS 
           6.5.1 AVERAGE SELLING PRICE, BY TYPE
                    FIGURE 21 GLOBAL AVERAGE SELLING PRICE (ASP), BY TYPE, 2020–2022 (USD/TON)
                    TABLE 3 SOY PROTEIN CONCENTRATES ASP, BY REGION, 2020–2022 (USD/TON)
                    TABLE 4 SOY PROTEIN ISOLATES ASP, BY REGION, 2020–2022 (USD/TON)
                    TABLE 5 TEXTURED SOY PROTEIN ASP, BY REGION, 2020–2022 (USD/TON)
    6.6 ECOSYSTEM MAPPING 
           6.6.1 DEMAND SIDE
           6.6.2 SUPPLY SIDE
                    FIGURE 22 SOY PROTEIN INGREDIENTS MARKET: ECOSYSTEM
                    FIGURE 23 MARKET ECOSYSTEM MAPPING
                    TABLE 6 MARKET ECOSYSTEM MAPPING
    6.7 TRENDS/DISRUPTIONS IMPACTING CUSTOMERS’ BUSINESSES 
           FIGURE 24 TRENDS IMPACTING BUYER BUSINESSES
    6.8 PATENT ANALYSIS 
           FIGURE 25 PATENT ANALYSIS, 2012–2022
           TABLE 7 PATENTS PERTAINING TO SOY PROTEIN INGREDIENTS, 2020–2022
    6.9 TRADE DATA: MARKET 
           TABLE 8 TOP 10 IMPORTERS AND EXPORTERS OF SOYBEAN, 2020 (KG)
           TABLE 9 TOP 10 IMPORTERS AND EXPORTERS OF SOYBEAN, 2021 (KG)
    6.10 KEY CONFERENCES & EVENTS 
           TABLE 10 KEY CONFERENCES & EVENTS, 2023
    6.11 PORTER’S FIVE FORCES ANALYSIS 
                    TABLE 11 PORTER’S FIVE FORCES ANALYSIS
           6.11.1 THREAT OF NEW ENTRANTS
           6.11.2 THREAT OF SUBSTITUTES
           6.11.3 BARGAINING POWER OF SUPPLIERS
           6.11.4 BARGAINING POWER OF BUYERS
           6.11.5 INTENSITY OF COMPETITIVE RIVALRY
    6.12 CASE STUDIES 
           6.12.1 ADM OFFERED FLAVORED PROTEIN-RICH YOGURT BEVERAGE
    6.13 KEY STAKEHOLDERS AND BUYING CRITERIA 
           6.13.1 KEY STAKEHOLDERS IN BUYING PROCESS
                    FIGURE 26 INFLUENCE OF STAKEHOLDERS ON BUYING PROCESS FOR SOY PROTEIN INGREDIENT APPLICATIONS
                    TABLE 12 INFLUENCE OF STAKEHOLDERS ON BUYING PROCESS FOR SOY PROTEIN INGREDIENT APPLICATIONS
           6.13.2 BUYING CRITERIA
                    FIGURE 27 KEY BUYING CRITERIA FOR TOP APPLICATIONS
    6.14 TARIFF & REGULATORY LANDSCAPE 
                    TABLE 13 LIST OF REGULATORY BODIES, GOVERNMENT AGENCIES, AND OTHER ORGANIZATIONS
    6.15 REGULATORY FRAMEWORK 
           6.15.1 NORTH AMERICA
           6.15.2 EUROPE
           6.15.3 ASIA PACIFIC
    6.16 RECESSION IMPACT ON SOY PROTEIN INGREDIENTS MARKET 
           6.16.1 MACROECONOMIC INDICATORS OF RECESSION
                    FIGURE 28 INDICATORS OF RECESSION
                    FIGURE 29 GLOBAL INFLATION RATES, 2011–2021
                    FIGURE 30 GLOBAL GDP, 2011–2021 (USD TRILLION)
                    FIGURE 31 FOOD INGREDIENTS MARKET: EARLIER FORECAST VS. RECESSION FORECAST, 2023 (USD BILLION)
                    FIGURE 32 RECESSION INDICATORS AND THEIR IMPACT ON THE MARKET
                    FIGURE 33 MARKET: EARLIER FORECAST VS. RECESSION FORECAST, 2023 (USD BILLION)
                    FIGURE 34 MARKET: DEGREE OF RECESSION IMPACT
           6.16.2 RECESSION IMPACT ANALYSIS, BY REGION
                    6.16.2.1 North America
                               FIGURE 35 NORTH AMERICA: INFLATION RATES, BY KEY COUNTRY, 2018–2021
                               FIGURE 36 NORTH AMERICA: RECESSION IMPACT ANALYSIS
                    6.16.2.2 Europe
                               FIGURE 37 EUROPE: INFLATION RATES, BY KEY COUNTRY, 2018–2021
                               FIGURE 38 EUROPE: EARLIER FORECAST VS. RECESSION FORECAST, 2023 (USD BILLION)
                    6.16.2.3 Asia Pacific
                               FIGURE 39 ASIA PACIFIC: INFLATION RATES, BY KEY COUNTRY, 2018–2021
                               FIGURE 40 ASIA PACIFIC: RECESSION IMPACT ANALYSIS
                    6.16.2.4 South America
                               FIGURE 41 SOUTH AMERICA: INFLATION RATES, BY KEY COUNTRY, 2018–2021
                               FIGURE 42 SOUTH AMERICA: EARLIER FORECAST VS. RECESSION FORECAST, 2023 (USD MILLION)
                    6.16.2.5 RoW
                               FIGURE 43 ROW: INFLATION RATES, BY KEY COUNTRY, 2018–2021
                               FIGURE 44 ROW: EARLIER FORECAST VS. RECESSION FORECAST, 2023 (USD MILLION)
 
7 SOY PROTEIN INGREDIENTS MARKET, BY TYPE (Page No. - 88)
    7.1 INTRODUCTION 
           TABLE 14 NUTRITIONAL COMPOSITION OF SOYBEAN
           TABLE 15 CHARACTERISTICS OF SOY PROTEIN INGREDIENTS IN APPLICATION SEGMENTS
           FIGURE 45 MARKET, BY TYPE, 2022 VS. 2027 (USD MILLION)
           TABLE 16 MARKET, BY TYPE, 2018–2021 (USD MILLION)
           TABLE 17 MARKET, BY TYPE, 2022–2027 (USD MILLION)
           TABLE 18 MARKET, BY TYPE, 2018–2021 (KT)
           TABLE 19 MARKET, BY TYPE, 2022–2027 (KT)
    7.2 SOY PROTEIN CONCENTRATES 
           7.2.1 RISE IN DEMAND FOR HIGH-PROTEIN BAKERY ITEMS
                    TABLE 20 SOY PROTEIN CONCENTRATES MARKET, BY REGION, 2018–2021 (USD MILLION)
                    TABLE 21 SOY PROTEIN CONCENTRATES MARKET, BY REGION, 2022–2027 (USD MILLION)
                    TABLE 22 SOY PROTEIN CONCENTRATES MARKET, BY REGION, 2018–2021 (KT)
                    TABLE 23 SOY PROTEIN CONCENTRATES MARKET, BY REGION, 2022–2027 (KT)
    7.3 SOY PROTEIN ISOLATES 
           7.3.1 FUNCTIONAL BENEFITS SOUGHT BY PHARMACEUTICAL INDUSTRY
                    TABLE 24 SOY PROTEIN ISOLATES MARKET, BY REGION, 2018–2021 (USD MILLION)
                    TABLE 25 SOY PROTEIN ISOLATES MARKET, BY REGION, 2022–2027 (USD MILLION)
                    TABLE 26 SOY PROTEIN ISOLATES MARKET, BY REGION, 2018–2021 (KT)
                    TABLE 27 SOY PROTEIN ISOLATES MARKET, BY REGION, 2022–2027 (KT)
    7.4 TEXTURED SOY PROTEIN 
           7.4.1 SIGNIFICANT RISE IN DEMAND FOR PLANT-BASED MEAT ALTERNATIVES
                    TABLE 28 TEXTURED SOY PROTEIN MARKET, BY REGION, 2018–2021 (USD MILLION)
                    TABLE 29 TEXTURED SOY PROTEIN MARKET, BY REGION, 2022–2027 (USD MILLION)
                    TABLE 30 TEXTURED SOY PROTEIN MARKET, BY REGION, 2018–2021 (KT)
                    TABLE 31 TEXTURED SOY PROTEIN MARKET, BY REGION, 2022–2027 (KT)
    7.5 SOY FLOUR 
           7.5.1 RISE IN CONSUMER DEMAND FOR GLUTEN-FREE FOODS
                    TABLE 32 SOY FLOUR USED IN VARIOUS FOOD APPLICATIONS
                    TABLE 33 SOY FLOUR MARKET, BY REGION, 2018–2021 (USD MILLION)
                    TABLE 34 SOY FLOUR MARKET, BY REGION, 2022–2027 (USD MILLION)
                    TABLE 35 SOY FLOUR MARKET, BY REGION, 2018–2021 (KT)
                    TABLE 36 SOY FLOUR: MARKET, BY REGION, 2022–2027 (KT)
    7.6 OTHER TYPES 
           TABLE 37 OTHER MARKET, BY REGION, 2018–2021 (USD MILLION)
           TABLE 38 OTHER MARKET, BY REGION, 2022–2027 (USD MILLION)
           TABLE 39 OTHER MARKET, BY REGION, 2018–2021 (KT)
           TABLE 40 OTHER MARKET, BY REGION, 2022–2027 (KT)
 
8 SOY PROTEIN INGREDIENTS MARKET, BY APPLICATION (Page No. - 103)
    8.1 INTRODUCTION 
           TABLE 41 INCORPORATION LEVEL OF SOY PROTEIN INGREDIENTS IN APPLICATIONS
           FIGURE 46 MARKET, BY APPLICATION, 2022 VS. 2027 (USD MILLION)
           TABLE 42 MARKET, BY APPLICATION, 2018–2021 (USD MILLION)
           TABLE 43 MARKET, BY APPLICATION, 2022–2027 (USD MILLION)
    8.2 FOOD 
           8.2.1 CONSUMER SHIFT TOWARD PLANT-BASED FOODS
                    TABLE 44 FOOD APPLICATION MARKET, BY REGION, 2018–2021 (USD MILLION)
                    TABLE 45 FOOD APPLICATION MARKET, BY REGION, 2022–2027 (USD MILLION)
                    TABLE 46 FOOD APPLICATION MARKET, BY SUBAPPLICATION, 2018–2021 (USD MILLION)
                    TABLE 47 FOOD APPLICATION MARKET, BY SUBAPPLICATION, 2022–2027 (USD MILLION)
           8.2.2 MEAT ALTERNATIVES
                    TABLE 48 APPLICATION OF SOY PROTEIN INGREDIENTS IN PROCESSED MUSCLE FOODS
           8.2.3 DAIRY ALTERNATIVES
           8.2.4 BAKERY PRODUCTS
           8.2.5 PERFORMANCE NUTRITION
           8.2.6 CONVENIENCE FOODS
           8.2.7 BEVERAGES
           8.2.8 OTHER FOOD APPLICATIONS
    8.3 FEED 
           8.3.1 GROWTH IN DEMAND FOR CLEAN LABEL AND SUSTAINABLE FEED PRODUCTS
                    TABLE 49 FEED APPLICATION MARKET, BY REGION, 2018–2021 (USD MILLION)
                    TABLE 50 FEED APPLICATION MARKET, BY REGION, 2022–2027 (USD MILLION)
                    TABLE 51 FEED APPLICATION MARKET, BY SUBAPPLICATION, 2018–2021 (USD MILLION)
                    TABLE 52 FEED APPLICATION MARKET, BY SUBAPPLICATION, 2022–2027 (USD MILLION)
           8.3.2 CATTLE
           8.3.3 SWINE
           8.3.4 POULTRY
           8.3.5 PET FOOD
           8.3.6 AQUAFEED
 
9 SOY PROTEIN INGREDIENTS MARKET, BY FORM (Page No. - 115)
    9.1 INTRODUCTION 
           FIGURE 47 DRY INGREDIENTS TO DOMINATE MARKET FROM 2022 TO 2027 (USD MILLION)
           TABLE 53 MARKET, BY FORM, 2018–2021 (USD MILLION)
           TABLE 54 MARKET, BY FORM, 2022–2027 (USD MILLION)
    9.2 DRY 
           9.2.1 LONGER SHELF LIFE, CONSISTENT MOUTH FEEL, AND EASE OF USE OF DRY INGREDIENTS IN RECIPES
                    TABLE 55 DRY MARKET, BY REGION, 2018–2021 (USD MILLION)
                    TABLE 56 DRY MARKET, BY REGION, 2022–2027 (USD MILLION)
    9.3 LIQUID 
           9.3.1 EASY BLENDABILITY AND RISE IN DEMAND FOR RTD BEVERAGES AND INFANT NUTRITION
                    TABLE 57 LIQUID MARKET, BY REGION, 2018–2021 (USD MILLION)
                    TABLE 58 LIQUID MARKET, BY REGION, 2022–2027 (USD MILLION)
 
10 MARKET, BY NATURE (Page No. - 119)
     10.1 INTRODUCTION 
               FIGURE 48 CONVENTIONAL SEGMENT TO DOMINATE BY MARKET FROM 2022 TO 2027 (USD MILLION)
               TABLE 59 MARKET, BY NATURE, 2018–2021 (USD MILLION)
               TABLE 60 MARKET, BY NATURE, 2022–2027 (USD MILLION)
     10.2 CONVENTIONAL 
             10.2.1 SIGNIFICANTLY LOWER PRICES OF FOOD ITEMS PRODUCED CONVENTIONALLY
                       TABLE 61 CONVENTIONAL MARKET, BY REGION, 2018–2021 (USD MILLION)
                       TABLE 62 CONVENTIONAL MARKET, BY REGION, 2022–2027 (USD MILLION)
     10.3 ORGANIC 
             10.3.1 HIGH CONSUMER DEMAND AND PREFERENCE FOR THEIR HEALTH BENEFITS
                       TABLE 63 ORGANIC MARKET, BY REGION, 2018–2021 (USD MILLION)
                       TABLE 64 ORGANIC MARKET, BY REGION, 2022–2027 (USD MILLION)
 
11 MARKET, BY FUNCTION (Page No. - 124)
     11.1 INTRODUCTION 
     11.2 MUSCLE HEALTH 
             11.2.1 POST-PANDEMIC CONSUMER SHIFT TOWARD HIGH PROTEIN INTAKE FOR MUSCLE HEALTH
     11.3 HEART HEALTH 
             11.3.1 PREFERENCE FOR ALTERNATIVES AS HEART DISEASES ARE ASSOCIATED WITH RED MEAT
     11.4 WEIGHT MANAGEMENT 
             11.4.1 SIGNIFICANCE OF WEIGHT MANAGEMENT IN COMBATING VARIOUS HEALTH CONCERNS
     11.5 OTHER FUNCTIONS 
 
12 SOY PROTEIN INGREDIENTS MARKET, BY REGION (Page No. - 126)
     12.1 INTRODUCTION 
               FIGURE 49 MARKET: GEOGRAPHIC GROWTH OPPORTUNITIES
               TABLE 65 MARKET, BY REGION, 2018–2021 (USD MILLION)
               TABLE 66 MARKET, BY REGION, 2022–2027 (USD MILLION)
               TABLE 67 MARKET, BY REGION, 2018–2021 (KT)
               TABLE 68 MARKET, BY REGION, 2022–2027 (KT)
     12.2 NORTH AMERICA 
               FIGURE 50 NORTH AMERICA: MARKET SNAPSHOT
               TABLE 69 NORTH AMERICA: MARKET, BY COUNTRY, 2018–2021 (USD MILLION)
               TABLE 70 NORTH AMERICA: MARKET, BY COUNTRY, 2022–2027 (USD MILLION)
               TABLE 71 NORTH AMERICA: MARKET, BY TYPE, 2018–2021 (USD MILLION)
               TABLE 72 NORTH AMERICA: MARKET, BY TYPE, 2022–2027 (USD MILLION)
               TABLE 73 NORTH AMERICA: MARKET, BY APPLICATION, 2018–2021 (USD MILLION)
               TABLE 74 NORTH AMERICA: MARKET, BY APPLICATION, 2022–2027 (USD MILLION)
               TABLE 75 NORTH AMERICA: MARKET, BY FORM, 2018–2021 (USD MILLION)
               TABLE 76 NORTH AMERICA: MARKET, BY FORM, 2022–2027 (USD MILLION)
               TABLE 77 NORTH AMERICA: MARKET, BY NATURE, 2018–2021 (USD MILLION)
               TABLE 78 NORTH AMERICA: MARKET, BY NATURE, 2022–2027 (USD MILLION)
             12.2.1 US
                       12.2.1.1 Increased consumption and dependency on plant-based meat and dairy alternatives
                                   TABLE 79 US: MARKET, BY TYPE, 2018–2021 (USD MILLION)
                                   TABLE 80 US: MARKET, BY TYPE, 2022–2027 (USD MILLION)
             12.2.2 CANADA
                       12.2.2.1 Shift toward plant-based foods from conventional animal-source products
                                   TABLE 81 CANADA: MARKET, BY TYPE, 2018–2021 (USD MILLION)
                                   TABLE 82 CANADA: MARKET, BY TYPE, 2022–2027 (USD MILLION)
             12.2.3 MEXICO
                       12.2.3.1 Change in diet patterns and rise in disposable income
                                   TABLE 83 MEXICO: MARKET, BY TYPE, 2018–2021 (USD MILLION)
                                   TABLE 84 MEXICO: MARKET, BY TYPE, 2022–2027 (USD MILLION)
     12.3 EUROPE 
               TABLE 85 EUROPE: MARKET, BY COUNTRY/REGION, 2018–2021 (USD MILLION)
               TABLE 86 EUROPE: MARKET, BY COUNTRY/REGION, 2022–2027 (USD MILLION)
               TABLE 87 EUROPE: MARKET, BY TYPE, 2018–2021 (USD MILLION)
               TABLE 88 EUROPE: MARKET, BY TYPE, 2022–2027 (USD MILLION)
               TABLE 89 EUROPE: MARKET, BY TYPE, 2018–2021 (KT)
               TABLE 90 EUROPE: MARKET, BY TYPE, 2022–2027 (KT)
               TABLE 91 EUROPE: MARKET, BY APPLICATION, 2018–2021 (USD MILLION)
               TABLE 92 EUROPE: MARKET, BY APPLICATION, 2022–2027 (USD MILLION)
               TABLE 93 EUROPE: MARKET, BY FORM, 2018–2021 (USD MILLION)
               TABLE 94 EUROPE: MARKET, BY FORM, 2022–2027 (USD MILLION)
               TABLE 95 EUROPE: MARKET, BY NATURE, 2018–2021 (USD MILLION)
               TABLE 96 EUROPE: SOY PROTEIN INGREDIENTS MARKET, BY NATURE, 2022–2027 (USD MILLION)
             12.3.1 GERMANY
                       12.3.1.1 Higher consumption of plant-based food and adoption of flexitarian diets
                                   TABLE 97 GERMANY: MARKET, BY TYPE, 2018–2021 (USD MILLION)
                                   TABLE 98 GERMANY: MARKET, BY TYPE, 2022–2027 (USD MILLION)
             12.3.2 FRANCE
                       12.3.2.1 Government measures to increase production of plant-based protein
                                   TABLE 99 FRANCE: MARKET, BY TYPE, 2018–2021 (USD MILLION)
                                   TABLE 100 FRANCE: MARKET, BY TYPE, 2022–2027 (USD MILLION)
             12.3.3 UK
                       12.3.3.1 Increased health awareness among consumers
                                   TABLE 101 UK: MARKET, BY TYPE, 2018–2021 (USD MILLION)
                                   TABLE 102 UK: MARKET, BY TYPE, 2022–2027 (USD MILLION)
             12.3.4 ITALY
                       12.3.4.1 Rise in consumer preference for plant-based proteins
                                   TABLE 103 ITALY: MARKET, BY TYPE, 2018–2021 (USD MILLION)
                                   TABLE 104 ITALY: MARKET, BY TYPE, 2022–2027 (USD MILLION)
             12.3.5 SPAIN
                       12.3.5.1 Robust growth of plant-based food sector
                                   TABLE 105 SPAIN: MARKET, BY TYPE, 2018–2021 (USD MILLION)
                                   TABLE 106 SPAIN: MARKET, BY TYPE, 2022–2027 (USD MILLION)
             12.3.6 NETHERLANDS
                       12.3.6.1 Transition toward plant-based food systems
                                   TABLE 107 NETHERLANDS: MARKET, BY TYPE, 2018–2021 (USD MILLION)
                                   TABLE 108 NETHERLANDS: MARKET, BY TYPE, 2022–2027 (USD MILLION)
             12.3.7 BELGIUM
                       12.3.7.1 Rise in vegan and flexitarian population
                                   TABLE 109 BELGIUM: MARKET, BY TYPE, 2018–2021 (USD MILLION)
                                   TABLE 110 BELGIUM: MARKET, BY TYPE, 2022–2027 (USD MILLION)
             12.3.8 REST OF EUROPE
                       TABLE 111 REST OF EUROPE: MARKET, BY TYPE, 2018–2021 (USD MILLION)
                       TABLE 112 REST OF EUROPE: MARKET, BY TYPE, 2022–2027 (USD MILLION)
     12.4 ASIA PACIFIC 
               FIGURE 51 ASIA PACIFIC: MARKET SNAPSHOT
               TABLE 113 ASIA PACIFIC: MARKET, BY COUNTRY/REGION, 2018–2021 (USD MILLION)
               TABLE 114 ASIA PACIFIC: MARKET, BY COUNTRY/REGION, 2022–2027 (USD MILLION)
               TABLE 115 ASIA PACIFIC: MARKET, BY TYPE, 2018–2021 (USD MILLION)
               TABLE 116 ASIA PACIFIC: MARKET, BY TYPE, 2022–2027 (USD MILLION)
               TABLE 117 ASIA PACIFIC: MARKET, BY APPLICATION, 2018–2021 (USD MILLION)
               TABLE 118 ASIA PACIFIC: MARKET, BY APPLICATION, 2022–2027 (USD MILLION)
               TABLE 119 ASIA PACIFIC: MARKET, BY FORM, 2018–2021 (USD MILLION)
               TABLE 120 ASIA PACIFIC: MARKET, BY FORM, 2022–2027 (USD MILLION)
               TABLE 121 ASIA PACIFIC: MARKET, BY NATURE, 2018–2021 (USD MILLION)
               TABLE 122 ASIA PACIFIC: MARKET, BY NATURE, 2022–2027 (USD MILLION)
             12.4.1 CHINA
                       12.4.1.1 Robust soy protein ingredient supply chain and adoption of plant-based food
                                   TABLE 123 CHINA: SOY PROTEIN INGREDIENTS MARKET, BY TYPE, 2018–2021 (USD MILLION)
                                   TABLE 124 CHINA: MARKET, BY TYPE, 2022–2027 (USD MILLION)
             12.4.2 JAPAN
                       12.4.2.1 Increase in geriatric population
                                   TABLE 125 JAPAN: MARKET, BY TYPE, 2018–2021 (USD MILLION)
                                   TABLE 126 JAPAN: MARKET, BY TYPE, 2022–2027 (USD MILLION)
             12.4.3 INDIA
                       12.4.3.1 Large vegetarian population and prevalence of cardiovascular diseases
                                   TABLE 127 INDIA: MARKET, BY TYPE, 2018–2021 (USD MILLION)
                                   TABLE 128 INDIA: MARKET, BY TYPE, 2022–2027 (USD MILLION)
             12.4.4 AUSTRALIA & NEW ZEALAND
                       12.4.4.1 Government initiatives to support plant protein sector
                                   TABLE 129 AUSTRALIA & NEW ZEALAND: MARKET, BY TYPE, 2018–2021 (USD MILLION)
                                   TABLE 130 AUSTRALIA & NEW ZEALAND: MARKET, BY TYPE, 2022–2027 (USD MILLION)
             12.4.5 REST OF ASIA PACIFIC
                       TABLE 131 REST OF ASIA PACIFIC: MARKET, BY TYPE, 2018–2021 (USD MILLION)
                       TABLE 132 REST OF ASIA PACIFIC: MARKET, BY TYPE, 2022–2027 (USD MILLION)
     12.5 SOUTH AMERICA 
               TABLE 133 SOUTH AMERICA: MARKET, BY COUNTRY/REGION, 2018–2021 (USD MILLION)
               TABLE 134 SOUTH AMERICA: MARKET, BY COUNTRY/REGION, 2022–2027 (USD MILLION)
               TABLE 135 SOUTH AMERICA: MARKET, BY TYPE, 2018–2021 (USD MILLION)
               TABLE 136 SOUTH AMERICA: MARKET, BY TYPE, 2022–2027 (USD MILLION)
               TABLE 137 SOUTH AMERICA: MARKET, BY APPLICATION, 2018–2021 (USD MILLION)
               TABLE 138 SOUTH AMERICA: MARKET, BY APPLICATION, 2022–2027 (USD MILLION)
               TABLE 139 SOUTH AMERICA: MARKET, BY FORM, 2018–2021 (USD MILLION)
               TABLE 140 SOUTH AMERICA: MARKET, BY FORM, 2022–2027 (USD MILLION)
               TABLE 141 SOUTH AMERICA: MARKET, BY NATURE, 2018–2021 (USD MILLION)
               TABLE 142 SOUTH AMERICA: MARKET, BY NATURE, 2022–2027 (USD MILLION)
             12.5.1 BRAZIL
                       12.5.1.1 Boost in soybean production and processing ecosystem
                                   TABLE 143 BRAZIL: MARKET, BY TYPE, 2018–2021 (USD MILLION)
                                   TABLE 144 BRAZIL: MARKET, BY TYPE, 2022–2027 (USD MILLION)
             12.5.2 ARGENTINA
                       12.5.2.1 Rise in obesity incidence rates
                                   TABLE 145 ARGENTINA: MARKET, BY TYPE, 2018–2021 (USD MILLION)
                                   TABLE 146 ARGENTINA: MARKET, BY TYPE, 2022–2027 (USD MILLION)
             12.5.3 REST OF SOUTH AMERICA
                       TABLE 147 REST OF SOUTH AMERICA: MARKET, BY TYPE, 2018–2021 (USD MILLION)
                       TABLE 148 REST OF SOUTH AMERICA: MARKET, BY TYPE, 2022–2027 (USD MILLION)
     12.6 ROW 
               TABLE 149 ROW: SOY PROTEIN INGREDIENTS MARKET, BY REGION, 2018–2021 (USD MILLION)
               TABLE 150 ROW: MARKET, BY REGION, 2022–2027 (USD MILLION)
               TABLE 151 ROW: MARKET, BY TYPE, 2018–2021 (USD MILLION)
               TABLE 152 ROW: MARKET, BY TYPE, 2022–2027 (USD MILLION)
               TABLE 153 ROW: MARKET, BY APPLICATION, 2018–2021 (USD MILLION)
               TABLE 154 ROW: MARKET, BY APPLICATION, 2022–2027 (USD MILLION)
               TABLE 155 ROW: MARKET, BY FORM, 2018–2021 (USD MILLION)
               TABLE 156 ROW: MARKET, BY FORM, 2022–2027 (USD MILLION)
               TABLE 157 ROW: MARKET, BY NATURE, 2018–2021 (USD MILLION)
               TABLE 158 ROW: MARKET, BY NATURE, 2022–2027 (USD MILLION)
             12.6.1 AFRICA
                       12.6.1.1 Surge in cases of malnutrition
                                   TABLE 159 AFRICA: MARKET, BY TYPE, 2018–2021 (USD MILLION)
                                   TABLE 160 AFRICA: MARKET, BY TYPE, 2022–2027 (USD MILLION)
             12.6.2 MIDDLE EAST
                       12.6.2.1 Rise in incidences of obesity and diabetes
                                   TABLE 161 MIDDLE EAST: MARKET, BY TYPE, 2018–2021 (USD MILLION)
                                   TABLE 162 MIDDLE EAST: MARKET, BY TYPE, 2022–2027 (USD MILLION)
 
13 COMPETITIVE LANDSCAPE (Page No. - 169)
     13.1 OVERVIEW 
     13.2 MARKET SHARE ANALYSIS 
               TABLE 163 GLOBAL MARKET: DEGREE OF COMPETITION (COMPETITIVE)
     13.3 SEGMENTAL REVENUE ANALYSIS OF KEY PLAYERS 
               FIGURE 52 SEGMENTAL REVENUE ANALYSIS OF KEY PLAYERS, 2017–2021 (USD MILLION)
     13.4 KEY PLAYER STRATEGIES 
               TABLE 164 STRATEGIES ADOPTED BY KEY SOY PROTEIN INGREDIENTS MANUFACTURERS
     13.5 COMPANY EVALUATION QUADRANT (KEY PLAYERS) 
             13.5.1 STARS
             13.5.2 EMERGING LEADERS
             13.5.3 PERVASIVE PLAYERS
             13.5.4 PARTICIPANTS
                       FIGURE 53 SOY PROTEIN INGREDIENTS MARKET: COMPANY EVALUATION QUADRANT, 2021 (KEY PLAYERS)
     13.6 PRODUCT FOOTPRINT 
               TABLE 165 COMPANY INGREDIENT FOOTPRINT
               TABLE 166 COMPANY APPLICATION FOOTPRINT
               TABLE 167 COMPANY REGIONAL FOOTPRINT
               TABLE 168 OVERALL COMPANY FOOTPRINT
     13.7 EVALUATION QUADRANT FOR STARTUPS/SMES 
             13.7.1 PROGRESSIVE COMPANIES
             13.7.2 STARTING BLOCKS
             13.7.3 RESPONSIVE COMPANIES
             13.7.4 DYNAMIC COMPANIES
                       FIGURE 54 MARKET: COMPANY EVALUATION QUADRANT, 2021 (STARTUPS/SMES)
             13.7.5 COMPETITIVE BENCHMARKING OF KEY STARTUPS/SMES
                       TABLE 169 MARKET: DETAILED LIST OF KEY STARTUPS/SMES
                       TABLE 170 MARKET: COMPETITIVE BENCHMARKING OF KEY STARTUPS/SMES
     13.8 COMPETITIVE SCENARIO 
             13.8.1 NEW PRODUCT LAUNCHES
                       TABLE 171 SOY PROTEIN INGREDIENTS: NEW PRODUCT LAUNCHES, 2019–2022
             13.8.2 DEALS
                       TABLE 172 SOY PROTEIN INGREDIENTS: DEALS, 2018–2022
             13.8.3 OTHER DEVELOPMENTS
                       TABLE 173 SOY PROTEIN INGREDIENTS: OTHER DEVELOPMENTS, 2019–2022
 
14 COMPANY PROFILES (Page No. - 185)
     14.1 KEY COMPANIES 
(Business Overview, Solutions, Products & Services offered Recent Developments, MnM View)*
             14.1.1 ADM
                       TABLE 174 ADM: BUSINESS OVERVIEW, 2021
                       FIGURE 55 ADM: COMPANY SNAPSHOT
                       TABLE 175 ADM: PRODUCTS/SOLUTIONS/SERVICES OFFERED
                       TABLE 176 ADM: DEALS
                       TABLE 177 ADM: OTHERS
             14.1.2 WILMAR INTERNATIONAL LTD
                       TABLE 178 WILMAR INTERNATIONAL LTD: BUSINESS OVERVIEW, 2021
                       FIGURE 56 WILMAR INTERNATIONAL LTD: COMPANY SNAPSHOT
                       TABLE 179 WILMAR INTERNATIONAL LTD: PRODUCTS/SOLUTIONS/SERVICES OFFERED
                       TABLE 180 WILMAR INTERNATIONAL LTD: DEALS
             14.1.3 CARGILL, INCORPORATED
                       TABLE 181 CARGILL, INCORPORATED: SOY PROTEIN INGREDIENTS MARKET BUSINESS OVERVIEW, 2021
                       FIGURE 57 CARGILL, INCORPORATED: COMPANY SNAPSHOT
                       TABLE 182 CARGILL, INCORPORATED: PRODUCTS/SOLUTIONS/SERVICES OFFERED
                       TABLE 183 CARGILL, INCORPORATED: DEALS
                       TABLE 184 CARGILL, INCORPORATED: OTHERS
             14.1.4 INTERNATIONAL FLAVORS & FRAGRANCES INC.
                       TABLE 185 INTERNATIONAL FLAVORS & FRAGRANCES INC.: BUSINESS OVERVIEW, 2021
                       FIGURE 58 INTERNATIONAL FLAVORS & FRAGRANCES INC.: COMPANY SNAPSHOT
                       TABLE 186 INTERNATIONAL FLAVORS & FRAGRANCES INC.: PRODUCTS/SOLUTIONS/SERVICES OFFERED
                       TABLE 187 INTERNATIONAL FLAVORS & FRAGRANCES INC.: NEW PRODUCT LAUNCHES
                       TABLE 188 INTERNATIONAL FLAVORS & FRAGRANCES INC.: DEALS
             14.1.5 CHS INC.
                       TABLE 189 CHS INC.: BUSINESS OVERVIEW, 2021
                       FIGURE 59 CHS INC.: COMPANY SNAPSHOT
                       TABLE 190 CHS INC.: PRODUCTS/SOLUTIONS/SERVICES OFFERED
                       TABLE 191 CHS INC.: OTHERS
             14.1.6 BRF GLOBAL
                       TABLE 192 BRF GLOBAL: BUSINESS OVERVIEW, 2021
                       FIGURE 60 BRF GLOBAL: COMPANY SNAPSHOT
                       TABLE 193 BRF GLOBAL: PRODUCTS/SOLUTIONS/SERVICES OFFERED
             14.1.7 FUJI OIL HOLDINGS INC.
                       TABLE 194 FUJI OIL HOLDINGS INC.: BUSINESS OVERVIEW, 2021
                       FIGURE 61 FUJI OIL HOLDINGS INC.: COMPANY SNAPSHOT
                       TABLE 195 FUJI OIL HOLDINGS INC.: PRODUCTS/SOLUTIONS/SERVICES OFFERED
                       TABLE 196 FUJI OIL HOLDINGS INC.: OTHERS
             14.1.8 DEVANSOY
                       TABLE 197 DEVANSOY: BUSINESS OVERVIEW, 2021
                       TABLE 198 DEVANSOY: PRODUCTS/SOLUTIONS/SERVICES OFFERED
             14.1.9 CROWN SOYA PROTEIN GROUP COMPANY
                       TABLE 199 CROWN SOYA PROTEIN GROUP COMPANY: BUSINESS OVERVIEW, 2021
                       TABLE 200 CROWN SOYA PROTEIN GROUP COMPANY: PRODUCTS/SOLUTIONS/SERVICES OFFERED
             14.1.10 AG PROCESSING INC.
                       TABLE 201 AG PROCESSING INC.: SOY PROTEIN INGREDIENTS MARKET BUSINESS OVERVIEW, 2021
                       TABLE 202 AG PROCESSING INC.: PRODUCTS/SOLUTIONS/SERVICES OFFERED
                       TABLE 203 AG PROCESSING INC.: OTHERS
             14.1.11 THE SCOULAR COMPANY
                       TABLE 204 THE SCOULAR COMPANY: BUSINESS OVERVIEW, 2021
                       FIGURE 62 THE SCOULAR COMPANY: COMPANY SNAPSHOT
                       TABLE 205 THE SCOULAR COMPANY: PRODUCTS/SOLUTIONS/SERVICES OFFERED
                       TABLE 206 THE SCOULAR COMPANY: DEALS
                       TABLE 207 THE SCOULAR COMPANY: OTHERS
             14.1.12 TITAN BIOTECH
                       TABLE 208 TITAN BIOTECH: BUSINESS OVERVIEW, 2021
                       FIGURE 63 TITAN BIOTECH: COMPANY SNAPSHOT
                       TABLE 209 TITAN BIOTECH: PRODUCTS/SOLUTIONS/SERVICES OFFERED
             14.1.13 LINYI SHANSONG BIOLOGICAL PRODUCTS CO., LTD
                       TABLE 210 LINYI SHANSONG BIOLOGICAL PRODUCTS CO., LTD: BUSINESS OVERVIEW, 2021
                       TABLE 211 LINYI SHANSONG BIOLOGICAL PRODUCTS CO., LTD: PRODUCTS/SOLUTIONS/SERVICES OFFERED
             14.1.14 FOODCHEM INTERNATIONAL CORPORATION
                       TABLE 212 FOODCHEM INTERNATIONAL CORPORATION: BUSINESS OVERVIEW, 2021
                       TABLE 213 FOODCHEM INTERNATIONAL CORPORATION: PRODUCTS/SOLUTIONS/SERVICES OFFERED
             14.1.15 FARBEST TALLMAN FOODS CORPORATION
                       TABLE 214 FARBEST TALLMAN FOODS CORPORATION: BUSINESS OVERVIEW, 2021
                       TABLE 215 FARBEST TALLMAN FOODS CORPORATION: PRODUCTS/SOLUTIONS/SERVICES OFFERED
     14.2 OTHER PLAYERS 
             14.2.1 NOW FOODS
                       TABLE 216 NOW FOODS: COMPANY OVERVIEW
             14.2.2 SOTEXPRO
                       TABLE 217 SOTEXPRO: COMPANY OVERVIEW
             14.2.3 SHANDONG SINOGLORY HEALTH FOOD CO., LTD
                       TABLE 218 SHANDONG SINOGLORY HEALTH FOOD CO., LTD: COMPANY OVERVIEW
             14.2.4 PROCESS AGROCHEM INDUSTRIES PVT LTD.
                       TABLE 219 PROCESS AGROCHEM INDUSTRIES PVT. LTD.: COMPANY OVERVIEW
             14.2.5 CJ SELECTA
                       TABLE 220 CJ SELECTA: COMPANY OVERVIEW
             14.2.6 TAJ AGRO INTERNATIONAL
                       TABLE 221 TAJ AGRO INTERNATIONAL: COMPANY OVERVIEW
             14.2.7 NORDIC SOYA OY
                       TABLE 222 NORDIC SOYA OY: COMPANY OVERVIEW
             14.2.8 BREMIL GROUP
                       TABLE 223 BREMIL GROUP: COMPANY OVERVIEW
             14.2.9 RIO PARDO PROTEINA VEGETAL S.A.
                       TABLE 224 RIO PARDO PROTEINA VEGETAL S.A.: SOY PROTEIN INGREDIENTS MARKET  COMPANY OVERVIEW
             14.2.10 LIVING FOODS
                       TABLE 225 LIVING FOODS: COMPANY OVERVIEW
*Details on Business Overview, Solutions Products & Services offered, Key Insights, Recent Developments, MnM View might not be captured in case of unlisted companies.
 
15 ADJACENT AND RELATED MARKETS (Page No. - 234)
     15.1 INTRODUCTION 
               TABLE 226 ADJACENT MARKETS
     15.2 RESEARCH LIMITATIONS 
     15.3 PROTEIN INGREDIENTS MARKET 
             15.3.1 MARKET DEFINITION
             15.3.2 MARKET OVERVIEW
                       TABLE 227 PROTEIN INGREDIENTS MARKET, BY SOURCE, 2020–2025 (USD MILLION)
     15.4 PLANT-BASED PROTEIN MARKET 
             15.4.1 MARKET DEFINITION
             15.4.2 MARKET OVERVIEW
                       TABLE 228 PLANT-BASED PROTEIN MARKET, BY TYPE, 2019–2027 (USD MILLION)
 
16 APPENDIX (Page No. - 237)
     16.1 DISCUSSION GUIDE 
     16.2 KNOWLEDGESTORE: MARKETSANDMARKETS’ SUBSCRIPTION PORTAL 
     16.3 CUSTOMIZATION OPTIONS 
     16.4 RELATED REPORTS 
     16.5 AUTHOR DETAILS 

This research study involved the extensive use of secondary sources—directories and databases such as Bloomberg Businessweek and Factiva—to identify and collect information useful for a technical, market-oriented, and commercial study of the soy protein ingredients market. In-depth interviews were conducted with various primary respondents—such as key industry participants, subject matter experts (SMEs), C-level executives of key market players, and industry consultants—to obtain and verify critical qualitative and quantitative information and assess prospects. The following figure depicts the research design applied in drafting this report on the market.

Secondary Research

In the secondary research process, various sources such as annual reports, press releases & investor presentations of companies, white papers, food journals, certified publications, articles from recognized authors, gold & silver standard websites, directories, and databases, were referred to identify and collect information.

Secondary research was mainly used to obtain key information about the industry’s supply chain, the total pool of key players, and market classification and segmentation as per the industry trends to the bottom-most level, regional markets, and key developments from both market- and technology-oriented perspectives

Primary Research

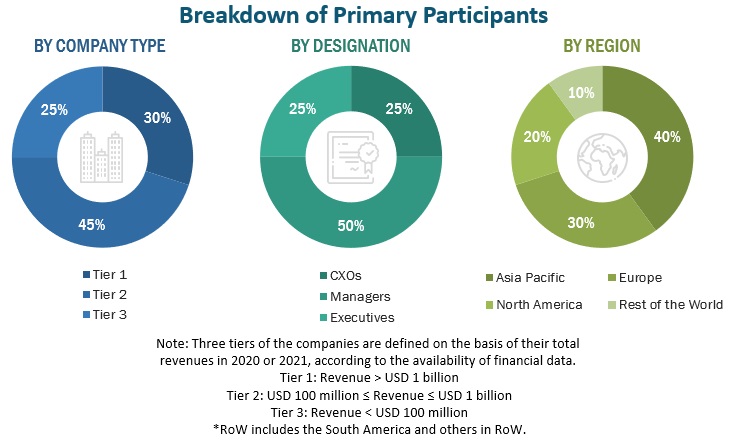
In the primary research process, various sources from the supply and demand sides were interviewed to obtain qualitative and quantitative information. The primary sources from the supply side included industry experts such as CEOs, vice presidents, marketing directors, technology and innovation directors, and related key executives from various key companies and organizations operating in the soy protein ingredients market.
Soy Protein Ingredients Market Primary Respondents

To know about the assumptions considered for the study, download the pdf brochure

Soy Protein Ingredients Market Size Estimation

  • Both the top-down and bottom-up approaches were used to estimate and validate the total size of the market. These methods were also used extensively to estimate the size of the various subsegments in the market. The research methodology used to estimate the market size includes the following:
  • The key players in the industry and market have been identified through extensive secondary research.
  • The revenues of major soy protein ingredients-based food and feed manufacturers were determined through primary and secondary research, such as paid databases, which were used as the basis for market estimation.
  • All macroeconomic and microeconomic factors affecting the growth of the soy protein ingredients market were considered while estimating the market size.
  • All possible parameters that affect the market covered in this research study were accounted for, viewed in extensive detail, verified through primary research, and analyzed to obtain final quantitative and qualitative data.

Data Triangulation

After arriving at the overall market size from the estimation process explained above, the total market was split into several segments and subsegments. To complete the overall market engineering process and arrive at the exact statistics for all segments and subsegments, data triangulation and market breakdown procedures were employed wherever applicable. The data was triangulated by studying various factors and trends from the demand and supply sides. Along with this, the market size was validated using the top-down and bottom-up approaches.

Report Objectives

  • To define, segment, and project the global soy protein ingredients market on the basis of type, application, form, nature, function and region
  • To provide detailed information regarding the key factors influencing the growth of the market (drivers, restraints, opportunities, and industry-specific challenges)
  • To strategically analyze the micromarkets with respect to individual growth trends, future prospects, and their contribution to the total market
  • To analyze the opportunities in the market for stakeholders and provide a competitive landscape of the market leaders
  • To project the size of the market and its submarkets, in terms of value and volume, with respect to the regions (along with the key countries)
  • To strategically profile the key players and comprehensively analyze their market position and core competencies
  • To analyze the competitive developments such as joint ventures, mergers & acquisitions, new product developments, and research & developments in the market

Available Customizations:

With the given market data, MarketsandMarkets offers customizations according to company-specific scientific needs.

The following customization options are available for the report:

Product Analysis

  • Product Matrix, which gives a detailed comparison of the product portfolio of each company

Geographic Analysis

With the given market data, MarketsandMarkets offers customizations according to the company-specific scientific needs.

  • Further breakdown of the Rest of Europe region for soy protein ingredients market into Denmark, Russia, and other EU and non-EU countries.
  • Further breakdown of the Asia Pacific region for market into Thailand, Vietnam, Indonesia, South Korea, Malaysia, Singapore, and the Philippines.
  • Further breakdown of the Rest of South America region for market into Colombia, Chile, and Peru.
  • Further breakdown of other countries in the RoW market for market into Middle East and Africa

Company Information

  • Detailed analyses and profiling of additional market players (up to five)
Custom Market Research Services

We will customize the research for you, in case the report listed above does not meet with your exact requirements. Our custom research will comprehensively cover the business information you require to help you arrive at strategic and profitable business decisions.

Request Customization

Instant Answers with GPT - Ask Now!

Ask real questions. Get complete answers !
Report Code
FB 2092
Published ON
Jan, 2023
Choose License Type
BUY NOW
  • SHARE
X
Request Customization
Speak to Analyst
Speak to Analyst
OR FACE-TO-FACE MEETING
PERSONALIZE THIS RESEARCH
  • Triangulate with your Own Data
  • Get Data as per your Format and Definition
  • Gain a Deeper Dive on a Specific Application, Geography, Customer or Competitor
  • Any level of Personalization
REQUEST A FREE CUSTOMIZATION
LET US HELP YOU!
  • What are the Known and Unknown Adjacencies Impacting the Soy Protein Ingredients Market
  • What will your New Revenue Sources be?
  • Who will be your Top Customer; what will make them switch?
  • Defend your Market Share or Win Competitors
  • Get a Scorecard for Target Partners
CUSTOMIZED WORKSHOP REQUEST
  • Call Us
  • +1-888-600-6441 (Corporate office hours)
  • +1-888-600-6441 (US/Can toll free)
  • +44-800-368-9399 (UK office hours)
CONNECT WITH US
ABOUT TRUST ONLINE
©2024 MarketsandMarkets Research Private Ltd. All rights reserved
DMCA.com Protection Status
Website Feedback