Structural Health Monitoring Market

Structural Health Monitoring Market Size, Share, Industry Growth, Trends & Analysis by Offering (Hardware, Software & Services), Technology (Wired, Wireless), Vertical (Civil Infrastructure, Aerospace & Defense, Energy, Mining), Implementation, Application and Region - Global Forecast to 2029

Report Code: SE 3865 Apr, 2024, by marketsandmarkets.com

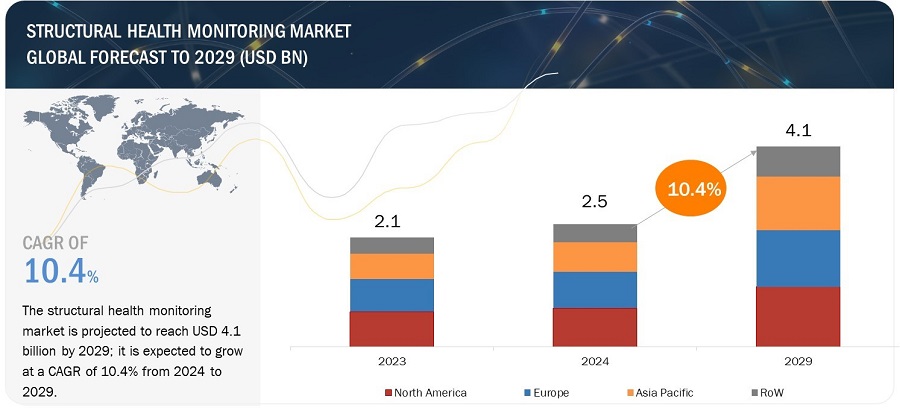
[254 Pages Report] The global structural health monitoring market Size, Share, Industry Growth, Trends & Analysis was valued at USD 2.5 billion in 2024 and is projected to reach USD 4.1 billion by 2029; it is expected to register a CAGR of 10.4% during the forecast period. Aging infrastructure, increased infrastructure investment, and stringent safety regulations are among the major factors driving the growth of the Structural health monitoring for preventive maintenance and risk mitigation. Advancements in sensor technology, data analytics, and machine learning enhance monitoring capabilities, enabling real-time anomaly detection and predictive maintenance. Integration with building information modeling (BIM) further enhances monitoring, analysis, and decision-making throughout a structure's lifecycle.
Structural Health Monitoring Market

Structural Health Monitoring Market

Structural Health Monitoring Market Forecast to 2029

To know about the assumptions considered for the study, Request for Free Sample Report

Market Dynamics:

Driver: Government regulations pertaining to sustainable structures

Catastrophic failure of structures not only poses a risk to public safety but also leads to heavy monetary losses. For instance, the failure of dams can lead to the impairment of other structures such as bridges, roads, and water systems, resulting in risk to life as well as monetary losses. To improve public safety, such risks related to structures must be reduced. Hence, most governments around the world are focused on improving communication and coordination across governing agencies, developing tools based on advanced technology, promoting emergency action plans (EAP), and modifying regulatory policies to ensure the safety of infrastructure. Regulations, such as those outlined in the Guiding Principles for Sustainable Federal Buildings, emphasize the importance of energy efficiency, water conservation, indoor environmental quality, materials sustainability, and resilience in building design, construction, and operation. In US, building energy codes are established by the US Department of Energy, often based on ASHRAE standards, with many states and municipalities adopting these codes or implementing even stricter energy efficiency requirements. In the European Union, ambitious energy performance regulations target near-zero energy buildings by 2050, while regulations promote sustainable materials through recycled content and forestry practices. In India, the government promotes green building practices through the Energy Conservation Building Code (ECBC) and incentivizes LEED certification, alongside public procurement policies encouraging sustainable construction in government buildings.

By mandating sustainable practices, government regulations ensure that structures are built and maintained to high-performance standards, reducing environmental impact, conserving resources, and promoting occupant health and safety. Compliance with these regulations often necessitates the implementation of SHM strategies to monitor the structural health, performance, and sustainability of buildings over time. Therefore, government regulations play a crucial role in driving the adoption of SHM practices to meet sustainability requirements, enhance building performance, and ensure the long-term viability of structures in alignment with regulatory mandates.

Restraint: High Implementation Costs

Installing and maintaining Structural Health Monitoring (SHM) systems can be a costly endeavor, with expenses varying based on several factors. The cost is influenced by the size and complexity of the structure being monitored, as larger or more intricate buildings may require a greater number of sensors and more sophisticated monitoring systems. Additionally, the type and quantity of sensors needed, along with the chosen data acquisition and analysis platform, contribute to the overall cost of implementing an SHM system. This variability in costs can pose a significant barrier for smaller structures or projects with limited budgets, potentially limiting their ability to invest in comprehensive SHM solutions. The financial implications associated with SHM highlight the importance of considering budget constraints and cost-effectiveness when planning for the installation and maintenance of monitoring systems, especially for smaller structures or projects with restricted financial resources.

Opportunity: Increasing investments in oil & gas and energy projects

Many governments and other organizations have started investing in new oil & gas infrastructure and major energy projects. The dam is one of the most advanced smart mega hydropower stations globally due to its usage of low-heat cement and built-in monitoring systems. The growing need for sustainable power generation and the reduction of the carbon footprint has led to an increased focus on developing wind farms, hydropower stations, and other renewable energy projects. The growing focus on energy mega-projects is expected to increase the demand for structural health monitoring systems.

Similarly, in the oil & gas industry, pipelines need to be monitored regularly to ensure structural safety and prevent metal loss due to corrosion, erosion, and cracks. The monitoring of pipelines is majorly restricted to flow measurement and visual inspection, which have very limited potential to detect leakages. Hence, pipeline failures are generally identified only when the output flow is affected or the surrounding environment is affected, leading to increased costs. Hence, several stakeholders involved in oil & gas projects are increasingly using structural health monitoring solutions to monitor pipelines effectively. Some of the major oil & gas projects in recent years include Alaska’s LNG Mega-Project and the Al Zour Refinery in Kuwait.  

Challenge: Processing and management of large volumes of data

Data processing and management is a major challenge in structural health monitoring. Sensors are strategically installed at various places on the structure to record data related to several critical parameters. Hence, any decision related to the maintenance of the structure is based on the data acquired by the sensor. Sensors, such as strain gauge sensors, accelerometer sensors, and displacement sensors, capture essential data related to the structure and transfer it to the base center for further analysis. These sensors generate large volumes of data daily, which is difficult to maintain and analyze. However, advanced computing solutions and technologies can be deployed for such large volume data management and processing. Various research institutes are working on different methods to overcome this challenge while maintaining data reliability. It is expected that this challenge could be overcome by adopting new approaches toward identifying and extracting useful information from a large database and using certain data analytics tools.

Structural Health Monitoring Market Ecosystem

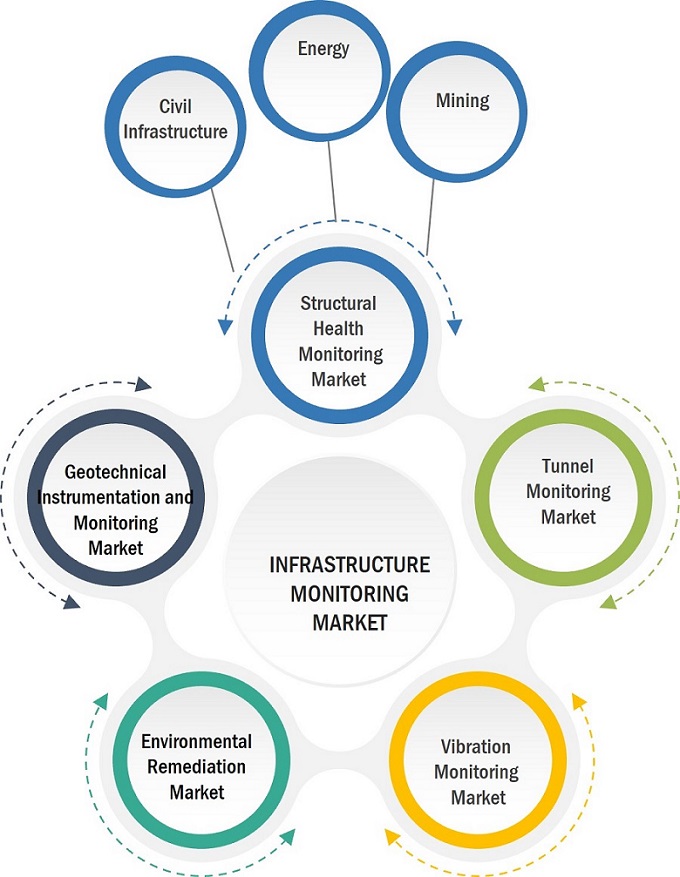
Prominent companies in this market include well-established, financially stable providers of structural health monitoring services. These companies have been operating in the market for several years and possess a diversified product and software & service portfolio, state-of-the-art technologies, and strong global sales and marketing networks. Prominent companies in this market include COWI A/S (Denmark), Campbell Scientific (US), Geokon (US), Nova Metrix LLC (US), SGS SA (Switzerland), Trimble Inc. (US), Structural Monitoring Systems PLC (Australia), Sixense (France), Digitexx Data Systems, Inc. (US), and Acellent Technologies, Inc. (US)
Structural Health Monitoring Market by Ecosystem

By offering, the software & services segment is expected to grow with the highest rate during the forecast period.

The increased complexity of data collected by modern structural health monitoring (SHM) systems necessitates specialized software for efficient data acquisition, management, visualization, analysis, and predictive maintenance. Also, organizations often lack in-house expertise in data analysis, structural engineering, and SHM principles, relying on specialized software and service providers. The evolving SHM technologies demand cutting-edge solutions that software and service providers can offer, staying ahead of developments. Moreover, seamless integration with existing systems, cost-effectiveness, vendor expertise, and ongoing support are crucial considerations. Additionally, the growing demand for cloud-based solutions, driven by remote access, centralized management, and scalability, presents opportunities for software and service providers to cater to evolving needs. The regulatory requirements mandating specific data collection and reporting practices further drive demand for compliant solutions offered by software and service providers.

By vertical, the energy sector for the structural health monitoring market is experiencing notable growth.

The structural health monitoring (SHM) market is poised for significant growth within the energy sector due to various compelling factors. Aging infrastructure, such as power plants, pipelines, wind turbines, and transmission lines nearing the end of their design life, underscores the importance of SHM in detecting issues early to prevent failures and ensure reliable energy production. Safety concerns drive the need for proactive identification and resolution of potential problems to mitigate risks of accidents and supply disruptions. Stricter regulatory scrutiny mandates safety inspections and maintenance practices, with SHM providing vital monitoring data for compliance. The integration of renewable energy sources necessitates ensuring the structural integrity of new infrastructure like wind turbine towers and solar arrays. Remote monitoring capabilities reduce operational costs by enabling continuous monitoring in remote locations. Predictive maintenance facilitated by SHM leads to cost savings through early issue identification and intervention. SHM data enhances asset management by optimizing maintenance schedules, extending asset lifespans, and informing investment decisions. Integration with digital twins offers a comprehensive view of asset health for improved planning and decision-making. Applications in the energy sector include monitoring wind turbine blades, pipelines for corrosion, power plant structures, transmission lines, and hydroelectric dams to ensure stability and prevent outages, highlighting the diverse benefits and applications of SHM in enhancing energy infrastructure performance and reliability.

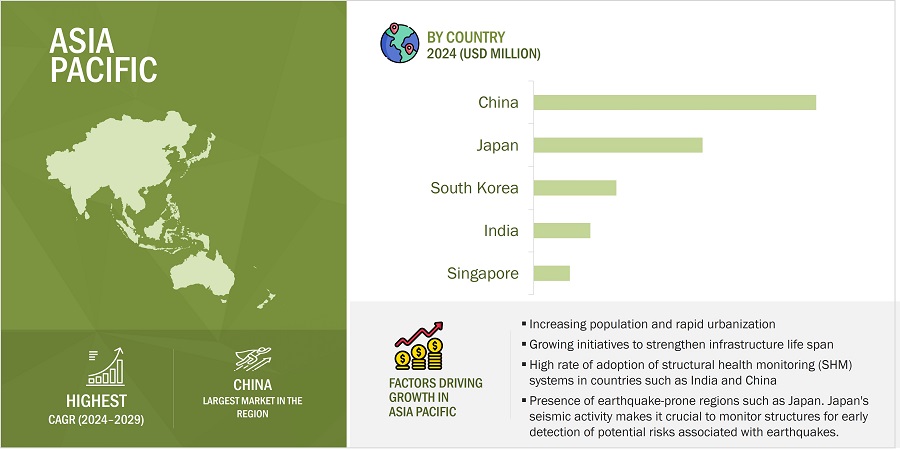
During the forecast period Asia Pacific is projected to record highest growth rate of the overall Structural health monitoring market.
Structural Health Monitoring Market by Region

Structural Health Monitoring Market by Region

To know about the assumptions considered for the study, download the pdf brochure

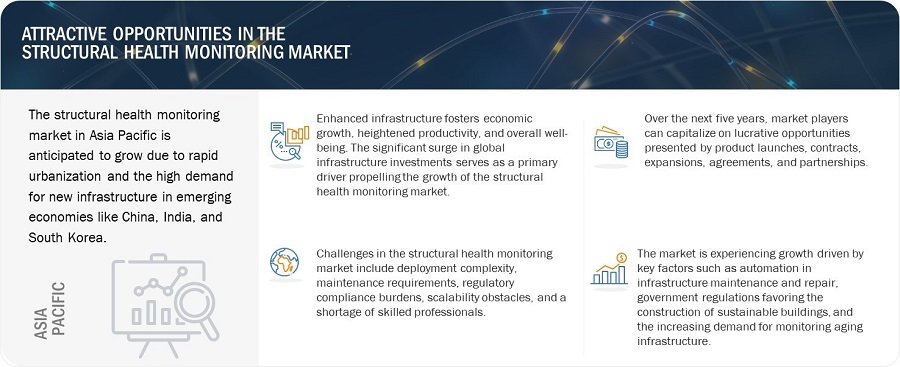
The Asia Pacific region is witnessing a rapid urbanization trend, driving a surge in construction activities for new buildings, bridges, and transportation networks. This growth spurt necessitates robust monitoring solutions to uphold the safety and durability of these structures. With aging infrastructure nearing the end of its design life, Structural Health Monitoring (SHM) offers a proactive approach to managing these assets by enabling early issue detection and averting costly repairs or catastrophic incidents. Increased government investments in infrastructure development further fuel the demand for SHM systems, ensuring their incorporation in both new and existing projects. The region's heightened focus on safety, sustainability, and public awareness underscores the pivotal role of SHM in accident prevention and structural integrity maintenance. Technological advancements have led to more efficient and cost-effective SHM solutions, making them more accessible across a broader spectrum of structures. The growing availability of skilled SHM professionals in the region enhances the effective implementation and maintenance of monitoring systems.

Key Market Players

COWI A/S (Denmark), Campbell Scientific (US), Geokon (US), Nova Metrix LLC (US), SGS SA (Switzerland), Trimble Inc. (US), Structural Monitoring Systems plc (Australia), Sixense (France), Digitexx Data Systems, Inc. (US), and Acellent Technologies, Inc. (US) are some of the key players in the structural health monitoring companies.

Get online access to the report on the World's First Market Intelligence Cloud

  • Easy to Download Historical Data & Forecast Numbers
  • Company Analysis Dashboard for high growth potential opportunities
  • Research Analyst Access for customization & queries
  • Competitor Analysis with Interactive dashboard
  • Latest News, Updates & Trend analysis
Request Sample

Scope of the Report

Report Metric

Details

Market Size Availability for Years

2020–2029

Base Year

2023

Forecast Period

2024–2029

Forecast Units

Value (USD)

Segments Covered

By offering, technology, vertical, implementation, application, and region

Geographies Covered

North America, Europe, Asia Pacific, and RoW

Companies Covered

COWI A/S (Denmark), Campbell Scientific (US), Geokon (US), Nova Metrix LLC (US), SGS SA (Switzerland), Trimble Inc. (US), Structural Monitoring Systems PLC (Australia), Sixense (France), Digitexx Data Systems, Inc. (US), and Acellent Technologies, Inc. (US) are some of the key players in the structural health monitoring market.

Structural Health Monitoring Market Highlights

This research report categorizes the structural health monitoring market based on offering, technology, vertical, implementation, application, and region.

Segment

Subsegment

By Offering

  • Introduction
  • Hardware
  • Software & Services

By Technology

  • Introduction
  • Wired
  • Wireless

By Vertical

  • Introduction
  • Civil Infrastructure
  • Aerospace & Defense
  • Energy
  • Mining
  • Others

By Implementation

  • Introduction
  • New Construction
  • Retrofitting

By Application

  • Introduction
  • Crack Detection
  • Damage Detection
  • Impact Monitoring
  • Corrosion Monitoring
  • Strain Monitoring
  • Hotspot Monitoring
  • State Sensing
  • Multi-modal Sensing
  • Pressure Monitoring
  • Leakage Detection
  • Deflection Monitoring
  • Hurricane & Earthquake Monitoring

By Region

  • North America
  • Europe
  • Asia Pacific
  • RoW

Recent Developments

  • In December 2023, Campbell Scientific has launched the Aspen 10 Internet of Things (IoT) Edge Device, a cutting-edge instrument that seamlessly connects Aspen 10-compatible sensors to CampbellCloud. This robust device is specifically engineered for outdoor installation, eliminating the necessity for an extra enclosure. It boasts an integrated solar panel and internal rechargeable battery, ensuring self-sustainability and reliable operation in outdoor environments.
  • In September 2023, Trimble and Kyivstar collaborated to establish a Continuously Operating Reference Station (CORS) network in Ukraine, offering GNSS correction services through Trimble's hardware and software technology.
  • In May 2023, COWI A/S completed the acquisition of Mannvit. With this acquisition COWI focus on expanding its business within key sectors like infrastructure, industry, environment, and renewable energy in Iceland. Mannvit is a global consulting company that focuses on engineering, renewable energy, scientific services, and project management.
  • In December 2022, The new Model 8940 Series GeoNet Dataloggers provide a valuable data collection solution for all GEOKON vibrating wire instruments and digital sensor strings, including MEMS IPI and VW sensors
  • In June 2023, Campbell Scientific and the Royal Netherlands Meteorological Institute (KNMI) have partnered to enhance the surface observation systems in the Netherlands. This collaboration focuses on modernizing the observation network through software tools and solutions, aiming to improve responses to weather impacts and climate changes. The project involves deploying new software developed in partnership with KNMI, introducing Edge devices, and implementing a new software platform to remotely manage the observation network.

Frequently Asked Questions(FAQs):

To speak to our analyst for a discussion on the above findings, click Speak to Analyst

TABLE OF CONTENTS
 
1 INTRODUCTION (Page No. - 35)
    1.1 STUDY OBJECTIVES 
    1.2 MARKET DEFINITION 
    1.3 STUDY SCOPE 
           1.3.1 MARKETS COVERED
                    FIGURE 1 STRUCTURAL HEALTH MONITORING MARKET SEGMENTATION
           1.3.2 REGIONAL SCOPE
           1.3.3 YEARS CONSIDERED
           1.3.4 INCLUSIONS AND EXCLUSIONS
    1.4 CURRENCY CONSIDERED 
    1.5 UNITS CONSIDERED 
    1.6 LIMITATIONS 
    1.7 STAKEHOLDERS 
    1.8 SUMMARY OF CHANGES 
    1.9 IMPACT OF RECESSION 
 
2 RESEARCH METHODOLOGY (Page No. - 41)
    2.1 RESEARCH DATA 
           FIGURE 2 STRUCTURAL HEALTH MONITORING MARKET: RESEARCH DESIGN
           2.1.1 SECONDARY DATA
                    2.1.1.1 List of key secondary sources
                    2.1.1.2 Key data from secondary sources
           2.1.2 PRIMARY DATA
                    2.1.2.1 List of primary interview participants
                    2.1.2.2 Key data from primary sources
                    2.1.2.3 Key industry insights
                    2.1.2.4 Breakdown of primaries
           2.1.3 SECONDARY AND PRIMARY RESEARCH
    2.2 MARKET SIZE ESTIMATION METHODOLOGY 
           2.2.1 BOTTOM-UP APPROACH
                    2.2.1.1 Approach to arrive at market size using bottom-up analysis (demand side)
                               FIGURE 3 STRUCTURAL HEALTH MONITORING MARKET: BOTTOM-UP APPROACH
                               FIGURE 4 STRUCTURAL HEALTH MONITORING MARKET SIZE ESTIMATION: DEMAND-SIDE ANALYSIS
           2.2.2 TOP-DOWN APPROACH
                    2.2.2.1 Approach to arrive at market size using top-down analysis (supply side)
                               FIGURE 5 STRUCTURAL HEALTH MONITORING MARKET: TOP-DOWN APPROACH
                               FIGURE 6 STRUCTURAL HEALTH MONITORING MARKET SIZE ESTIMATION: SUPPLY-SIDE ANALYSIS
    2.3 MARKET BREAKDOWN AND DATA TRIANGULATION 
           FIGURE 7 STRUCTURAL HEALTH MONITORING MARKET: DATA TRIANGULATION
    2.4 RESEARCH ASSUMPTIONS 
           TABLE 1 STRUCTURAL HEALTH MONITORING MARKET: RESEARCH ASSUMPTIONS
    2.5 RISK ASSESSMENT 
           TABLE 2 STRUCTURAL HEALTH MONITORING MARKET: RISK ASSESSMENT
    2.6 RECESSION IMPACT 
           TABLE 3 STRUCTURAL HEALTH MONITORING MARKET: RECESSION IMPACT
    2.7 RESEARCH LIMITATIONS 
           FIGURE 8 STRUCTURAL HEALTH MONITORING MARKET: RESEARCH LIMITATIONS
 
3 EXECUTIVE SUMMARY (Page No. - 53)
           FIGURE 9 STRUCTURAL HEALTH MONITORING MARKET SIZE, 2020–2029 (USD MILLION)
           FIGURE 10 HARDWARE OFFERINGS TO ACCOUNT FOR LARGER MARKET SHARE IN 2024
           FIGURE 11 WIRED TECHNOLOGY TO DOMINATE STRUCTURAL HEALTH MONITORING MARKET BETWEEN 2024 AND 2029
           FIGURE 12 CIVIL INFRASTRUCTURE VERTICAL TO HOLD LARGEST MARKET SHARE IN 2029
           FIGURE 13 ASIA PACIFIC TO EXHIBIT HIGHEST CAGR IN STRUCTURAL HEALTH MONITORING MARKET FROM 2024 TO 2029
 
4 PREMIUM INSIGHTS (Page No. - 57)
    4.1 ATTRACTIVE OPPORTUNITIES FOR PLAYERS IN STRUCTURAL HEALTH MONITORING MARKET 
           FIGURE 14 RISING NEED TO MONITOR AGING INFRASTRUCTURE TO PROVIDE LUCRATIVE OPPORTUNITIES FOR PLAYERS IN STRUCTURAL HEALTH MONITORING MARKET
    4.2 STRUCTURAL HEALTH MONITORING MARKET, BY OFFERING 
           FIGURE 15 HARDWARE TO ACCOUNT FOR LARGER SHARE OF STRUCTURAL HEALTH MONITORING MARKET, BY OFFERING, IN 2029
    4.3 STRUCTURAL HEALTH MONITORING MARKET, BY VERTICAL 
           FIGURE 16 CIVIL INFRASTRUCTURE TO DOMINATE MARKET FROM 2024 TO 2029
    4.4 STRUCTURAL HEALTH MONITORING MARKET, BY TECHNOLOGY 
           FIGURE 17 WIRED TECHNOLOGY TO ACCOUNT FOR LARGER MARKET SHARE THAN WIRELESS TECHNOLOGY IN 2029
    4.5 STRUCTURAL HEALTH MONITORING MARKET, BY REGION 
           FIGURE 18 NORTH AMERICA TO DOMINATE STRUCTURAL HEALTH MONITORING MARKET DURING FORECAST PERIOD
 
5 MARKET OVERVIEW (Page No. - 60)
    5.1 INTRODUCTION 
    5.2 MARKET DYNAMICS 
           FIGURE 19 STRUCTURAL HEALTH MONITORING MARKET: DRIVERS, RESTRAINTS, OPPORTUNITIES, AND CHALLENGES
           5.2.1 DRIVERS
                    5.2.1.1 Rising automation of structural repair and maintenance processes
                    5.2.1.2 Increasing number of structurally deficient bridges
                               FIGURE 20 NUMBER OF STRUCTURALLY DEFICIENT BRIDGES IN US, 2019–2023
                    5.2.1.3 Surging investment in infrastructure development projects
                    5.2.1.4 Increasing focus on developing advanced tools to ensure building safety
                    5.2.1.5 Growing concern about aging infrastructure
                    5.2.1.6 Rising adoption of micro-electromechanical systems and fiber optic sensors
                               FIGURE 21 IMPACT ANALYSIS: DRIVERS
           5.2.2 RESTRAINTS
                    5.2.2.1 High installation and monitoring costs
                    5.2.2.2 Inaccurate readings due to design & calibration errors
                               TABLE 4 DESIGN AND CALIBRATION ERRORS AND CORRECTIVE MEASURES
                    5.2.2.3 Insufficient infrastructure investments in developing countries
                               FIGURE 22 IMPACT ANALYSIS: RESTRAINTS
           5.2.3 OPPORTUNITIES
                    5.2.3.1 Introduction of AI-powered infrastructure asset management solutions
                    5.2.3.2 Population growth in emerging economies
                    5.2.3.3 Rapid advancement in sensor technologies
                    5.2.3.4 Increased funding for oil & gas projects
                               FIGURE 23 IMPACT ANALYSIS: OPPORTUNITIES
           5.2.4 CHALLENGES
                    5.2.4.1 Shortage of highly skilled operators
                    5.2.4.2 Harsh weather and adverse site conditions
                    5.2.4.3 Complex installation processes
                    5.2.4.4 Difficulties in managing large volumes of data
                               FIGURE 24 IMPACT ANALYSIS: CHALLENGES
    5.3 TRENDS/DISRUPTIONS IMPACTING CUSTOMERS’ BUSINESSES 
           FIGURE 25 STRUCTURAL HEALTH MONITORING MARKET: TRENDS/DISRUPTIONS IMPACTING CUSTOMERS’ BUSINESSES
    5.4 PRICING ANALYSIS 
           5.4.1 AVERAGE SELLING PRICE OF STRUCTURAL HEALTH MONITORING SENSORS OFFERED BY KEY PLAYERS, BY TYPE
                    FIGURE 26 AVERAGE SELLING PRICE OF STRUCTURAL HEALTH MONITORING SENSORS OFFERED BY KEY PLAYERS, BY TYPE (USD)
                    TABLE 5 AVERAGE SELLING PRICE OF STRUCTURAL HEALTH MONITORING SENSORS OFFERED BY KEY PLAYERS, BY TYPE (USD)
           5.4.2 AVERAGE SELLING PRICE OF STRUCTURAL HEALTH MONITORING HARDWARE PRODUCTS, BY REGION
                    FIGURE 27 AVERAGE SELLING PRICE OF STRUCTURAL HEALTH MONITORING HARDWARE PRODUCTS, BY REGION (USD)
    5.5 SUPPLY CHAIN ANALYSIS 
           FIGURE 28 STRUCTURAL HEALTH MONITORING MARKET: SUPPLY CHAIN ANALYSIS
    5.6 ECOSYSTEM ANALYSIS 
           TABLE 6 ROLE OF COMPANIES IN STRUCTURAL HEALTH MONITORING ECOSYSTEM
    5.7 INVESTMENT AND FUNDING SCENARIO 
           FIGURE 29 STRUCTURAL HEALTH MONITORING MARKET: INVESTMENT AND FUNDING SCENARIO
    5.8 TECHNOLOGY ANALYSIS 
           5.8.1 KEY TECHNOLOGY
                    5.8.1.1 Data acquisition systems (DAS)
           5.8.2 COMPLEMENTARY TECHNOLOGIES
                    5.8.2.1 Non-destructive testing (NDT)
                    5.8.2.2 Building information modeling (BIM)
           5.8.3 ADJACENT TECHNOLOGIES
                    5.8.3.1 Digital twins
                    5.8.3.2 Robotics and drones
    5.9 PATENT ANALYSIS 
           FIGURE 30 STRUCTURAL HEALTH MONITORING MARKET: PATENTS APPLIED AND GRANTED, 2014–2023
           FIGURE 31 STRUCTURAL HEALTH MONITORING MARKET: ANALYSIS OF PATENTS GRANTED IN US AND EUROPE
           TABLE 7 STRUCTURAL HEALTH MONITORING MARKET: LIST OF PATENTS, 2020–2023
    5.10 TRADE ANALYSIS 
           5.10.1 IMPORT SCENARIO
                    FIGURE 32 IMPORT DATA FOR HS CODE 9015-COMPLIANT MEASURING AND SURVEYING INSTRUMENTS, 2018–2022
           5.10.2 EXPORT SCENARIO
                    FIGURE 33 EXPORT DATA FOR HS CODE 9015-COMPLIANT MEASURING AND SURVEYING INSTRUMENTS, 2018–2022
    5.11 KEY CONFERENCES AND EVENTS, 2024–2025 
           TABLE 8 STRUCTURAL HEALTH MONITORING MARKET: LIST OF KEY CONFERENCES AND EVENTS, 2024–2025
    5.12 CASE STUDY ANALYSIS 
           5.12.1 KSEB PLANS TO INSTALL SAFETY AND RISK MANAGEMENT SOLUTIONS TO AVOID DAM FAILURE
           5.12.2 ENCARDIO RITE OBTAINS CONTRACT TO PROVIDE ROCK MONITORING SOLUTIONS FOR IDENTIFYING FAULT ZONES
           5.12.3 GEOCOMP PROVIDES MONITORING SERVICES TO EVALUATE IMPACT OF BRIDGE CONSTRUCTION ON ADJACENT STRUCTURES
    5.13 TARIFF AND REGULATORY LANDSCAPE 
           5.13.1 TARIFF ANALYSIS
                    TABLE 9 MFN TARIFF FOR HS CODE 9015-COMPLIANT PRODUCTS EXPORTED BY US, 2023
           5.13.2 REGULATORY BODIES, GOVERNMENT AGENCIES, AND OTHER ORGANIZATIONS
                    TABLE 10 NORTH AMERICA: LIST OF REGULATORY BODIES, GOVERNMENT AGENCIES, AND OTHER ORGANIZATIONS
                    TABLE 11 EUROPE: LIST OF REGULATORY BODIES, GOVERNMENT AGENCIES, AND OTHER ORGANIZATIONS
                    TABLE 12 ASIA PACIFIC: LIST OF REGULATORY BODIES, GOVERNMENT AGENCIES, AND OTHER ORGANIZATIONS
                    TABLE 13 ROW: LIST OF REGULATORY BODIES, GOVERNMENT AGENCIES, AND OTHER ORGANIZATIONS
    5.14 PORTER’S FIVE FORCES ANALYSIS 
           FIGURE 34 STRUCTURAL HEALTH MONITORING MARKET: PORTER’S FIVE FORCES ANALYSIS
           FIGURE 35 STRUCTURAL HEALTH MONITORING MARKET: PORTER’S FIVE FORCES IMPACT ANALYSIS
           TABLE 14 STRUCTURAL HEALTH MONITORING MARKET: PORTER’S FIVE FORCES ANALYSIS, 2023
           5.14.1 THREAT OF NEW ENTRANTS
           5.14.2 THREAT OF SUBSTITUTES
           5.14.3 BARGAINING POWER OF SUPPLIERS
           5.14.4 BARGAINING POWER OF BUYERS
           5.14.5 INTENSITY OF COMPETITIVE RIVALRY
    5.15 KEY STAKEHOLDERS AND BUYING CRITERIA 
           5.15.1 KEY STAKEHOLDERS IN BUYING PROCESS
                    FIGURE 36 INFLUENCE OF STAKEHOLDERS ON BUYING PROCESS FOR TOP THREE VERTICALS
                    TABLE 15 INFLUENCE OF STAKEHOLDERS ON BUYING PROCESS FOR TOP THREE VERTICALS (%)
           5.15.2 BUYING CRITERIA
                    FIGURE 37 KEY BUYING CRITERIA FOR TOP THREE VERTICALS
                    TABLE 16 KEY BUYING CRITERIA FOR TOP THREE VERTICALS
 
6 IMPLEMENTATION METHODS FOR STRUCTURAL HEALTH MONITORING SYSTEMS (Page No. - 92)
    6.1 INTRODUCTION 
           FIGURE 38 IMPLEMENTATION METHODS OF STRUCTURAL HEALTH MONITORING SYSTEMS
    6.2 NEW CONSTRUCTION 
    6.3 RETROFITTING 
 
7 APPLICATIONS OF STRUCTURAL HEALTH MONITORING SYSTEMS (Page No. - 95)
    7.1 INTRODUCTION 
           FIGURE 39 APPLICATIONS OF STRUCTURAL HEALTH MONITORING SYSTEMS
           TABLE 17 APPLICATIONS, MONITORING PURPOSE, AND INSTRUMENTS USED IN STRUCTURAL HEALTH MONITORING
    7.2 CRACK DETECTION 
    7.3 DAMAGE DETECTION 
    7.4 IMPACT MONITORING 
    7.5 CORROSION MONITORING 
    7.6 STRAIN MONITORING 
    7.7 HOTSPOT MONITORING 
    7.8 STATE SENSING 
    7.9 MULTI-MODAL SENSING 
    7.1 PRESSURE MONITORING 
    7.11 LEAKAGE DETECTION 
    7.12 DEFLECTION MONITORING 
    7.13 HURRICANE & EARTHQUAKE MONITORING 
 
8 STRUCTURAL HEALTH MONITORING MARKET, BY OFFERING (Page No. - 101)
    8.1 INTRODUCTION 
           FIGURE 40 STRUCTURAL HEALTH MONITORING MARKET, BY OFFERING
           TABLE 18 STRUCTURAL HEALTH MONITORING MARKET, BY OFFERING, 2020–2023 (USD MILLION)
           TABLE 19 STRUCTURAL HEALTH MONITORING MARKET, BY OFFERING, 2024–2029 (USD MILLION)
           FIGURE 41 HARDWARE SEGMENT TO ACCOUNT FOR LARGER MARKET SHARE IN 2029
    8.2 HARDWARE 
           TABLE 20 HARDWARE: STRUCTURAL HEALTH MONITORING MARKET, BY REGION, 2020–2023 (USD MILLION)
           TABLE 21 HARDWARE: STRUCTURAL HEALTH MONITORING MARKET, BY REGION, 2024–2029 (USD MILLION)
           TABLE 22 HARDWARE: STRUCTURAL HEALTH MONITORING MARKET, BY TYPE, 2020–2023 (USD MILLION)
           TABLE 23 HARDWARE: STRUCTURAL HEALTH MONITORING MARKET, BY TYPE, 2024–2029 (USD MILLION)
           FIGURE 42 SENSORS TO DOMINATE MARKET FOR HARDWARE DURING FORECAST PERIOD
           8.2.1 SENSORS
                    TABLE 24 HARDWARE: STRUCTURAL HEALTH MONITORING MARKET FOR SENSORS, BY REGION, 2020–2023 (USD MILLION)
                    TABLE 25 HARDWARE: STRUCTURAL HEALTH MONITORING MARKET FOR SENSORS, BY REGION, 2024–2029 (USD MILLION)
                    TABLE 26 HARDWARE: STRUCTURAL HEALTH MONITORING MARKET FOR SENSORS, BY SENSOR TYPE, 2020–2023 (USD MILLION)
                    TABLE 27 HARDWARE: STRUCTURAL HEALTH MONITORING MARKET FOR SENSORS, BY SENSOR TYPE, 2024–2029 (USD MILLION)
                    TABLE 28 HARDWARE: STRUCTURAL HEALTH MONITORING MARKET FOR SENSORS, BY SENSOR TYPE, 2020–2023 (THOUSAND UNITS)
                    TABLE 29 HARDWARE: STRUCTURAL HEALTH MONITORING MARKET FOR SENSORS, BY SENSOR TYPE, 2024–2029 (THOUSAND UNITS)
                    8.2.1.1 Accelerometers
                               8.2.1.1.1 Need to measure gravity or dynamic loads and vibrations due to forces to fuel segmental growth
                    8.2.1.2 Displacement sensors
                               8.2.1.2.1 Adoption of linear variable differential transformers to monitor crack displacement to augment segmental growth
                    8.2.1.3 Tilt meters & inclinometers
                               8.2.1.3.1 Application of tilt meters & inclinometers in parallel displacement measurement to foster segmental growth
                    8.2.1.4 Strain gauges
                               8.2.1.4.1 Use of strain gauges to detect variations in strain distribution across structures to contribute to segmental growth
                    8.2.1.5 Corrosion sensors
                               8.2.1.5.1 Implementation of corrosion sensors for predictive maintenance analysis to facilitate segmental growth
                    8.2.1.6 Temperature sensors
                               8.2.1.6.1 Need to reduce cracking and spalling of structures due to sudden temperature changes to expedite segmental growth
                    8.2.1.7 Other sensor types
           8.2.2 DATA ACQUISITION SYSTEMS
                    8.2.2.1 Adoption of data acquisition systems for real-time, remote monitoring of structures to accelerate market growth
                               TABLE 30 DATA ACQUISITION SYSTEMS: STRUCTURAL HEALTH MONITORING MARKET, BY REGION, 2020–2023 (USD MILLION)
                               TABLE 31 DATA ACQUISITION SYSTEMS: STRUCTURAL HEALTH MONITORING MARKET, BY REGION, 2024–2029 (USD MILLION)
           8.2.3 OTHER HARDWARE TYPES
                    TABLE 32 OTHER HARDWARE TYPES: STRUCTURAL HEALTH MONITORING MARKET, BY REGION, 2020–2023 (USD MILLION)
                    TABLE 33 OTHER HARDWARE TYPES: STRUCTURAL HEALTH MONITORING MARKET, BY REGION, 2024–2029 (USD MILLION)
    8.3 SOFTWARE & SERVICES 
           8.3.1 REQUIREMENT FOR SOFTWARE AND SERVICES FOR EARLY STRUCTURAL DAMAGE DETECTION TO FOSTER SEGMENTAL GROWTH
           8.3.2 PRE-INSTALLATION SERVICES
           8.3.3 POST-INSTALLATION SERVICES
                    TABLE 34 SOFTWARE & SERVICES: STRUCTURAL HEALTH MONITORING MARKET, BY REGION, 2020–2023 (USD MILLION)
                    TABLE 35 SOFTWARE & SERVICES: STRUCTURAL HEALTH MONITORING MARKET, BY REGION, 2024–2029 (USD MILLION)
 
9 STRUCTURAL HEALTH MONITORING MARKET, BY TECHNOLOGY (Page No. - 115)
    9.1 INTRODUCTION 
           FIGURE 43 STRUCTURAL HEALTH MONITORING MARKET, BY TECHNOLOGY
           TABLE 36 STRUCTURAL HEALTH MONITORING MARKET, BY TECHNOLOGY, 2020–2023 (USD MILLION)
           TABLE 37 STRUCTURAL HEALTH MONITORING MARKET, BY TECHNOLOGY, 2024–2029 (USD MILLION)
           FIGURE 44 WIRED TECHNOLOGY TO HOLD LARGER SHARE OF STRUCTURAL HEALTH MONITORING MARKET IN 2029
    9.2 WIRED 
           9.2.1 LOW RISK OF DATA LOSS TO BOOST ADOPTION OF WIRED STRUCTURAL HEALTH MONITORING SYSTEMS
                    TABLE 38 WIRED: STRUCTURAL HEALTH MONITORING MARKET, BY REGION, 2020–2023 (USD MILLION)
                    TABLE 39 WIRED: STRUCTURAL HEALTH MONITORING MARKET, BY REGION, 2024–2029 (USD MILLION)
    9.3 WIRELESS 
           9.3.1 HIGH EFFICIENCY AND LOW MAINTENANCE COSTS TO FUEL DEMAND FOR WIRELESS STRUCTURAL HEALTH MANAGEMENT SYSTEMS
                    TABLE 40 WIRELESS: STRUCTURAL HEALTH MONITORING MARKET, BY REGION, 2020–2023 (USD MILLION)
                    TABLE 41 WIRELESS: STRUCTURAL HEALTH MONITORING MARKET, BY REGION, 2024–2029 (USD MILLION)
 
10 STRUCTURAL HEALTH MONITORING MARKET, BY VERTICAL (Page No. - 121)
     10.1 INTRODUCTION 
             FIGURE 45 STRUCTURAL HEALTH MONITORING MARKET, BY VERTICAL
             FIGURE 46 CIVIL INFRASTRUCTURE VERTICAL TO ACCOUNT FOR LARGEST MARKET SHARE IN 2029
             TABLE 42 STRUCTURAL HEALTH MONITORING MARKET, BY VERTICAL, 2020–2023 (USD MILLION)
             TABLE 43 STRUCTURAL HEALTH MONITORING MARKET, BY VERTICAL, 2024–2029 (USD MILLION)
     10.2 CIVIL INFRASTRUCTURE 
             10.2.1 REQUIREMENT FOR REGULAR MONITORING OF CIVIL INFRASTRUCTURE TO CURB REPLACEMENT COSTS TO FUEL SEGMENTAL GROWTH
             10.2.2 BRIDGES
             10.2.3 TUNNELS
             10.2.4 DAMS
             10.2.5 BUILDINGS & STADIUMS
                        TABLE 44 MAJOR CIVIL INFRASTRUCTURE PROJECTS
                        FIGURE 47 CIVIL INFRASTRUCTURE TO RECORD HIGHEST CAGR IN STRUCTURAL HEALTH MONITORING MARKET IN ASIA PACIFIC DURING FORECAST PERIOD
                        TABLE 45 CIVIL INFRASTRUCTURE: STRUCTURAL HEALTH MONITORING MARKET, BY REGION, 2020–2023 (USD MILLION)
                        TABLE 46 CIVIL INFRASTRUCTURE: STRUCTURAL HEALTH MONITORING MARKET, BY REGION, 2024–2029 (USD MILLION)
     10.3 AEROSPACE & DEFENSE 
             10.3.1 NEED TO MINIMIZE RISK OF AIRCRAFT STRUCTURAL FAILURES TO ACCELERATE SEGMENTAL GROWTH
                        TABLE 47 MAJOR AEROSPACE & DEFENSE PROJECTS
                        FIGURE 48 AEROSPACE & DEFENSE VERTICAL TO ACCOUNT FOR LARGEST SHARE OF NORTH AMERICAN MARKET IN 2029
                        TABLE 48 AEROSPACE & DEFENSE: STRUCTURAL HEALTH MONITORING MARKET, BY REGION, 2020–2023 (USD MILLION)
                        TABLE 49 AEROSPACE & DEFENSE: STRUCTURAL HEALTH MONITORING MARKET, BY REGION, 2024–2029 (USD MILLION)
     10.4 ENERGY 
             10.4.1 DEVELOPMENT OF WIND AND NUCLEAR ENERGY PROJECTS TO BOOST SEGMENTAL GROWTH
                        TABLE 50 MAJOR ENERGY PROJECTS
                        FIGURE 49 ENERGY VERTICAL TO EXHIBIT HIGHEST CAGR IN STRUCTURAL HEALTH MONITORING MARKET IN ASIA PACIFIC DURING FORECAST PERIOD
                        TABLE 51 ENERGY: STRUCTURAL HEALTH MONITORING MARKET, BY REGION, 2020–2023 (USD MILLION)
                        TABLE 52 ENERGY: STRUCTURAL HEALTH MONITORING MARKET, BY REGION, 2024–2029 (USD MILLION)
     10.5 MINING 
             10.5.1 USE OF HEAVY ROTATING MACHINES IN MINING OPERATIONS TO FACILITATE SEGMENTAL GROWTH
                        TABLE 53 MAJOR MINING PROJECTS
                        FIGURE 50 MINING VERTICAL TO HOLD LARGEST SHARE OF STRUCTURAL HEALTH MONITORING MARKET IN EUROPE IN 2029
                        TABLE 54 MINING: STRUCTURAL HEALTH MONITORING MARKET, BY REGION, 2020–2023 (USD MILLION)
                        TABLE 55 MINING: STRUCTURAL HEALTH MONITORING MARKET, BY REGION, 2024–2029 (USD MILLION)
     10.6 OTHER VERTICALS 
             TABLE 56 MAJOR INDUSTRIAL MACHINERY, MARINE, AND AUTOMOTIVE & TRANSPORTATION PROJECTS
             FIGURE 51 OTHER VERTICALS TO DOMINATE MARKET IN NORTH AMERICA BETWEEN 2024 AND 2029
             TABLE 57 OTHER VERTICALS: STRUCTURAL HEALTH MONITORING MARKET, BY REGION, 2020–2023 (USD MILLION)
             TABLE 58 OTHER VERTICALS: STRUCTURAL HEALTH MONITORING MARKET, BY REGION, 2024–2029 (USD MILLION)
 
11 STRUCTURAL HEALTH MONITORING MARKET, BY REGION (Page No. - 136)
     11.1 INTRODUCTION 
             FIGURE 52 STRUCTURAL HEALTH MONITORING MARKET, BY REGION
             FIGURE 53 INDIA TO EXHIBIT HIGHEST CAGR IN GLOBAL STRUCTURAL HEALTH MONITORING MARKET DURING FORECAST PERIOD
             FIGURE 54 NORTH AMERICA TO DOMINATE STRUCTURAL HEALTH MONITORING MARKET FROM 2024 TO 2029
             TABLE 59 STRUCTURAL HEALTH MONITORING MARKET, BY REGION, 2020–2023 (USD MILLION)
             TABLE 60 STRUCTURAL HEALTH MONITORING MARKET, BY REGION, 2024–2029 (USD MILLION)
     11.2 NORTH AMERICA 
             11.2.1 RECESSION IMPACT ON STRUCTURAL HEALTH MONITORING MARKET IN NORTH AMERICA
                        FIGURE 55 NORTH AMERICA: RECESSION IMPACT ANALYSIS
                        FIGURE 56 NORTH AMERICA: STRUCTURAL HEALTH MONITORING MARKET SNAPSHOT
                        TABLE 61 NORTH AMERICA: STRUCTURAL HEALTH MONITORING MARKET, BY COUNTRY, 2020–2023 (USD MILLION)
                        TABLE 62 NORTH AMERICA: STRUCTURAL HEALTH MONITORING MARKET, BY COUNTRY, 2024–2029 (USD MILLION)
                        TABLE 63 NORTH AMERICA: STRUCTURAL HEALTH MONITORING MARKET, BY VERTICAL, 2020–2023 (USD MILLION)
                        TABLE 64 NORTH AMERICA: STRUCTURAL HEALTH MONITORING MARKET, BY VERTICAL, 2024–2029 (USD MILLION)
                        TABLE 65 NORTH AMERICA: STRUCTURAL HEALTH MONITORING MARKET, BY TECHNOLOGY, 2020–2023 (USD MILLION)
                        TABLE 66 NORTH AMERICA: STRUCTURAL HEALTH MONITORING MARKET, BY TECHNOLOGY, 2024–2029 (USD MILLION)
                        TABLE 67 NORTH AMERICA: STRUCTURAL HEALTH MONITORING MARKET, BY OFFERING, 2020–2023 (USD MILLION)
                        TABLE 68 NORTH AMERICA: STRUCTURAL HEALTH MONITORING MARKET, BY OFFERING, 2024–2029 (USD MILLION)
                        TABLE 69 NORTH AMERICA: STRUCTURAL HEALTH MONITORING MARKET FOR HARDWARE, BY TYPE, 2020–2023 (USD MILLION)
                        TABLE 70 NORTH AMERICA: STRUCTURAL HEALTH MONITORING MARKET FOR HARDWARE, BY TYPE, 2024–2029 (USD MILLION)
             11.2.2 US
                        11.2.2.1 Rising infrastructure and economic developments to drive market
                                     TABLE 71 US: STRUCTURAL HEALTH MONITORING MARKET, BY TECHNOLOGY, 2020–2023 (USD MILLION)
                                     TABLE 72 US: STRUCTURAL HEALTH MONITORING MARKET, BY TECHNOLOGY, 2024–2029 (USD MILLION)
             11.2.3 CANADA
                        11.2.3.1 Increasing investments in highway construction to contribute to market growth
                                     TABLE 73 CANADA: STRUCTURAL HEALTH MONITORING MARKET, BY TECHNOLOGY, 2020–2023 (USD MILLION)
                                     TABLE 74 CANADA: STRUCTURAL HEALTH MONITORING MARKET, BY TECHNOLOGY, 2024–2029 (USD MILLION)
             11.2.4 MEXICO
                        11.2.4.1 Growing emphasis on new infrastructure development to foster market growth
                                     TABLE 75 MEXICO: STRUCTURAL HEALTH MONITORING MARKET, BY TECHNOLOGY, 2020–2023 (USD MILLION)
                                     TABLE 76 MEXICO: STRUCTURAL HEALTH MONITORING MARKET, BY TECHNOLOGY, 2024–2029 (USD MILLION)
     11.3 EUROPE 
             11.3.1 RECESSION IMPACT ON STRUCTURAL HEALTH MONITORING MARKET IN EUROPE
                        FIGURE 57 EUROPE: RECESSION IMPACT ANALYSIS
                        FIGURE 58 EUROPE: STRUCTURAL HEALTH MONITORING MARKET SNAPSHOT
                        TABLE 77 EUROPE: STRUCTURAL HEALTH MONITORING MARKET, BY COUNTRY, 2020–2023 (USD MILLION)
                        TABLE 78 EUROPE: STRUCTURAL HEALTH MONITORING MARKET, BY COUNTRY, 2024–2029 (USD MILLION)
                        TABLE 79 EUROPE: STRUCTURAL HEALTH MONITORING MARKET, BY VERTICAL, 2020–2023 (USD MILLION)
                        TABLE 80 EUROPE: STRUCTURAL HEALTH MONITORING MARKET, BY VERTICAL, 2024–2029 (USD MILLION)
                        TABLE 81 EUROPE: STRUCTURAL HEALTH MONITORING MARKET, BY TECHNOLOGY, 2020–2023 (USD MILLION)
                        TABLE 82 EUROPE: STRUCTURAL HEALTH MONITORING MARKET, BY TECHNOLOGY, 2024–2029 (USD MILLION)
                        TABLE 83 EUROPE: STRUCTURAL HEALTH MONITORING MARKET, BY OFFERING, 2020–2023 (USD MILLION)
                        TABLE 84 EUROPE: STRUCTURAL HEALTH MONITORING MARKET, BY OFFERING, 2024–2029 (USD MILLION)
                        TABLE 85 EUROPE: STRUCTURAL HEALTH MONITORING MARKET FOR HARDWARE, BY TYPE, 2020–2023 (USD MILLION)
                        TABLE 86 EUROPE: STRUCTURAL HEALTH MONITORING MARKET FOR HARDWARE, BY TYPE, 2024–2029 (USD MILLION)
             11.3.2 UK
                        11.3.2.1 Surging adoption of advanced monitoring systems to detect structural failures at early stage to augment market growth
                                     TABLE 87 UK: STRUCTURAL HEALTH MONITORING MARKET, BY TECHNOLOGY, 2020–2023 (USD MILLION)
                                     TABLE 88 UK: STRUCTURAL HEALTH MONITORING MARKET, BY TECHNOLOGY, 2024–2029 (USD MILLION)
             11.3.3 GERMANY
                        11.3.3.1 Growing population and new construction projects to facilitate market growth
                                     TABLE 89 GERMANY: STRUCTURAL HEALTH MONITORING MARKET, BY TECHNOLOGY, 2020–2023 (USD MILLION)
                                     TABLE 90 GERMANY: STRUCTURAL HEALTH MONITORING MARKET, BY TECHNOLOGY, 2024–2029 (USD MILLION)
             11.3.4 FRANCE
                        11.3.4.1 Rising investments in transport and industrial sectors to fuel market growth
                                     TABLE 91 FRANCE: STRUCTURAL HEALTH MONITORING MARKET, BY TECHNOLOGY, 2020–2023 (USD MILLION)
                                     TABLE 92 FRANCE: STRUCTURAL HEALTH MONITORING MARKET, BY TECHNOLOGY, 2024–2029 (USD MILLION)
             11.3.5 ITALY
                        11.3.5.1 Increasing number of large construction projects to propel market
                                     TABLE 93 ITALY: STRUCTURAL HEALTH MONITORING MARKET, BY TECHNOLOGY, 2020–2023 (USD MILLION)
                                     TABLE 94 ITALY: STRUCTURAL HEALTH MONITORING MARKET, BY TECHNOLOGY, 2024–2029 (USD MILLION)
             11.3.6 NETHERLANDS
                        11.3.6.1 Growing concern about aging infrastructure to boost demand
                                     TABLE 95 NETHERLANDS: STRUCTURAL HEALTH MONITORING MARKET, BY TECHNOLOGY, 2020–2023 (USD MILLION)
                                     TABLE 96 NETHERLANDS: STRUCTURAL HEALTH MONITORING MARKET, BY TECHNOLOGY, 2024–2029 (USD MILLION)
             11.3.7 REST OF EUROPE
                        TABLE 97 REST OF EUROPE: STRUCTURAL HEALTH MONITORING MARKET, BY TECHNOLOGY, 2020–2023 (USD MILLION)
                        TABLE 98 REST OF EUROPE: STRUCTURAL HEALTH MONITORING MARKET, BY TECHNOLOGY, 2024–2029 (USD MILLION)
     11.4 ASIA PACIFIC 
             11.4.1 RECESSION IMPACT ON STRUCTURAL HEALTH MONITORING MARKET IN ASIA PACIFIC
                        FIGURE 59 ASIA PACIFIC: RECESSION IMPACT ANALYSIS
                        FIGURE 60 ASIA PACIFIC: STRUCTURAL HEALTH MONITORING MARKET SNAPSHOT
                        TABLE 99 ASIA PACIFIC: STRUCTURAL HEALTH MONITORING MARKET, BY COUNTRY, 2020–2023 (USD MILLION)
                        TABLE 100 ASIA PACIFIC: STRUCTURAL HEALTH MONITORING MARKET, BY COUNTRY, 2024–2029 (USD MILLION)
                        TABLE 101 ASIA PACIFIC: STRUCTURAL HEALTH MONITORING MARKET, BY VERTICAL, 2020–2023 (USD MILLION)
                        TABLE 102 ASIA PACIFIC: STRUCTURAL HEALTH MONITORING MARKET, BY VERTICAL, 2024–2029 (USD MILLION)
                        TABLE 103 ASIA PACIFIC: STRUCTURAL HEALTH MONITORING MARKET, BY TECHNOLOGY, 2020–2023 (USD MILLION)
                        TABLE 104 ASIA PACIFIC: STRUCTURAL HEALTH MONITORING MARKET, BY TECHNOLOGY, 2024–2029 (USD MILLION)
                        TABLE 105 ASIA PACIFIC: STRUCTURAL HEALTH MONITORING MARKET, BY OFFERING, 2020–2023 (USD MILLION)
                        TABLE 106 ASIA PACIFIC: STRUCTURAL HEALTH MONITORING MARKET, BY OFFERING, 2024–2029 (USD MILLION)
                        TABLE 107 ASIA PACIFIC: STRUCTURAL HEALTH MONITORING MARKET FOR HARDWARE, BY TYPE, 2020–2023 (USD MILLION)
                        TABLE 108 ASIA PACIFIC: STRUCTURAL HEALTH MONITORING MARKET FOR HARDWARE, BY TYPE, 2024–2029 (USD MILLION)
             11.4.2 CHINA
                        11.4.2.1 Enforcement of strict regulations to ensure structural safety to drive market
                                     TABLE 109 CHINA: STRUCTURAL HEALTH MONITORING MARKET, BY TECHNOLOGY, 2020–2023 (USD MILLION)
                                     TABLE 110 CHINA: STRUCTURAL HEALTH MONITORING MARKET, BY TECHNOLOGY, 2024–2029 (USD MILLION)
             11.4.3 JAPAN
                        11.4.3.1 High investments in large-scale infrastructure projects to expedite market growth
                                     TABLE 111 JAPAN: STRUCTURAL HEALTH MONITORING MARKET, BY TECHNOLOGY, 2020–2023 (USD MILLION)
                                     TABLE 112 JAPAN: STRUCTURAL HEALTH MONITORING MARKET, BY TECHNOLOGY, 2024–2029 (USD MILLION)
             11.4.4 SOUTH KOREA
                        11.4.4.1 Increased skyscraper construction to contribute to market growth
                                     TABLE 113 SOUTH KOREA: STRUCTURAL HEALTH MONITORING MARKET, BY TECHNOLOGY, 2020–2023 (USD MILLION)
                                     TABLE 114 SOUTH KOREA: STRUCTURAL HEALTH MONITORING MARKET, BY TECHNOLOGY, 2024–2029 (USD MILLION)
             11.4.5 INDIA
                        11.4.5.1 Government-led infrastructure investments to accelerate market growth
                                     TABLE 115 INDIA: STRUCTURAL HEALTH MONITORING MARKET, BY TECHNOLOGY, 2020–2023 (USD MILLION)
                                     TABLE 116 INDIA: STRUCTURAL HEALTH MONITORING MARKET, BY TECHNOLOGY, 2024–2029 (USD MILLION)
             11.4.6 SINGAPORE
                        11.4.6.1 Construction of new subway lines to expedite market growth
                                     TABLE 117 SINGAPORE: STRUCTURAL HEALTH MONITORING MARKET, BY TECHNOLOGY, 2020–2023 (USD MILLION)
                                     TABLE 118 SINGAPORE: STRUCTURAL HEALTH MONITORING MARKET, BY TECHNOLOGY, 2024–2029 (USD MILLION)
             11.4.7 REST OF ASIA PACIFIC
                        TABLE 119 REST OF ASIA PACIFIC: STRUCTURAL HEALTH MONITORING MARKET, BY TECHNOLOGY, 2020–2023 (USD MILLION)
                        TABLE 120 REST OF ASIA PACIFIC: STRUCTURAL HEALTH MONITORING MARKET, BY TECHNOLOGY, 2024–2029 (USD MILLION)
     11.5 ROW 
             11.5.1 RECESSION IMPACT ON STRUCTURAL HEALTH MONITORING MARKET IN ROW
                        FIGURE 61 ROW: RECESSION IMPACT ANALYSIS
                        FIGURE 62 ROW: STRUCTURAL HEALTH MONITORING MARKET SNAPSHOT
                        TABLE 121 ROW: STRUCTURAL HEALTH MONITORING MARKET, BY REGION, 2020–2023 (USD MILLION)
                        TABLE 122 ROW: STRUCTURAL HEALTH MONITORING MARKET, BY REGION, 2024–2029 (USD MILLION)
                        TABLE 123 ROW: STRUCTURAL HEALTH MONITORING MARKET, BY VERTICAL, 2020–2023 (USD MILLION)
                        TABLE 124 ROW: STRUCTURAL HEALTH MONITORING MARKET, BY VERTICAL, 2024–2029 (USD MILLION)
                        TABLE 125 ROW: STRUCTURAL HEALTH MONITORING MARKET, BY TECHNOLOGY, 2020–2023 (USD MILLION)
                        TABLE 126 ROW: STRUCTURAL HEALTH MONITORING MARKET, BY TECHNOLOGY, 2024–2029 (USD MILLION)
                        TABLE 127 ROW: STRUCTURAL HEALTH MONITORING MARKET, BY OFFERING, 2020–2023 (USD MILLION)
                        TABLE 128 ROW: STRUCTURAL HEALTH MONITORING MARKET, BY OFFERING, 2024–2029 (USD MILLION)
                        TABLE 129 ROW: STRUCTURAL HEALTH MONITORING MARKET FOR HARDWARE, BY TYPE, 2020–2023 (USD MILLION)
                        TABLE 130 ROW: STRUCTURAL HEALTH MONITORING MARKET FOR HARDWARE, BY TYPE, 2024–2029 (USD MILLION)
             11.5.2 SOUTH AMERICA
                        11.5.2.1 Rising construction of dams and bridges to contribute to market growth
                                     TABLE 131 SOUTH AMERICA: STRUCTURAL HEALTH MONITORING MARKET, BY TECHNOLOGY, 2020–2023 (USD MILLION)
                                     TABLE 132 SOUTH AMERICA: STRUCTURAL HEALTH MONITORING MARKET, BY TECHNOLOGY, 2024–2029 (USD MILLION)
             11.5.3 MIDDLE EAST & AFRICA
                        TABLE 133 MIDDLE EAST & AFRICA: STRUCTURAL HEALTH MONITORING MARKET, BY TECHNOLOGY, 2020–2023 (USD MILLION)
                        TABLE 134 MIDDLE EAST & AFRICA: STRUCTURAL HEALTH MONITORING MARKET, BY TECHNOLOGY, 2024–2029 (USD MILLION)
                        TABLE 135 MIDDLE EAST & AFRICA: STRUCTURAL HEALTH MONITORING MARKET, BY GEOGRAPHY, 2020–2023 (USD MILLION)
                        TABLE 136 MIDDLE EAST & AFRICA: STRUCTURAL HEALTH MONITORING MARKET, BY GEOGRAPHY, 2024–2029 (USD MILLION)
                        11.5.3.1 GCC countries
                                     11.5.3.1.1 Rising focus on managing essential infrastructure assets to propel market
                        11.5.3.2 Rest of Middle East & Africa
 
12 COMPETITIVE LANDSCAPE (Page No. - 179)
     12.1 OVERVIEW 
     12.2 STRATEGIES ADOPTED BY KEY PLAYERS, 2020–2023 
             TABLE 137 OVERVIEW OF STRATEGIES ADOPTED BY KEY MID- AND HIGH-LEVEL PLAYERS IN STRUCTURAL HEALTH MONITORING MARKET, 2020–2023
     12.3 REVENUE ANALYSIS OF KEY PLAYERS, 2019–2023 
             FIGURE 63 REVENUE ANALYSIS OF FIVE KEY PLAYERS, 2019–2023
     12.4 MARKET SHARE ANALYSIS, 2023 
             FIGURE 64 STRUCTURAL HEALTH MONITORING MARKET SHARE ANALYSIS, 2023
             TABLE 138 STRUCTURAL HEALTH MONITORING MARKET: DEGREE OF COMPETITION, 2023
     12.5 COMPANY VALUATION AND FINANCIAL METRICS 
             FIGURE 65 COMPANY VALUATION, 2023 (USD BILLION)
             FIGURE 66 FINANCIAL METRICS (EV/EBITDA), 2023
     12.6 BRAND/PRODUCT COMPARISON 
             FIGURE 67 BRAND/PRODUCT COMPARISON
     12.7 COMPANY EVALUATION MATRIX: KEY PLAYERS, 2023 
             FIGURE 68 STRUCTURAL HEALTH MONITORING MARKET: COMPANY EVALUATION MATRIX (KEY PLAYERS), 2023
             12.7.1 STARS
             12.7.2 EMERGING LEADERS
             12.7.3 PERVASIVE PLAYERS
             12.7.4 PARTICIPANTS
             12.7.5 COMPANY FOOTPRINT: KEY PLAYERS, 2023
                        12.7.5.1 Overall footprint
                                     FIGURE 69 STRUCTURAL HEALTH MONITORING MARKET: OVERALL FOOTPRINT
                        12.7.5.2 Offering footprint
                                     TABLE 139 STRUCTURAL HEALTH MONITORING MARKET: OFFERING FOOTPRINT
                        12.7.5.3 Technology footprint
                                     TABLE 140 STRUCTURAL HEALTH MONITORING MARKET: TECHNOLOGY FOOTPRINT
                        12.7.5.4 Vertical footprint
                                     TABLE 141 STRUCTURAL HEALTH MONITORING MARKET: VERTICAL FOOTPRINT
                        12.7.5.5 Region footprint
                                     TABLE 142 STRUCTURAL HEALTH MONITORING MARKET: REGION FOOTPRINT
     12.8 COMPANY EVALUATION MATRIX: START-UPS/SMES, 2023 
             FIGURE 70 STRUCTURAL HEALTH MONITORING: COMPANY EVALUATION MATRIX (START-UPS/SMES), 2023
             12.8.1 PROGRESSIVE COMPANIES
             12.8.2 RESPONSIVE COMPANIES
             12.8.3 DYNAMIC COMPANIES
             12.8.4 STARTING BLOCKS
             12.8.5 COMPETITIVE BENCHMARKING: START-UPS/SMES, 2023
                        12.8.5.1 List of key start-ups/SMEs
                                     TABLE 143 STRUCTURAL HEALTH MONITORING MARKET: LIST OF KEY START-UPS/SMES
                        12.8.5.2 Competitive benchmarking of key start-ups/SMEs
                                     TABLE 144 STRUCTURAL HEALTH MONITORING MARKET: COMPETITIVE BENCHMARKING OF KEY START-UPS/SMES
     12.9 COMPETITIVE SCENARIOS AND TRENDS 
             12.9.1 PRODUCT LAUNCHES
                        TABLE 145 STRUCTURAL HEALTH MONITORING MARKET: PRODUCT LAUNCHES, MARCH 2020–DECEMBER 2023
             12.9.2 DEALS
                        TABLE 146 STRUCTURAL HEALTH MONITORING MARKET: DEALS, MARCH 2020–DECEMBER 2023
             12.9.3 OTHERS
                        TABLE 147 STRUCTURAL HEALTH MONITORING MARKET: OTHERS, MARCH 2020–DECEMBER 2023
 
13 COMPANY PROFILES (Page No. - 203)
(Business Overview, Products/Solutions/Services Offered, Recent Developments, and MnM View (Key strengths/Right to Win, Strategic Choices Made, and Weaknesses and Competitive Threats))*  
     13.1 KEY PLAYERS 
             13.1.1 COWI A/S
                        TABLE 148 COWI A/S: COMPANY OVERVIEW
                        FIGURE 71 COWI A/S: COMPANY SNAPSHOT
                        TABLE 149 COWI A/S: PRODUCTS/SOLUTIONS/SERVICES OFFERED
                        TABLE 150 COWI A/S: DEALS
                        TABLE 151 COWI A/S: OTHERS
             13.1.2 CAMPBELL SCIENTIFIC, INC.
                        TABLE 152 CAMPBELL SCIENTIFIC, INC.: COMPANY OVERVIEW
                        TABLE 153 CAMPBELL SCIENTIFIC, INC.: PRODUCTS/SOLUTIONS/SERVICES OFFERED
                        TABLE 154 CAMPBELL SCIENTIFIC, INC.: PRODUCT LAUNCHES
                        TABLE 155 CAMPBELL SCIENTIFIC, INC.: DEALS
             13.1.3 GEOKON
                        TABLE 156 GEOKON: COMPANY OVERVIEW
                        TABLE 157 GEOKON: PRODUCTS/SOLUTIONS/SERVICES OFFERED
                        TABLE 158 GEOKON: PRODUCT LAUNCHES
                        TABLE 159 GEOKON: DEALS
             13.1.4 NOVA METRIX
                        TABLE 160 NOVA METRIX: COMPANY OVERVIEW
                        TABLE 161 NOVA METRIX: PRODUCTS/SOLUTIONS/SERVICES OFFERED
                        TABLE 162 NOVA METRIX: PRODUCT LAUNCHES
             13.1.5 SGS SA
                        TABLE 163 SGS SA: COMPANY OVERVIEW
                        FIGURE 72 SGS SA: COMPANY SNAPSHOT
                        TABLE 164 SGS SA: PRODUCTS/SOLUTIONS/SERVICES OFFERED
                        TABLE 165 SGS SA: DEALS
             13.1.6 TRIMBLE INC.
                        TABLE 166 TRIMBLE INC.: COMPANY OVERVIEW
                        FIGURE 73 TRIMBLE INC.: COMPANY SNAPSHOT
                        TABLE 167 TRIMBLE INC.: PRODUCTS/SOLUTIONS/SERVICES OFFERED
                        TABLE 168 TRIMBLE INC.: PRODUCT LAUNCHES
                        TABLE 169 TRIMBLE INC.: DEALS
             13.1.7 SIXENSE
                        TABLE 170 SIXENSE: COMPANY OVERVIEW
                        TABLE 171 SIXENSE: PRODUCTS/SOLUTIONS/SERVICES OFFERED
                        TABLE 172 SIXENSE: DEALS
                        TABLE 173 SIXENSE: OTHERS
             13.1.8 STRUCTURAL MONITORING SYSTEMS PLC.
                        TABLE 174 STRUCTURAL MONITORING SYSTEMS PLC.: COMPANY OVERVIEW
                        FIGURE 74 STRUCTURAL MONITORING SYSTEMS PLC.: COMPANY SNAPSHOT
                        TABLE 175 STRUCTURAL MONITORING SYSTEMS PLC.: PRODUCTS/SOLUTIONS/SERVICES OFFERED
             13.1.9 ACELLENT TECHNOLOGIES, INC.
                        TABLE 176 ACELLENT TECHNOLOGIES, INC.: COMPANY OVERVIEW
                        TABLE 177 ACELLENT TECHNOLOGIES, INC.: PRODUCTS/SOLUTIONS/SERVICES OFFERED
             13.1.10 DIGITEXX DATA SYSTEMS, INC.
                        TABLE 178 DIGITEXX DATA SYSTEMS, INC.: COMPANY OVERVIEW
                        TABLE 179 DIGITEXX DATA SYSTEMS, INC.: PRODUCTS/SOLUTIONS/SERVICES OFFERED
     13.2 OTHER PLAYERS 
             13.2.1 FIRST SENSOR AG
             13.2.2 BDI
             13.2.3 SISGEO
             13.2.4 RST INSTRUMENTS LTD.
             13.2.5 AVT RELIABILITY
             13.2.6 GEOMOTION SINGAPORE
             13.2.7 STRAINSTALL ( JAMES FISHER AND SONS PLC.)
             13.2.8 HBK
             13.2.9 KINEMETRICS
             13.2.10 FEAC ENGINEERING P.C.
             13.2.11 EFI GLOBAL, INC.
             13.2.12 SENSURON
             13.2.13 INFIBRA TECHNOLOGIES
             13.2.14 SODIS LAB
             13.2.15 SET POINT TECHNOLOGIES
             13.2.16 MISTRAS GROUP
             13.2.17 METIS DESIGN CORPORATION
             13.2.18 GEOSIG LTD.
*Details on Business Overview, Products/Solutions/Services Offered, Recent Developments, and MnM View (Key strengths/Right to Win, Strategic Choices Made, and Weaknesses and Competitive Threats) might not be captured in case of unlisted companies.  
 
14 APPENDIX (Page No. - 248)
     14.1 INSIGHTS FROM INDUSTRY EXPERTS 
     14.2 DISCUSSION GUIDE 
     14.3 KNOWLEDGESTORE: MARKETSANDMARKETS’ SUBSCRIPTION PORTAL 
     14.4 CUSTOMIZATION OPTIONS 
     14.5 RELATED REPORTS 
     14.6 AUTHOR DETAILS 


The study involved four major activities in estimating the size of the structural health monitoring market. Exhaustive secondary research has been carried out to collect information on the market, the peer markets, and the parent market. Both top-down and bottom-up approaches have been employed to estimate the total market size. Market breakdown and data triangulation methods have also been used to estimate the market for segments and subsegments.

Secondary Research

Revenues of companies offering structural health monitoring systems have been obtained from the secondary data available through paid and unpaid sources. The revenues have also been derived by analyzing the product portfolio of key companies, and these companies have been rated according to the performance and quality of their products.

In the secondary research process, various sources have been referred to for identifying and collecting information for this study on the structural health monitoring market. Secondary sources considered for this research study include government sources, corporate filings, and trade, business, and professional associations. Secondary data has been collected and analyzed to arrive at the overall market size, which has been further validated through primary research.

Secondary research has been mainly used to obtain key information about the supply chain of Structural health monitoring systems to identify key players based on their products and prevailing industry trends in the Structural health monitoring market by offering, type, panel size, location, vertical, and region. Secondary research also helped obtain market information- and technology-oriented key developments undertaken by market players to expand their presence and increase their market share.  

Primary Research

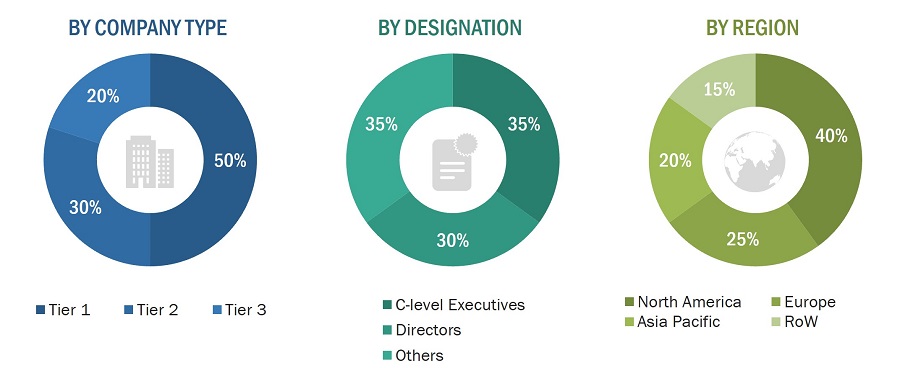
Extensive primary research has been conducted after understanding and analyzing the current scenario of the Structural health monitoring market through secondary research. Several primary interviews have been conducted with the key opinion leaders from the demand and supply sides across four main regions-North America, Europe, Asia Pacific, and the Rest of Europe. Approximately 25% of the primary interviews were conducted with the demand-side respondents, while approximately 75% were conducted with the supply-side respondents. The primary data has been collected through questionnaires, emails, and telephone interviews.

After interacting with industry experts, brief sessions were conducted with highly experienced independent consultants to reinforce the findings from our primary. This, along with the in-house subject matter experts’ opinions, has led us to the findings as described in the remainder of this report. The breakdown of primary respondents is as follows:
Structural Health Monitoring Market
 Size, and Share

To know about the assumptions considered for the study, download the pdf brochure

Market Size Estimation

The bottom-up procedure has been employed to arrive at the overall size of the structural health monitoring market.

  • Analyzing the size of the structural health monitoring market in each country by identifying segmental revenues of players in this market
  • Identifying the total number of structures in the country that require structural health monitoring
  • Estimating the prices of hardware and software solutions needed for the project
  • Estimating the size of the structural health monitoring market in each country (total number of structures that require monitoring in the country * total cost of hardware, software, and services)
  • Estimating the market size in each region by the summation of the country-wise market data
  • Identifying the upcoming structural health monitoring projects by various companies in different regions and forecasting the market size based on these development and other important parameters
  • Estimating the global market by the summation of region-wise data

Structural Health Monitoring Market
 Size, and Bottom-up Approach

The top-down approach has been used to estimate and validate the total size of the Structural health monitoring market.

  • Initially, the focus was on top-line investments and spending in the ecosystems. Further, the segment level splits and major developments in the market have been considered.
  • Information related to the market revenue generated by key players in the structural health monitoring market has been obtained.
  • Multiple discussions have been conducted with key opinion leaders from major companies that develop structural health monitoring instruments and software and provide monitoring and supply-related services.
  • Geographic splits have been estimated using secondary sources based on factors such as the number of players in a specific region, types of services or the instruments manufactured, and various end users related to the market.

Structural Health Monitoring Market
 Size, and Top- Down Approach

Data Triangulation

After arriving at the overall market size-using the market size estimation processes as explained above-the market has been split into several segments and subsegments. To complete the entire market engineering process and arrive at the exact statistics of each market segment and subsegment, data triangulation and market breakdown procedures have been employed, wherever applicable. The data has been triangulated by studying various factors and trends from the demand and supply sides in the structural health monitoring market.

Market Definition

Structural health monitoring is the process of implementing a damage detection strategy for any civil and mechanical engineering structures or components. Its goal is to identify structural changes and damages at the earliest so that corrective actions can be taken to reduce the risk of catastrophic failure, injury, or even loss of life, as well as minimize downtime and operational and maintenance costs. Structural health monitoring is required not only in pre-construction, under-construction, post-construction phases but also in the dilapidation stage. Structural health monitoring systems are crucial for the successful completion of infrastructural projects. Applications of structural health monitoring systems and services vary according to the complexity of the structure.

At present, structural health monitoring systems are adopted globally to monitor civil infrastructures such as dams, tunnels, bridges, buildings and stadiums. They find applications in aerospace & defense, energy, mining, industrial machinery, automotive & transportation, and marine markets. Structural health monitoring combines advanced sensor technologies with intelligent algorithms to infer the health condition of structures, enabling improved reliability and safety and enhanced structural performance.

Key Stakeholders

  • Semiconductor and electronic component manufacturers and distributors
  • Sensor manufacturers and distributors
  • Raw material and manufacturing equipment suppliers
  • Original equipment manufacturers (OEMs)
  • ODM and OEM technology solution providers
  • Technology standards organizations, forums, alliances, and associations
  • Government bodies, venture capitalists, and private equity firms
  • System integrators
  • Construction and infrastructure service providers
  • Green-field and brown-field project development companies
  • Research organizations
  • Technology investors

Report Objectives

  • To define, describe, segment, and forecast the structural health monitoring market, by offering, technology, and vertical, in terms of value
  • To forecast the market for sensors, which is the subsegment of hardware offerings, in terms of volume
  • To describe and forecast the market for various segments, with respect to four main regions, namely, the North America, Europe, Asia Pacific, and the RoW(South America, and MEA), in terms of value
  • To provide detailed information regarding drivers, restraints, opportunities, and challenges influencing the growth of the structural health monitoring market
  • To define and describe implementation methods and applications of structural health monitoring systems
  • To understand and analyze the impact of evolving technologies on the overall value chain of the structural health monitoring market and upcoming trends in the ecosystem
  • To forecast and compare the market size of pre-recession with that of the post-recession at the regional level
  • To provide a detailed overview of the structural health monitoring market’s value chain, along with the ecosystem, technology trends, use cases, regulatory environment, and Porter’s five forces analysis for the market
  • To analyze industry trends, pricing data, patents and innovations, and trade data (export and import data) related to the structural health monitoring systems
  • To strategically analyze the micromarkets with respect to individual growth trends, prospects, and contributions to the total market
  • To strategically profile the key players and comprehensively analyze their market share and core competencies
  • To analyze opportunities for stakeholders and provide a detailed competitive landscape of the market
  • To analyze competitive developments such as product launches/developments, contracts, collaborations, partnerships, agreements, acquisitions, expansions, and research and development (R&D) activities carried out by players in the structural health monitoring market

Available customizations:

With the given market data, MarketsandMarkets offers customizations according to the specific requirements of companies. The following customization options are available for the report:

  • Detailed analysis and profiling of additional market players based on various blocks of the supply chain
Custom Market Research Services

We will customize the research for you, in case the report listed above does not meet with your exact requirements. Our custom research will comprehensively cover the business information you require to help you arrive at strategic and profitable business decisions.

Request Customization

Instant Answers with GPT - Ask Now!

Ask real questions. Get complete answers !
Report Code
SE 3865
Published ON
Apr, 2024
Choose License Type
BUY NOW
  • SHARE
X
Request Customization
Speak to Analyst
Speak to Analyst
OR FACE-TO-FACE MEETING
PERSONALIZE THIS RESEARCH
  • Triangulate with your Own Data
  • Get Data as per your Format and Definition
  • Gain a Deeper Dive on a Specific Application, Geography, Customer or Competitor
  • Any level of Personalization
REQUEST A FREE CUSTOMIZATION
LET US HELP YOU!
  • What are the Known and Unknown Adjacencies Impacting the Structural Health Monitoring Market
  • What will your New Revenue Sources be?
  • Who will be your Top Customer; what will make them switch?
  • Defend your Market Share or Win Competitors
  • Get a Scorecard for Target Partners
CUSTOMIZED WORKSHOP REQUEST
+1-888-600-6441
  • Call Us
  • +1-888-600-6441 (Corporate office hours)
  • +1-888-600-6441 (US/Can toll free)
  • +44-800-368-9399 (UK office hours)
CONNECT WITH US
ABOUT TRUST ONLINE
©2024 MarketsandMarkets Research Private Ltd. All rights reserved
DMCA.com Protection Status Website Feedback