Temperature Monitoring Systems Market by Product (Monitor, Strip, Handheld, Wireless, Pyrometer, IR, Camera, Fiber Optic), Application (Cold Storage, Greenhouse, Life science, Patient), End user, and Region - Global Forecasts to 2024


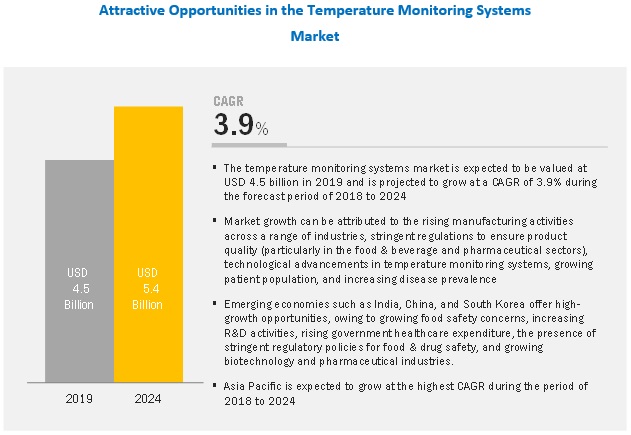
The temperature monitoring systems market is projected to reach USD 5.4 billion by 2024, at a CAGR of 3.9%. Growth in the market is mainly driven by the rising manufacturing activity across a range of industries, stringent regulations to ensure product quality (particularly in the food & beverage and pharmaceutical sectors), and technological advancements.
By type, the non-contact-based temperature monitoring systems segment is expected to grow at the highest rate during the forecast period
Non-contact-based temperature monitoring systems do not require direct contact with the intended energy source/object whose temperature needs to be measured. Based on type, the non-contact-based temperature monitoring systems market is further classified into pyrometers & IR thermometers, thermal imagers, and fiber optic thermometers.
Growth in the non-contact-based temperature monitoring systems segment can be attributed to factors such as increasing emphasis on continuous temperature monitoring, growing number of manufacturing and R&D activities, and advantages of contact-based temperature monitoring systems.
By application, the hospital room and patient temperature monitoring segment is expected to be the largest contributor to the temperature monitoring systems market in 2019
Based on application, the hospital and Patient Temperature Monitoring segment is estimated to account for the largest share in the market owing to the rising prevalence of infectious diseases, increasing geriatric and pediatric population, increasing number of surgical procedures, and the rising demand for advanced temperature monitoring devices.
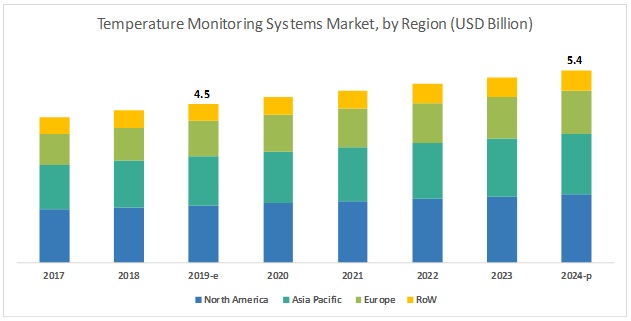
North America dominated the market in 2018
North America is one of the major revenue-generating regions in the global temperature monitoring systems industry. The large share of this regional segment can mainly be attributed to the presence of stringent regulatory guidelines and extensive regulatory compliance for product quality among target end-user industries, strong presence of major market players in the region, growing research pipeline among biopharmaceutical companies, and stringent regulatory norms for drug development and food & product safety regulations.
Some of the prominent players of the temperature monitoring systems market are 3M (US), Abb Ltd. (Switzerland), Deltatrack (US), Emerson Electric (US), Fluke Corporation (US), and Omega Engineering (US).
3M is among the significant players in the temperature monitoring systems market with its strong presence, unique product portfolio, and wide distribution network. The company has a significant share in the patient temperature monitoring systems segment. The company offers core temperature monitoring systems for preoperative testing. In order to increase awareness among end users, the company launched a compendium with the latest information and research findings related to its Bair Hugger.
Omega Engineering (US) offers various products used for the measurement of several physical parameters, such as temperature, humidity, pressure, strain, force, flow, level, pH, and conductivity. Its strength lies in its broad product portfolio, strong brand image, extensive customer base, and wide geographical presence.
Temperature Monitoring Systems Market Scope
|
Report Metric |
Details |
|
Market size available for years |
2017–2024 |
|
Base year considered |
2017 |
|
Forecast period |
2018–2024 |
|
Forecast units |
Value (USD) |
|
Segments covered |
Type, application, end user, and region |
|
Geographies covered |
North America (US & Canada), Europe (Germany, France, UK, and RoE), APAC (Japan, China, India, and RoAPAC), and the RoW |
|
Companies covered |
Major ten players covered, including |
This research report categorizes the temperature monitoring systems market into the following segments and subsegments:
By Type
-
Contact-based Temperature Monitoring Systems
- Conventional Temperature Monitoring Systems
- Temperature Measuring Strips and Labels
- Wireless Temperature Monitoring Systems
-
Non-contact-based Temperature Monitoring System
- Pyrometers and Infrared Thermometers
- Thermal Imagers
- Fiber Optic Thermometers
By Application
- Cold Storage Temperature Monitoring
- Green House Temperature Monitoring
- Server Room Temperature Monitoring
- Hospital Room and Patient Temperature Monitoring
- Home Care Temperature Monitoring
- Laboratory Temperature Monitoring
- Manufacturing Area Temperature Monitoring
By End User
-
Healthcare and Life Science Facilities
- Healthcare Providers
- Blood Banks, Tissue Banks, Diagnostic Labs, and IVF Clinics
- Patient Monitoring & Home Care Settings
- Other Healthcare and Life science Facilities
- Medical Device Manufacturing Companies
- Pharmaceutical and Biotechnology Companies
- Chemical and Petrochemical Manufacturers
- Energy and Power Generation Companies
- Food and Beverage Product Manufacturers
- Other End Users*
Other end users segment includes automotive, electronics, metal and mining, aerospace, and defense industries
By Region
-
North America
- US
- Canada
-
Europe
- Germany
- UK
- France
- Rest of Europe
-
Asia Pacific
- China
- India
- Japan
- Rest of APAC
- Rest of the World (RoW)*
* RoW includes Latin America, the Middle East, and Africa
Recent Developments:
- In 2018, DeltaTrak (US) launched its FlashTrak PreCool Prime
- In 2018, Monnit Corporation (US) launched its ALTA Serial MODBUS Gateway and ALTA Industrial Quad Temperature Sensor
- In 2018, Emerson acquired Cooper-Atkins to strengthen its commercial & residential solutions business
- In 2017, SensoScientific (US) received a contract from Vizient Inc., a GPO-based in the US. As per the contract, SensoScientific’s wireless temperature monitoring and other environmental monitoring products will be made available to Vizient Inc.
Key questions addressed in the report:
- What are the growth opportunities related to temperature monitoring systems across major regions in the future?
- Emerging countries have immense opportunities for the growth and adoption of temperature monitoring systems. Will this scenario continue in the next five years?
- What are the various temperature monitoring systems and their market share in the overall market?
- What are the new trends and advancements in the temperature monitoring systems market?
- How will the evolution of wireless temperature monitoring systems impact the overall adoption and industry of temperature monitoring systems?
Frequently Asked Questions (FAQ):
What is the size of Temperature Monitoring Systems Market ?
The temperature monitoring systems market is projected to reach USD 5.4 billion by 2024, growing at a CAGR of 3.9%.
What are the major growth factors of Temperature Monitoring Systems Market ?
Growth in the market is mainly driven by the rising manufacturing activity across a range of industries, stringent regulations to ensure product quality (particularly in the food & beverage and pharmaceutical sectors), and technological advancements.
Who all are the prominent players of Temperature Monitoring Systems Market ?
Some of the prominent players of the temperature monitoring systems market are 3M (US), Abb Ltd. (Switzerland), Deltatrack (US), Emerson Electric (US), Fluke Corporation (US), and Omega Engineering (US). .
To speak to our analyst for a discussion on the above findings, click Speak to Analyst
Table of Contents
1 Introduction (Page No. - 17)
1.1 Objectives of the Study
1.2 Market Definition
1.3 Market Scope
1.3.1 Markets Covered
1.3.2 Years Considered for the Study
1.4 Currency Used for the Study
1.5 Major Market Stakeholders
2 Research Methodology (Page No. - 21)
2.1 Introduction
2.2 Secondary Research
2.2.1 Key Data From Secondary Sources
2.3 Primary Research
2.3.1 Key Data From Primary Sources
2.4 Market Size Estimation Methodology
2.4.1 Product-Based Market Estimation
2.4.2 End-User-Based Market Estimation
2.4.3 Primary Research Validation
2.5 Market Data Validation and Triangulation
2.6 Assumptions for the Study
2.7 Limitations
3 Executive Summary (Page No. - 30)
4 Premium Insights (Page No. - 35)
4.1 Temperature Monitoring Systems Market Overview
4.2 Temperature Monitoring Systems Market Share, By Type, 2018
4.3 Temperature Monitoring Systems Market, By End User, 2018 vs 2024 (USD Million)
4.4 Temperature Monitoring Systems Market, By Application, 2018 vs 2024 (USD Million)
4.5 Temperature Monitoring Systems Market, By Region
5 Market Overview (Page No. - 39)
5.1 Introduction
5.2 Market Dynamics
5.2.1 Drivers
5.2.1.1 Expansion in the Secondary Manufacturing Sector
5.2.1.2 Stringent Regulations Governing the Food & Beverage and Pharmaceutical Industries
5.2.1.3 Availability of Wireless Temperature Monitoring Systems for Remote Monitoring
5.2.1.4 Rising Patient Population and the Subsequent Increase in the Number of Diagnostic and Surgical Procedures
5.2.1.5 Impending Patent Cliff
5.2.2 Opportunities
5.2.2.1 Growth Opportunities in Emerging Markets
5.2.3 Challenges
5.2.3.1 High Prices of Advanced Products in Developing Countries
5.2.3.2 Technical Limitations Associated With Infrared and Mercury Thermometers
6 Temperature Monitoring Systems Market, By Type (Page No. - 44)
6.1 Introduction
6.2 Contact-Based Temperature Monitoring Systems
6.2.1 Contact-Based Temperature Monitoring Systems Market, By Application 2017–2024 (USD Million)
6.2.2 Contact-Based Temperature Monitoring Systems Market, By End User 2017–2024 (USD Million)
6.2.3 Conventional Temperature Monitoring Systems
6.2.3.1 Limitations of Sensors Used in Conventional Temperature Monitoring Systems to Restrain Market Growth
6.2.3.2 Conventional Temperature Monitoring Systems Market, By Application, 2017–2024 (USD Million)
6.2.3.3 Conventional Temperature Monitoring Systems Market, By End User, 2017–2024 (USD Million)
6.2.4 Wireless Temperature Monitoring Systems
6.2.4.1 Wireless Temperature Monitoring Systems to Witness Significant Adoption Owing to Their Procedural Advantages
6.2.4.2 Wireless Temperature Monitoring Systems Market, By Application, 2017–2024 (USD Million)
6.2.4.3 Wireless Temperature Monitoring Systems Market, By End User
6.2.5 Temperature Measuring Strips and Labels
6.2.5.1 Wireless Temperature Monitoring Systems Market, By End User, 2017–2024 (USD Million)
6.2.5.2 Temperature Measuring Strips and Labels Market, By Application, 2017–2024 (USD Million)
6.2.5.3 Temperature Measuring Strips and Labels Market, By End User, 2017–2024 (USD Million)
6.3 Non-Contact-Based Temperature Monitoring Systems
6.3.1 Non-Contact-Based Temperature Monitoring Systems Market, By Application, 2017–2024 (USD Million)
6.3.2 Non-Contact-Based Temperature Monitoring Systems Market, By End User, 2017–2024 (USD Million)
6.3.3 Pyrometers and Infrared Thermometers
6.3.3.1 Precise Monitoring Needs in Industrial Manufacturing Processes to Drive the Higher Adoption of Pyrometers and IR Thermometers
6.3.3.2 Pyrometers and Infrared Thermometers Market, By Application, 2017–2024 (USD Million)
6.3.3.3 Pyrometers and Infrared Thermometers Market, By End User, 2017–2024 (USD Million)
6.3.4 Thermal Imagers
6.3.4.1 High Cost of Thermal Imagers to Restrain Market Growth to A Certain Extent
6.3.4.2 Thermal Imagers Market, By Application, 2017–2024 (USD Million)
6.3.4.3 Thermal Imagers Market, By End User, 2017–2024 (USD Million)
6.3.5 Fiber Optic Thermometers
6.3.5.1 Ability of Fiber Optic Thermometers to Withstand Harsh Conditions to Support Their Adoption in Various Industries
6.3.5.2 Fiber Optic Thermometers Market, By Application, 2017–2024 (USD Million)
6.3.5.3 Fiber Optic Thermometers Market, By End User, 2017–2024 (USD Million)
7 Temperature Monitoring Systems Market, By Application (Page No. - 63)
7.1 Introduction
7.2 Hospital Room and Patient Temperature Monitoring
7.2.1 Stringent Regulations for Effective Patient Care to Drive the Demand for Hospital Room Temperature Monitoring
7.3 Manufacturing Area Temperature Monitoring
7.3.1 Increased Industrial Production and Manufacturing Output to Drive the Market Demand for Manufacturing Area Monitoring
7.4 Cold Storage Temperature Monitoring
7.4.1 Growth of the Food & Beverage Industry—One of the Major Driving Factors for Cold Storage Temperature Monitoring
7.5 Laboratory Temperature Monitoring
7.5.1 Regulatory Guidelines Related to Laboratory Monitoring to Drive the Overall Market Demand
7.6 Server Room Temperature Monitoring
7.6.1 Industry Recommendations for Data Centers to Support the Market Growth of This Application Segment
7.7 Greenhouse Temperature Monitoring
7.7.1 Favorable Government Regulations and Industry Incentives to Support the Growth of This Application Segment
7.8 Home Care Temperature Monitoring
7.8.1 Growing Preference for Home and Remote Monitoring to Support the Growth of This Application Segment
8 Temperature Monitoring Systems Market, By End User (Page No. - 73)
8.1 Introduction
8.2 Healthcare & Life Science Facilities
8.2.1 Patient Monitoring & Home Care Settings
8.2.1.1 High Cost of Advanced Temperature Monitoring Devices in Patient Care is Limiting Their Optimal Market Adoption
8.2.2 Healthcare Providers
8.2.2.1 Significant Use of Temperature Monitoring Systems By This End-User Segment for Patient Care and Optimized Workflow to Drive Market Growth
8.2.3 Blood Banks, Tissue Banks, Diagnostic Labs, and IVF Clinics
8.2.3.1 Extensive Use of Temperature Maintenance Systems to Reduce Clinical Risk is A Key Market Driver
8.2.4 Other Healthcare & Life Science Facilities
8.3 Chemical & Petrochemical Manufacturers
8.3.1 Rising Demand for and Production of Various Chemicals and Petroleum From Different Industrial Verticals is Aiding Market Growth
8.4 Food & Beverage Product Manufacturers
8.4.1 Availability of Dedicated Systems for Food Processing to Support Market Growth
8.5 Energy & Power Generation Companies
8.5.1 Increase in the Global Demand for and Consumption of Energy Drives the Market
8.6 Pharmaceutical & Biotechnology Companies
8.6.1 Stringent Manufacturing Regulations in the Pharmaceutical Sector to Result in Higher Product Adoption
8.7 Medical Device Manufacturing Companies
8.7.1 Expanding Product Development Pipelines to Support the Growth of This End-User Segment
8.8 Other End Users
9 Temperature Monitoring Systems Market, By Region (Page No. - 87)
9.1 Introduction
9.2 North America
9.2.1 US
9.2.1.1 Increased Diagnostic & Surgical Procedures and the Strong Presence of Major Players to Drive Market Growth in the Us
9.2.2 Canada
9.2.2.1 Growth in the Canadian Market is Mainly Driven By the Stringent Regulatory Framework for Product Safety
9.3 Europe
9.3.1 Germany
9.3.1.1 Germany Accounted for the Largest Share of the European Temperature Monitoring Systems Market in 2018
9.3.2 UK
9.3.2.1 Growth in This Market is Driven By the Rising Number of Research Activities and A Strong Research Base in the Country
9.3.3 France
9.3.3.1 Increasing Product Adoption Among Researchers in Various End-User Industries to Drive Market Growth
9.3.4 Rest of Europe
9.4 Asia Pacific
9.4.1 China
9.4.1.1 High Prevalence of Infectious Diseases to Drive Market Growth in China
9.4.2 Japan
9.4.2.1 The High Demand for FLU Tests and Large Patient Population Base are Key Factors Driving Market Growth in Japan
9.4.3 India
9.4.3.1 Expansion in the Manufacturing Sector and Growing Focus on Food Safety and Drug Quality are Driving Market Growth
9.4.4 Rest of Asia Pacific
9.5 Rest of the World
10 Competitive Landscape (Page No. - 127)
10.1 Overview
10.2 Global Market Ranking Analysis, 2017
10.3 Competitive Scenario (2016–2019)
10.3.1 Product Launches
10.3.2 Acquisitions
10.3.3 Contracts
10.3.4 Expansions
10.4 Vendor Inclusion Criteria
10.5 Competitive Leadership Mapping (Overall Market)
10.5.1 Visionary Leaders
10.5.2 Innovators
10.5.3 Dynamic Differentiators
10.5.4 Emerging Players
11 Company Profiles (Page No. - 132)
(Business Overview, Products Offered, Recent Developments, MnM View)*
11.1 3M
11.2 ABB Ltd.
11.3 Deltatrak
11.4 Emerson Electric
11.5 Fluke Corporation (A Subsidiary of Fortive Corporation)
11.6 Honeywell
11.7 Kelsius, Ltd.
11.8 Monnit Corporation
11.9 Omega Engineering (A Subsidiary of Spectris)
11.10 Rees Scientific
11.11 Sensoscientific, Inc.
11.12 Siemens AG
11.13 Testo AG
11.14 Thermo Fisher Scientific
11.15 Vaisala
*Details on Business Overview, Products Offered, Recent Developments, MnM View Might Not Be Captured in Case of Unlisted Companies.
12 Appendix (Page No. - 161)
12.1 Discussion Guide
12.2 Knowledge Store: Marketsandmarkets’ Subscription Portal
12.3 Available Customizations
12.4 Related Reports
12.5 Author Details
List of Tables (103 Tables)
Table 1 Temperature Monitoring Systems Market, By Type, 2017–2024 (USD Million)
Table 2 Contact-Based Temperature Monitoring Systems Market, By Type, 2017–2024 (USD Million)
Table 3 Contact-Based Temperature Monitoring Systems Market, By Region, 2017–2024 (USD Million)
Table 4 Contact-Based Temperature Monitoring Systems Market, By Application, 2017–2024 (USD Million)
Table 5 Contact-Based Temperature Monitoring Systems Market, By End User, 2017–2024 (USD Million)
Table 6 Conventional Temperature Monitoring Systems Market, By Region, 2017–2024 (USD Million)
Table 7 Conventional Temperature Monitoring Systems Market, By Application, 2017–2024 (USD Million)
Table 8 Conventional Temperature Monitoring Systems Market, By End User, 2017–2024 (USD Million)
Table 9 Wireless Temperature Monitoring Systems Market, By Region, 2017–2024 (USD Million)
Table 10 Wireless Temperature Monitoring Systems Market, By Application, 2017–2024 (USD Million)
Table 11 Wireless Temperature Monitoring Systems Market, By End User, 2017–2024 (USD Million)
Table 12 Temperature Measuring Strips and Labels Market, By Region, 2017–2024 (USD Million)
Table 13 Temperature Measuring Strips and Labels Market, By Application, 2017–2024 (USD Million)
Table 14 Temperature Measuring Strips and Labels Market, By End User, 2017–2024 (USD Million)
Table 15 Non-Contact-Based Temperature Monitoring Systems Market, By Type, 2017–2024 (USD Million)
Table 16 Non-Contact-Based Temperature Monitoring Systems Market, By Region, 2017–2024 (USD Million)
Table 17 Non-Contact-Based Temperature Monitoring Systems Market, By Application, 2017–2024 (USD Million)
Table 18 Non-Contact-Based Temperature Monitoring Systems Market, By End User, 2017–2024 (USD Million)
Table 19 Pyrometers and Infrared Thermometers Market, By Region, 2017–2024 (USD Million)
Table 20 Pyrometers and Infrared Thermometers Market, By Application, 2017–2024 (USD Million)
Table 21 Pyrometers and Infrared Thermometers Market, By End User, 2017–2024 (USD Million)
Table 22 Thermal Imagers Market, By Region, 2017–2024 (USD Million)
Table 23 Thermal Imagers Market, By Application, 2017–2024 (USD Million)
Table 24 Thermal Imagers Market, By End User, 2017–2024 (USD Million)
Table 25 Fiber Optic Thermometers Market, By Region, 2017–2024 (USD Million)
Table 26 Fiber Optic Thermometers Market, By Application, 2017–2024 (USD Million)
Table 27 Fiber Optic Thermometers Market, By End User, 2017–2024 (USD Million)
Table 28 Temperature Monitoring Systems Market, By Application, 2017–2024 (USD Million)
Table 29 Hospital Room Temperature Monitoring Market, By Region, 2017–2024 (USD Million)
Table 30 Manufacturing Area Temperature Monitoring Market, By Region, 2017–2024 (USD Million)
Table 31 Cold Storage Temperature Monitoring Market, By Region, 2017–2024 (USD Million)
Table 32 Laboratory Temperature Monitoring Market, By Region, 2017–2024 (USD Million)
Table 33 Server Room Temperature Monitoring Market, By Region, 2017–2024 (USD Million)
Table 34 Greenhouse Temperature Monitoring Market, By Region, 2017–2024 (USD Million)
Table 35 Home Care Temperature Monitoring Market, By Region, 2017–2024 (USD Million)
Table 36 Temperature Monitoring Systems Market, By End User, 2017–2024 (USD Million)
Table 37 Temperature Monitoring Systems Market for Healthcare & Life Science Facilities, By Type, 2017–2024 (USD Million)
Table 38 Temperature Monitoring Systems Market for Healthcare & Life Science Facilities, By Region, 2017–2024 (USD Million)
Table 39 Temperature Monitoring Systems Market for Patient Monitoring & Home Care Settings, By Region, 2017–2024 (USD Million)
Table 40 Temperature Monitoring Systems Market for Healthcare Providers, By Region, 2017–2024 (USD Million)
Table 41 Temperature Monitoring Systems Market for Blood Banks, Tissue Banks, Diagnostic Labs, and IVF Clinics, By Region, 2017–2024 (USD Million)
Table 42 Temperature Monitoring Systems Market for Other Healthcare & Life Science Facilities, By Region, 2017–2024 (USD Million)
Table 43 Temperature Monitoring Systems Market for Chemical & Petrochemical Manufacturers, By Region, 2017–2024 (USD Million)
Table 44 Temperature Monitoring Systems Market for Food & Beverage Product Manufacturers, By Region, 2017–2024 (USD Million)
Table 45 Temperature Monitoring Systems Market for Energy & Power Generation Companies, By Region, 2017–2024 (USD Million)
Table 46 Temperature Monitoring Systems Market for Pharmaceutical & Biotechnology Companies, By Region, 2017–2024 (USD Million)
Table 47 Temperature Monitoring Systems Market for Medical Device Manufacturing Companies, By Region, 2017–2024 (USD Million)
Table 48 Temperature Monitoring Systems Market for Other End Users, By Region, 2017–2024 (USD Million)
Table 49 Temperature Monitoring Systems Market, By Region, 2017–2024 (USD Million)
Table 50 North America: Temperature Monitoring Systems Market, By Country, 2017–2024 (USD Million)
Table 51 North America: Temperature Monitoring Systems Market, By Type, 2017–2024 (USD Million)
Table 52 North America: Contact-Based Temperature Monitoring Systems Market, By Type, 2017–2024 (USD Million)
Table 53 North America: Non-Contact-Based Temperature Monitoring Systems Market, By Type, 2017–2024 (USD Million)
Table 54 North America: Temperature Monitoring Systems Market, By Application, 2017–2024 (USD Million)
Table 55 North America: Temperature Monitoring Systems Market, By End User, 2017–2024 (USD Million)
Table 56 US: Temperature Monitoring Systems Market, By Type, 2017–2024 (USD Million)
Table 57 US: Contact-Based Temperature Monitoring Systems Market, By Type, 2017–2024 (USD Million)
Table 58 US: Non-Contact-Based Temperature Monitoring Systems Market, By Type, 2017–2024 (USD Million)
Table 59 Canada: Temperature Monitoring Systems Market, By Type, 2017–2024 (USD Million)
Table 60 Canada: Contact-Based Temperature Monitoring Systems Market, By Type, 2017–2024 (USD Million)
Table 61 Canada: Non-Contact-Based Temperature Monitoring Systems Market, By Type, 2017–2024 (USD Million)
Table 62 Europe: Temperature Monitoring Systems Market, By Country, 2017–2024 (USD Million)
Table 63 Europe: Temperature Monitoring Systems Market, By Type, 2017–2024 (USD Million)
Table 64 Europe: Contact-Based Temperature Monitoring Systems Market, By Type, 2017–2024 (USD Million)
Table 65 Europe: Non-Contact-Based Temperature Monitoring Systems Market, By Type, 2017–2024 (USD Million)
Table 66 Europe: Temperature Monitoring Systems Market, By Application, 2017–2024 (USD Million)
Table 67 Europe: Temperature Monitoring Systems Market, By End User, 2017–2024 (USD Million)
Table 68 Germany: Temperature Monitoring Systems Market, By Type, 2017–2024 (USD Million)
Table 69 Germany: Contact-Based Temperature Monitoring Systems Market, By Type, 2017–2024 (USD Million)
Table 70 Germany: Non-Contact-Based Temperature Monitoring Systems Market, By Type, 2017–2024 (USD Million)
Table 71 UK: Temperature Monitoring Systems Market, By Type, 2017–2024 (USD Million)
Table 72 UK: Contact-Based Temperature Monitoring Systems Market, By Type, 2017–2024 (USD Million)
Table 73 UK: Non-Contact-Based Temperature Monitoring Systems Market, By Type, 2017–2024 (USD Million)
Table 74 France: Temperature Monitoring Systems Market, By Type, 2017–2024 (USD Million)
Table 75 France: Contact-Based Temperature Monitoring Systems Market, By Type, 2017–2024 (USD Million)
Table 76 France: Non-Contact-Based Temperature Monitoring Systems Market, By Type, 2017–2024 (USD Million)
Table 77 RoE: Temperature Monitoring Systems Market, By Type, 2017–2024 (USD Million)
Table 78 RoE: Contact-Based Temperature Monitoring Systems Market, By Type, 2017–2024 (USD Million)
Table 79 RoE: Non-Contact-Based Temperature Monitoring Systems Market, By Type, 2017–2024 (USD Million)
Table 80 Asia Pacific: Temperature Monitoring Systems Market, By Country, 2017–2024 (USD Million)
Table 81 Asia Pacific: Temperature Monitoring Systems Market, By Type, 2017–2024 (USD Million)
Table 82 Asia Pacific: Contact-Based Temperature Monitoring Systems Market, By Type, 2017–2024 (USD Million)
Table 83 Asia Pacific: Non-Contact-Based Temperature Monitoring Systems Market, By Type, 2017–2024 (USD Million)
Table 84 Asia Pacific: Temperature Monitoring Systems Market, By Application, 2017–2024 (USD Million)
Table 85 Asia Pacific: Temperature Monitoring Systems Market, By End User, 2017–2024 (USD Million)
Table 86 China: Temperature Monitoring Systems Market, By Type, 2017–2024 (USD Million)
Table 87 China: Contact-Based Temperature Monitoring Systems Market, By Type, 2017–2024 (USD Million)
Table 88 China: Non-Contact-Based Temperature Monitoring Systems Market, By Type, 2017–2024 (USD Million)
Table 89 Japan: Temperature Monitoring Systems Market, By Type, 2017–2024 (USD Million)
Table 90 Japan: Contact-Based Temperature Monitoring Systems Market, By Type, 2017–2024 (USD Million)
Table 91 Japan: Non-Contact-Based Temperature Monitoring Systems Market, By Type, 2017–2024 (USD Million)
Table 92 India: Temperature Monitoring Systems Market, By Type, 2017–2024 (USD Million)
Table 93 2024 (USD Million)
Table 94 India: Non-Contact-Based Temperature Monitoring Systems Market, By Type, 2017–2024 (USD Million)
Table 95 RoAPAC: Temperature Monitoring Systems Market, By Type, 2017–2024 (USD Million)
Table 96 RoAPAC: Contact-Based Temperature Monitoring Systems Market, By Type, 2017–2024 (USD Million)
Table 97 RoAPAC: Non-Contact-Based Temperature Monitoring Systems Market, By Type, 2017–2024 (USD Million)
Table 98 RoW: Temperature Monitoring Systems Market, By Type, 2017–2024 (USD Million)
Table 99 RoW: Contact-Based Temperature Monitoring Systems Market, By Type, 2017–2024 (USD Million)
Table 100 RoW: Non-Contact-Based Temperature Monitoring Systems Market, By Type, 2017–2024 (USD Million)
Table 101 RoW: Temperature Monitoring Systems Market, By Application, 2017–2024 (USD Million)
Table 102 RoW: Temperature Monitoring Systems Market, By End User, 2017–2024 (USD Million)
Table 103 Global Temperature Monitoring Systems Market Ranking Analysis, By Key Players, 2017
List of Figures (36 Figures)
Figure 1 Temperature Monitoring Systems Market: Research Design
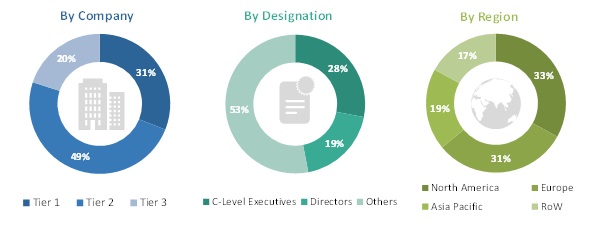
Figure 2 Breakdown of Primary Interviews: By Company Type, Designation, and Region
Figure 3 Research Methodology: Hypothesis Building
Figure 4 Market Size Estimation: Temperature Monitoring Systems
Figure 5 Data Triangulation Methodology
Figure 6 Temperature Monitoring Systems Market, By Type, 2018–2024 (USD Million)
Figure 7 Contact-Based Temperature Monitoring Systems Market Share, By Type, 2018 vs 2024
Figure 8 Non-Contact-Based Temperature Monitoring Systems Market Share, By Type, 2018 vs 2024
Figure 9 Temperature Monitoring Systems Market, By Application, 2018–2024 (USD Million)
Figure 10 Temperature Monitoring Systems Market, By End User, 2018–2024 (USD Million)
Figure 11 Regional Snapshot: Temperature Monitoring Systems Market
Figure 12 Expansion in the Secondary Manufacturing Sector to Drive Market Growth
Figure 13 Contact-Based Temperature Monitoring Systems Dominated the Market in 2018
Figure 14 Healthcare & Life Science Facilities to Dominate the End-User Market During the Forecast Period
Figure 15 Hospital and Patient Temperature Monitoring Segment is Projected to Dominate the Market During the Forecast Period
Figure 16 APAC to Grow at the Highest CAGR During the Forecast Period
Figure 17 Temperature Monitoring Systems Market: Drivers, Opportunities, and Challenges
Figure 18 Contact-Based Temperature Monitoring Systems Dominated the Temperature Monitoring Systems Market in 2018
Figure 19 Hospital Room and Patient Temperature Monitoring to Be the Major Application Area of Temperature Monitoring Systems During the Forecast Period
Figure 20 Healthcare & Life Science Facilities Dominated the Temperature Monitoring Systems End-User Market in 2018
Figure 21 North America to Dominate the Temperature Monitoring Systems Market During the Forecast Period
Figure 22 North America: Temperature Monitoring Systems Market Snapshot
Figure 23 Europe: Temperature Monitoring Systems Market Snapshot
Figure 24 Asia Pacific: Temperature Monitoring Systems Market Snapshot
Figure 25 RoW: Temperature Monitoring Systems Market Snapshot
Figure 26 Key Developments in the Temperature Monitoring Systems Market Between 2016 and 2018
Figure 27 Competitive Leadership Mapping: Key Global Players
Figure 28 3M: Company Snapshot (2017)
Figure 29 ABB Ltd.: Company Snapshot (2017)
Figure 30 Emerson Electric: Company Snapshot (2017)
Figure 31 Fortive Corporation: Company Snapshot (2017)
Figure 32 Honeywell: Company Snapshot (2017)
Figure 33 Spectris: Company Snapshot (2017)
Figure 34 Siemens AG: Company Snapshot (2017)
Figure 35 Thermo Fisher Scientific: Company Snapshot (2017)
Figure 36 Vaisala: Company Snapshot (2017)
The study involved four major activities to estimate the current market size for global temperature monitoring systems market. Exhaustive secondary research was done to collect information on the market and its different subsegments. The next step was to validate these findings, assumptions, and sizing with industry experts across the value chain through primary research. Both top-down and bottom-up approaches were employed to estimate the complete market size. Thereafter, market breakdown and data triangulation were used to estimate the market size of segments and subsegments.
Secondary Research
In the secondary research process, various secondary sources such as annual reports, press releases & investor presentations of companies, white papers, certified publications, articles by recognized authors, gold-standard & silver-standard websites, regulatory bodies, and databases (such as D&B Hoovers, Bloomberg Businessweek, and Factiva) were referred to in order to identify and collect information for this study.
Primary Research
The global temperature monitoring systems market comprises several stakeholders such as temperature monitoring system manufacturers, vendors, and distributors; medical device manufacturers, pharmaceutical and biotechnology companies, chemical and petrochemical manufacturers, and food and beverage product manufacturers. The demand side of this market is characterized by significant use of temperature monitoring systems due to the expansion in the secondary manufacturing sector and stringent regulations governing the food & beverage and pharmaceutical industries. The supply side is characterized by advancements in technology. Various primary sources from both the supply and demand sides of the market were interviewed to obtain qualitative and quantitative information.
The following is a breakdown of primary respondents:
To know about the assumptions considered for the study, download the pdf brochure
Temperature Monitoring Systems Market Size Estimation
Both top-down and bottom-up approaches were used to estimate and validate the total size of the temperature monitoring systems market. These methods were also used extensively to estimate the size of various subsegments in the market. The research methodology used to estimate the market size includes the following:
- The key players in the industry and markets have been identified through extensive secondary research.
- The industry’s supply chain and market size, in terms of value, have been determined through primary and secondary research.
- All percentage shares, splits, and breakdowns have been determined using secondary sources and verified through primary sources.
Data Triangulation
After arriving at the overall market size using the market size estimation processes as explained above the market was split into several segments and subsegments. In order to complete the overall market engineering process and arrive at the exact statistics of each market segment and subsegment, data triangulation and market breakdown procedures were employed, wherever applicable. The data was triangulated by studying various factors and trends from both the demand and supply sides in the temperature monitoring systems industry.
Report Objectives
- To define, describe, and forecast the temperature monitoring systems market on the basis of type, application, end user, and region
- To provide detailed information regarding factors influencing market growth (drivers, restraints, opportunities, and industry-specific challenges)
- To strategically analyze micromarkets with respect to individual growth trends, prospects, and contributions to the overall market
- To analyze growth opportunities in the market for major stakeholders and provide details of the competitive landscape for market leaders
- To forecast and estimate the market value of various segments and subsegments in North America, Europe, Asia Pacific, and the Rest of the World
- To strategically profile the key players and comprehensively analyze their market shares and core competencies
- To track and analyze competitive developments undertaken by major players in the temperature monitoring systems market such as product launches, expansions, contracts, and acquisitions
Available Customizations
With the given market data, MarketsandMarkets offers customizations as per the company’s specific needs. The following customization options are available for the report:
- Product Analysis: Product matrix, which gives a detailed comparison of the product portfolios of major five companies
- Company Information: Detailed analysis and profiling of additional market players (Up to 5)

 Generating Response ...


Growth opportunities and latent adjacency in Temperature Monitoring Systems Market