Thin Wall Packaging Market by Product Type (Tubs, Cups, Jars, Trays, Clamshells, Lids, Pots), Production Process (Thermoforming, Injection Molding), Material (PP, PE, PET, PS, PVC), Application (Food, Beverages), and Region - Global Forecast to 2023


Thin Wall Packaging Market Size And Forecast
[139 Pages Report] The study involved four major activities to estimate the current market size for thin wall packaging products. Exhaustive secondary research was done to collect information on the market, peer market, and the parent market. The next step was to validate these findings, assumptions, and sizing with industry experts across the value chain through primary research. Both top-down and bottom-up approaches were employed to estimate the complete market size. Thereafter, market breakdown and data triangulation were used to estimate the market size of the segments and subsegments.
Secondary Research
In the secondary research process, various secondary sources such as Hoovers, Bloomberg BusinessWeek, and Dun & Bradstreet have been referred to, so as to identify and collect information for this study. These secondary sources included annual reports, press releases & investor presentations of companies, white papers, certified publications, articles by recognized authors, gold & silver standard websites, food safety organizations, regulatory bodies, trade directories, and databases.
Primary Research
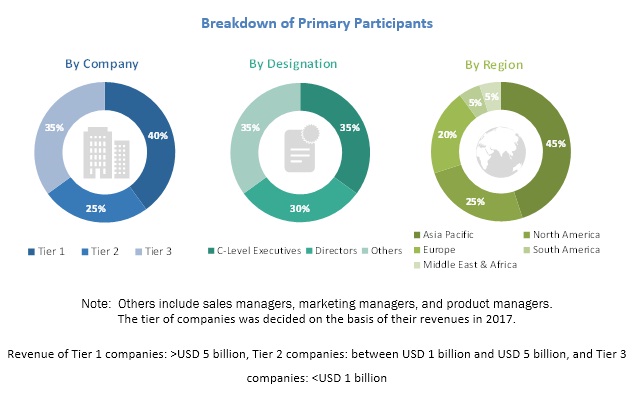
Various primary sources from both the supply and demand sides of the market were interviewed to obtain qualitative and quantitative information. The primary sources from the supply side include industry experts such as CEOs, vice presidents, marketing directors, sales professionals, and related key executives from various key companies and organizations operating in the thin wall packaging market. The primary sources from the demand side include key executives from the end-use industries of thin wall packaging such as food & beverage manufacturers, pharmaceutical companies, and FMCG companies. Seen here is the breakdown of primary respondents:
To know about the assumptions considered for the study, download the pdf brochure
Market Size Estimation
Both top-down and bottom-up approaches were used to estimate and validate the total size of the global thin wall packaging market. These approaches were also used extensively to estimate the size of various dependent subsegments in the market. The research methodology used to estimate the market size includes the following details:
- The key players were identified through extensive secondary research.
- The industry’s supply chain and market size, in terms of value, were determined through primary and secondary research processes.
- All percentage shares, splits, and breakdowns were determined using secondary sources and verified through primary sources.
Data Triangulation
After arriving at the overall market size from the estimation process explained above, the total market was split into several segments and subsegments. In order to complete the overall market engineering process and arrive at the exact statistics for all segments and subsegments, the data triangulation and market breakdown procedures were employed, wherever applicable. The data was triangulated by studying various factors and trends from both the demand and supply sides.
Research Objectives
- To define, analyze, and project the size of the global thin wall packaging market in terms of product type, material, production process, application, and region
- To project the size of the market and its subsegments in terms of value and volume, with respect to the five main regions, namely, North America, Europe, Asia Pacific, the Middle East & Africa, and South America
- To provide detailed information about the key factors, such as drivers, restraints, opportunities, and industry-specific challenges, influencing the market growth
- To strategically analyze the micromarkets1 with respect to individual growth trends, future prospects, and their contribution to the total market
- To analyze the opportunities in the market for stakeholders and provide details of a competitive landscape of the market leaders
- To analyze the competitive developments such as acquisitions, joint ventures, expansions, investments, and new product launches in the thin wall packaging market
- To strategically profile the key players and comprehensively analyze their market share and core competencies2
Get online access to the report on the World's First Market Intelligence Cloud
- Easy to Download Historical Data & Forecast Numbers
- Company Analysis Dashboard for high growth potential opportunities
- Research Analyst Access for customization & queries
- Competitor Analysis with Interactive dashboard
- Latest News, Updates & Trend analysis
Request Sample Scope of the Report
Get online access to the report on the World's First Market Intelligence Cloud
- Easy to Download Historical Data & Forecast Numbers
- Company Analysis Dashboard for high growth potential opportunities
- Research Analyst Access for customization & queries
- Competitor Analysis with Interactive dashboard
- Latest News, Updates & Trend analysis

|
Report Metric |
Details |
|
Market size available for years |
2016–2023 |
|
Base year considered |
2017 |
|
Forecast period |
2018–2023 |
|
Forecast units |
Value (USD) and Volume (MT) |
|
Segments covered |
Product Type, Production Process, Material, Application, and Region |
|
Geographies covered |
North America, Asia Pacific, Europe, South America, and Middle East & Africa |
|
Companies covered |
Amcor (Australia), Berry (US), Silgan (US), PACCOR (Germany), RPC Group (UK), Reynolds Group (New Zealand), and ILIP Srl (Italy) Total 25 major players covered |
This research report categorizes the thin wall packaging market based on product type, production process, material, application, and region.
On the basis of product type the thin wall packaging market has been categorized as follows:
- Tubs
- Cups
- Jars
- Trays
- Pots
- Clamshells
- Lids
On the basis of production process, the thin wall packaging market has been categorized as follows:
- Thermoforming
- Injection molding
On the basis of material, the thin wall packaging market has been categorized as follows:
- Polypropylene (PP)
-
Polyethylene (PE)
- High-density Polyethylene (HDPE)
- Low-density Polyethylene (LDPE)
- Polyethylene Terephthalate (PET)
- Polystyrene (PS)
- Polyvinyl Chloride (PVC)
On the basis of application, the thin wall packaging market has been categorized as follows:
- Food
- Beverages
- Others (pharmaceuticals, cosmetics & personal care, and industrial)
On the basis of region, the thin wall packaging market has been categorized as follows:
- North America
- Europe
- Asia Pacific
- Middle East & Africa
- South America
Available Customizations
With the given market data, MarketsandMarkets offers customizations according to client-specific needs.
The following customization options are available for the thin wall packaging report:
Product Analysis
- Product Matrix, which offers a detailed comparison of product portfolio of each company
Regional Analysis
- Further analysis of the thin wall packaging market for additional countries
Company Information
- Detailed analysis and profiling of additional market players (up to five)
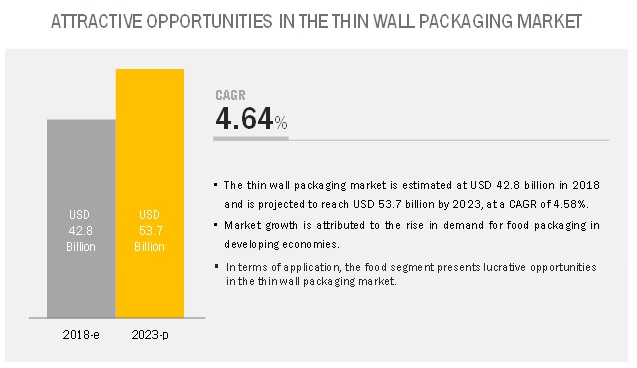
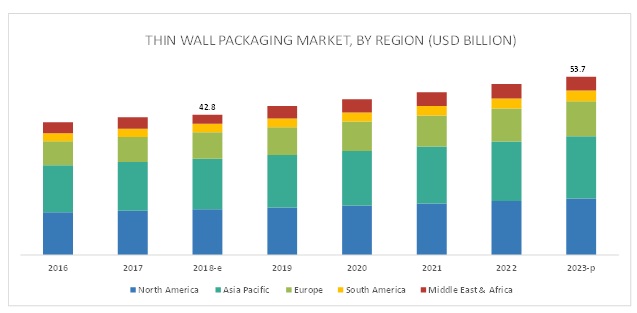
The thin wall packaging market is expected to grow from USD 42.8 billion in 2018 to reach USD 53.7 billion by 2023, at a CAGR of 4.64% from 2018. The changing lifestyles have boosted the market for packaged food & beverages, which is one of the most significant factors driving the growth of the thin wall packaging market during the forecast period. In addition, factors such as cost-effectiveness and improved aesthetic appeal of thin wall packaging are influencing the growth of the market.
The polypropylene segment is expected to dominate the thin wall packaging market through 2023
The polypropylene segment is projected to account for the largest share of the thin wall packaging market, in terms of value and volume, from 2018 to 2023. This is attributed to various benefits offered by polypropylene thin walled products, such as high stiffness, heat resistance, steam barrier properties (food protection), elasticity (film and fiber applications), enhanced transparency, and strong impact and rigidity balance.
The injection molding segment to register higher growth in the thin wall packaging market during the forecast period
The dominance of the injection molding segment is attributed to numerous benefits, including faster production speed, increased productivity, lower cost of production, and uniformity. The thermoforming segment is projected to register declining growth during the forecast period, in terms of volume. Thermoforming is majorly used in the manufacturing of polystyrene thin wall products. Polystyrene is banned in major countries as it can cause critical environmental concerns. Also, this process involves the wastage of materials and produces uneven thickness in packaging products. All the above factors have lowered the growth of this segment.
The Asia Pacific thin wall packaging market is projected to register the highest CAGR during the forecast period
The Asia Pacific is projected to be the fastest-growing region in the thin wall packaging market, in terms of value. Key factors such as industrialization, growth in middle-class population, the rise in disposable income, ease of convenient & visible packaging, and the rise in demand for sustainable packed products, especially in the food & beverage sector, are expected to drive the demand for thin-wall packaging in the Asia Pacific during the forecast period. Europe is projected to lead the market, in terms of demand, through the forecast period owing to improvements in the regional economy, the rise in the consumption of packaged food products, growing food service packaging sector, and the rising number of retail chains.
Key Market Players
The thin wall packaging market is dominated by large players, such as Amcor (Australia), Berry Global (US), Silgan Holdings (US), PACCOR (Germany), RPC Group (UK), Reynolds Group (New Zealand), ILIP Srl (Italy), Mold-Tek Packaging (India), Greiner Packaging International (Austria), and Double H Plastics (US).
Berry Global Group emphasizes on delivering high-quality customized solutions to its customers and on manufacturing products that are designed using research, unique development, and manufacturing technologies. It manufactures various thin wall packaging products, including hinged containers, frozen meal trays, lids, and cups. Its thin wall products are used in ice creams, pastries, food service packaging, condiments, salad dressing, and yogurt toppings, among others. The company focuses on expanding its customer base in various regions by adopting strategies such as mergers and acquisitions. For instance, in January 2014, Berry Plastics acquired Qingdao P&B Co., Ltd. (China) to expand its presence in the emerging Asian packaging market.
Recent Developments
- In August 2018, Amcor Limited announced to acquire Bemis Company, Inc. (US), under which Amcor would acquire Bemis in an all-stock combination. The transaction is expected to be valued at USD 6.8 billion and is expected to close by the first quarter of 2019. This transaction is aimed at increasing the R&D capabilities and expanding its geographical presence to cater to the demand for sustainable packaging. Under this transaction, Amcor’s shareholders would own 71%, while Bemis’ shareholders would own 29% of the combined company.
- In November 2017, RPC Superfos introduced an innovative spoon-in-the-lid solution for yogurts, desserts, and other dairy products. This lid is especially useful for consumers who eat on-the-go.
- In June 2017, RPC Group acquired Astrapak (South Africa), a key manufacturer of molded and thermoformed plastic packaging catering to the African market. This acquisition was aimed to increase RPC Group’s presence in the thin wall packaging market.
Key Questions Addressed by the Report:
- Where will all these developments take the industry in the mid to long term?
- What are the upcoming industry applications and trends for thin wall packaging?
To speak to our analyst for a discussion on the above findings, click Speak to Analyst
Table of Contents
1 Introduction (Page No. - 16)
1.1 Objectives of the Study
1.2 Market Definition
1.3 Market Scope
1.3.1 Periodization Considered
1.4 Currency Considered
1.5 Unit Considered
1.6 Stakeholders
2 Research Methodology (Page No. - 21)
2.1 Research Data
2.1.1 Secondary Data
2.1.1.1 Key Data From Secondary Sources
2.1.2 Primary Data
2.1.2.1 Key Data From Primary Sources
2.1.2.2 Breakdown of Primaries
2.2 Market Size Estimation
2.3 Data Triangulation
2.4 Research Assumptions
2.5 Research Limitations
3 Executive Summary (Page No. - 28)
4 Premium Insights (Page No. - 32)
4.1 Developing Economies to Register High Growth in Demand for Thin Wall Packaging
4.2 Thin Wall Packaging Market, By Material
4.3 Thin Wall Packaging Market, By Product Type
4.4 Thin Wall Packaging Market, By Application
4.5 Thin Wall Packaging Market, By Production Process
5 Market Overview (Page No. - 35)
5.1 Introduction
5.2 Market Dynamics
5.2.1 Drivers
5.2.1.1 Growth of the Food & Beverage Industry
5.2.1.2 Rise in Demand for Customer-Friendly and Lightweight Packaging
5.2.1.3 Increase in Urban Population, Changes in Lifestyles, and Rise in Disposable Income
5.2.2 Restraints
5.2.2.1 Stringent Regulations
5.2.3 Opportunities
5.2.3.1 Emerging Markets
5.2.4 Challenges
5.2.4.1 Recycling & Environmental Concerns
5.2.4.2 Volatile Raw Material Prices
6 Thin Wall Packaging Market, By Product Type (Page No. - 40)
6.1 Introduction
6.2 Tubs
6.2.1 Thin Wall Plastic Tubs Find Major Use in Packaging of Dairy Products Such as Yogurt, Margarine, Butter, and Ice Creams
6.3 Cups
6.3.1 Thin Wall Cups are Wide-Mouth Disposable Packaging Produced Using PP, PS, and PET
6.4 Trays
6.4.1 Trays Find Significant Application in Foodservice Packaging and Animal Protein
6.5 Jars
6.5.1 Jars to Witness the Largest Demand in the Thin Wall Packaging Market
6.6 Clamshells
6.6.1 Besides Food Packaging, Clamshells are Widely Used as Security Packages to Deter Packaging Pilferage
6.7 Pots
6.7.1 The Foodservice Packaging Sector to Drive the Demand for Thin Wall Pots
6.8 Lids
6.8.1 Thin Wall Lids to Grow at the Second-Highest CAGR
7 Thin Wall Packaging Market, By Production Process (Page No. - 44)
7.1 Introduction
7.2 Injection Molding
7.2.1 Injection Molding Process to Dominate the Production of Thin Wall Packaging
7.3 Thermoforming
7.3.1 Thermoform Packaging is Tamper-Evident and Resistant to Moisture
8 Thin Wall Packaging Market, By Application (Page No. - 47)
8.1 Introduction
8.2 Food
8.2.1 The Food Application to Lead the Demand for Thin Wall Packaging
8.3 Beverages
8.3.1 Demand for Packaged Drinking Water and Juices to Drive the Market for Thin Wall Packaging Containers in the Beverages Segment
8.4 Others
8.4.1 The Others Segment to Witness the Highest CAGR Among All Applications
9 Thin Wall Packaging Market, By Material (Page No. - 51)
9.1 Introduction
9.2 Polypropylene (PP)
9.2.1 Polypropylene to Account for the Largest Market Share Through 2023
9.3 High-Density Polyethylene (HDPE) and Low-Density Polyethylene (LDPE)
9.3.1 Europe to Remain the Largest Market for Polyethylene-Based Thin Wall Containers
9.4 Polyethylene Terephthalate (PET)
9.4.1 The Market for Polyethylene Terephthalate Packaging to Grow at the Highest CAGR, in Terms of Volume
9.5 Polystyrene (PS)
9.5.1 Polystyrene to Witness A Decline in Demand in the Thin Wall Packaging Market
9.6 Polyvinyl Chloride (PVC)
9.6.1 Toxic Emissions From Polyvinyl Chloride to Affect the Demand Negatively
9.7 Others
9.7.1 Among Others, Bioplastics to Register Significant Growth
10 Thin Wall Packaging Market, By Region (Page No. - 57)
10.1 Introduction
10.2 Europe
10.2.1 Germany
10.2.1.1 Germany to Dominate the Thin Wall Packaging Market in Europe
10.2.2 UK
10.2.2.1 Rise in Processed Food Exports and Increase in Demand for Convenience Packaging to Support the Growth of the Thin Wall Packaging Market in the Uk
10.2.3 France
10.2.3.1 France to Be the Second-Largest Market for Thin Wall Packaging in Europe
10.2.4 Italy
10.2.4.1 The Increased Demand for Thin Wall Packaging in the Food & Beverage Industry is the Main Driving Force for Growth in Italy
10.2.5 Russia
10.2.5.1 Demand for Packed and Processed & Semi-Processed Food Products to Determine the Demand for Thin Wall Packaging in Russia
10.2.6 Spain
10.2.6.1 Demand for Thin Wall Containers for Cosmetics Packaging is Expected to Grow the Fastest in Spain
10.2.7 Turkey
10.2.7.1 Turkey to Register the Highest CAGR in the European Thin Wall Packaging Market During the Forecast Period
10.2.8 Rest of Europe
10.3 North America
10.3.1 US
10.3.1.1 The US to Be the Largest Country-Level Market for Thin Wall Packaging, Globally
10.3.2 Canada
10.3.2.1 The Canadian Thin Wall Packaging Market is Characterized By Strict Regulations Pertaining to Food Packaging
10.3.3 Mexico
10.3.3.1 Mexico to Show High Prospects in the Demand for Thin Wall Packaging
10.4 Asia Pacific
10.4.1 China
10.4.1.1 China to Be the Fastest-Growing Market in the Global Thin Wall Packaging Market
10.4.2 Japan
10.4.2.1 The Japanese Government's Initiative to Downsize Packaging Material Consumption Supports the High Demand for Thin Wall Packaging in the Country
10.4.3 Australia
10.4.3.1 Demand for Convenient and Single-Serve Packaging to Drive the Australian Thin Wall Packaging Market
10.4.4 India
10.4.4.1 India to Grow at the Second-Highest CAGR During the Forecast Period
10.4.5 Rest of Asia Pacific
10.5 South America
10.5.1 Brazil
10.5.1.1 Brazil to Account for the Largest Share in the South American Thin Wall Packaging Market
10.5.2 Argentina
10.5.2.1 The Thin Wall Packaging Market in Argentina is Projected to Grow in Accordance With the Growth of the Food & Beverage Sector
10.5.3 Rest of South America
10.6 Middle East & Africa
10.6.1 UAE
10.6.1.1 UAE to Remain the Largest Market and Record the Highest Growth in the Thin Wall Packaging Market in MEA During the Forecast Period
10.6.2 South Africa
10.6.2.1 Growth of the Food & Beverage Sector to Boost the Demand for Thin Wall Packaging in South Africa
10.6.3 Saudi Arabia
10.6.3.1 Saudi Arabia to Account for the Second-Largest Share in the Thin Wall Packaging Market Through 2023
10.6.4 Rest of Middle East & Africa
11 Competitive Landscape (Page No. - 105)
11.1 Overview
11.2 Market Ranking
11.3 Competitive Scenario
11.3.1 New Product Launches
11.3.2 Acquisitions
11.3.3 Investments & Expansions
11.3.4 Joint Ventures
12 Company Profiles (Page No. - 112)
(Business Overview, Products Offered, Recent Developments, SWOT Analysis, MnM View)*
12.1 Amcor
12.2 Reynolds Group Holdings
12.3 Berry Global Group
12.4 RPC Group PLC
12.5 Silgan Holdings
12.6 Paccor GmbH (Coveris Rigid)
12.7 Ilip SRL
12.8 Mold-Tek Packaging
12.9 Greiner Packaging International
12.10 Double H Plastics
*Details on Business Overview, Products Offered, Recent Developments, SWOT Analysis, MnM View Might Not Be Captured in Case of Unlisted Companies.
12.11 Other Players
12.11.1 Oosterbeek Packaging B.V.
12.11.2 Groupe Guillin
12.11.3 Omniform Group
12.11.4 Takween Advanced Industries
12.11.5 International Traders(Sanpac)
12.11.6 Knauer Holding GmbH & Co. Kg
12.11.7 Sunrise Plastics
12.11.8 Insta Polypack
12.11.9 Dampack International Bv
12.11.10 Plastipak Industries Inc.
12.11.11 JRD International
12.11.12 Shree Rama Multi-Tech Limited
12.11.13 Færch Plast A/S
12.11.14 Acmepak Plastic Packaging Co., Ltd.
12.11.15 Sem Plastik San. Tic. A.S.
13 Appendix (Page No. - 137)
13.1 Discussion Guide
13.2 Knowledge Store: Marketsandmarkets’ Subscription Portal
13.3 Available Customizations
13.4 Related Reports
13.5 Author Details
List of Tables (106 Tables)
Table 1 USD Conversion Rates, 2014–2017
Table 2 Asia Pacific: Urbanization Prospects
Table 3 Thin Wall Packaging Market Size, By Product Type, 2016–2023 (USD Billion)
Table 4 Thin Wall Packaging Market Size, By Product Type, 2016–2023 (MT)
Table 5 Thin Wall Packaging Market Size, By Production Process, 2016-2023 (MT)
Table 6 Thin Wall Packaging Market Size, By Application, 2016–2023 (USD Billion)
Table 7 Thin Wall Packaging Market Size, By Application, 2016–2023 (MT)
Table 8 Thin Wall Packaging Market Size, By Material, 2016–2023 (USD Billion)
Table 9 Thin Wall Packaging Market Size, By Material, 2016–2023 (MT)
Table 10 Thin Wall Packaging Market Size, By Region, 2016–2023 (USD Billion)
Table 11 Thin Wall Packaging Market Size, By Region, 2016–2023 (MT)
Table 12 Europe: By Market Size, By Country, 2016–2023 (USD Billion)
Table 13 Europe: By Market Size, By Country, 2016–2023 (MT)
Table 14 Europe: By Market Size, By Material, 2016–2023 (USD Billion)
Table 15 Europe: By Market Size, By Material, 2016–2023 (MT)
Table 16 Europe: By Market Size, By Product Type, 2016–2023 (USD Billion)
Table 17 Europe: By Market Size, By Product Type, 2016–2023 (MT)
Table 18 Europe: By Market Size, By Production Process, 2016–2023 (MT)
Table 19 Europe: By Market Size, By Application, 2016–2023 (USD Billion)
Table 20 Europe: By Market Size, By Application, 2016–2023 (MT)
Table 21 Germany: By Market Size, By Application, 2016–2023 (USD Billion)
Table 22 Germany: By Market Size, By Application, 2016–2023 (MT)
Table 23 UK: By Market, By Application, 2016–2023 (USD Billion)
Table 24 UK: By Market Size, By Application, 2016–2023 (MT)
Table 25 France: By Market Size, By Application, 2016–2023 (USD Billion)
Table 26 France: By Market Size, By Application, 2016–2023 (MT)
Table 27 Italy: By Market Size, By Application, 2016–2023 (USD Billion)
Table 28 Italy: By Market Size, By Application, 2016–2023 (MT)
Table 29 Russia: By Market Size, By Application, 2016–2023 (USD Billion)
Table 30 Russia: By Market Size, By Application, 2016–2023 (MT)
Table 31 Spain: By Market Size, By Application, 2016–2023 (USD Billion)
Table 32 Spain: By Market Size, By Application, 2016–2023 (MT)
Table 33 Turkey: By Market Size, By Application, 2016–2023 (USD Billion)
Table 34 Turkey: By Market Size, By Application, 2016–2023 (MT)
Table 35 Rest of Europe: By Market Size, By Application, 2016–2023 (USD Billion)
Table 36 Rest of Europe: By Market Size, By Application, 2016–2023 (MT)
Table 37 North America: By Market Size, By Country, 2016–2023 (USD Billion)
Table 38 North America: By Market Size, By Country, 2016–2023 (MT)
Table 39 North America: By Market Size, By Material, 2016–2023 (USD Billion)
Table 40 North America: By Market Size, By Material, 2016–2023 (MT)
Table 41 North America: By Market Size, By Product Type, 2016–2023 (USD Billion)
Table 42 North America: By Market Size, By Product Type, 2016–2023 (MT)
Table 43 North America: By Market Size, By Production Process, 2016–2023 (MT)
Table 44 North America: By Market Size, By Application, 2016–2023 (USD Billion)
Table 45 North America: By Market Size, By Application, 2016–2023 (MT)
Table 46 US: By Market Size, By Application, 2016–2023 (USD Billion)
Table 47 US: By Market Size, By Application, 2016–2023 (MT)
Table 48 Canada: By Market Size, By Application, 2016–2023 (USD Billion)
Table 49 Canada: By Market Size, By Application, 2016–2023 (MT)
Table 50 Mexico: By Market Size, By Application, 2016–2023 (USD Billion)
Table 51 Mexico: By Market Size, By Application, 2016–2023 (MT)
Table 52 Asia Pacific: By Market Size, By Country, 2016–2023 (USD Billion)
Table 53 Asia Pacific: By Market Size, By Country, 2016–2023 (MT)
Table 54 Asia Pacific: By Market Size, By Material, 2016–2023 (USD Billion)
Table 55 Asia Pacific: By Market Size, By Material, 2016–2023 (MT)
Table 56 Asia Pacific: By Market Size, By Product Type, 2016–2023 (USD Billion)
Table 57 Asia Pacific: By Market Size, By Product Type, 2016–2023 (MT)
Table 58 Asia Pacific: By Market Size, By Production Process, 2016–2023 (MT)
Table 59 Asia Pacific: By Market Size, By Application, 2016–2023 (USD Billion)
Table 60 Asia Pacific: By Market Size, By Application, 2016–2023 (MT)
Table 61 China: By Market Size, By Application, 2016–2023 (USD Billion)
Table 62 China: By Market Size, By Application, 2016–2023 (MT)
Table 63 Japan: By Market Size, By Application, 2016–2023 (USD Billion)
Table 64 Japan: By Market Size, By Application, 2016–2023 (MT)
Table 65 Australia: By Market Size, By Application, 2016–2023 (USD Billion)
Table 66 Australia: By Market Size, By Application, 2016–2023 (MT)
Table 67 India: By Market Size, By Application, 2016–2023 (USD Billion)
Table 68 India: By Market Size, By Application, 2016–2023 (MT)
Table 69 Rest of Asia Pacific: By Market Size, By Application, 2016–2023 (USD Billion)
Table 70 Rest of Asia Pacific: By Market Size, By Application, 2016–2023 (MT)
Table 71 South America: By Market Size, By Country, 2016-2023 (USD Billion)
Table 72 South America: By Market Size, By Country, 2016-2023 (MT)
Table 73 South America: By Market Size, By Material, 2016-2023 (USD Billion)
Table 74 South America: By Market Size, By Material, 2016-2023 (MT)
Table 75 South America: By Market Size, By Product Type, 2016-2022 (USD Billion)
Table 76 South America: By Market Size, By Product Type, 2016-2023 (MT)
Table 77 South America: By Market Size, By Production Process, 2016-2023 (MT)
Table 78 South America: By Market Size, By Application, 2016-2023 (USD Billion)
Table 79 South America: By Market Size, By Application, 2016-2023 (MT)
Table 80 Brazil: By Market Size, By Application, 2016-2023 (USD Billion)
Table 81 Brazil: By Market Size, By Application, 2016-2023 (MT)
Table 82 Argentina: By Market Size, By Application, 2016-2023 (USD Billion)
Table 83 Argentina: By Market Size, By Application, 2016-2023 (MT)
Table 84 Rest of South America: By Market Size, By Application, 2016-2023 (USD Billion)
Table 85 Rest of South America: By Market Size, By Application, 2016-2023 (MT)
Table 86 Middle East & Africa: By Market Size, By Country, 2016-2023 (USD Billion)
Table 87 Middle East & Africa: By Market Size, By Country, 2016-2023 (MT)
Table 88 Middle East & Africa: By Market Size, By Material, 2016-2023 (USD Billion)
Table 89 Middle East & Africa: By Market Size, By Material, 2016-2023 (MT)
Table 90 Middle East & Africa: By Market Size, By Product Type, 2016-2023 (USD Billion)
Table 91 Middle East & Africa: By Market Size, By Product Type, 2016-2023 (MT)
Table 92 Middle East & Africa: By Market Size, By Production Process, 2016-2023 (MT)
Table 93 Middle East & Africa: By Market Size, By Application, 2016-2023 (USD Billion)
Table 94 Middle East & Africa: By Market Size, By Application, 2016-2023 (MT)
Table 95 UAE: By Market Size, By Application, 2016-2023 (USD Billion)
Table 96 UAE: By Market Size, By Application, 2016-2023 (MT)
Table 97 South Africa: By Market Size, By Application, 2016-2023 (USD Billion)
Table 98 South Africa: By Market Size, By Application, 2016-2023 (MT)
Table 99 Saudi Arabia: By Market Size, By Application, 2016-2023 (USD Billion)
Table 100 Saudi Arabia: By Market Size, By Application, 2016-2023 (MT)
Table 101 Rest of Middle East & Africa: By Market Size, By Application, 2016-2023 (USD Billion)
Table 102 Rest of Middle East & Africa: By Market Size, By Application, 2016-2023 (MT)
Table 103 New Product Launches
Table 104 Acquisitions
Table 105 Investments & Expansions
Table 106 Joint Ventures
List of Figures (33 Figures)
Figure 1 Thin Wall Packaging Market Segmentation
Figure 2 Thin Wall Packaging Market: Research Design
Figure 3 Market Size Estimation Methodology: Bottom-Up Approach
Figure 4 Market Size Estimation Methodology: Top-Down Approach
Figure 5 Thin Wall Packaging Market: Data Triangulation
Figure 6 Polypropylene to Be the Largest Material Segment Throughout the Forecast Period
Figure 7 Jars are Estimated to Dominate the Thin Wall Packaging Market in 2018
Figure 8 Food Application Segment Estimated to Lead the Thin Wall Packaging Market in 2018
Figure 9 Europe Dominated the Thin Wall Packaging Market in 2017
Figure 10 Rise in Packed Food Products in Developing Economies Offer Attractive Opportunities in the Thin Wall Packaging Market
Figure 11 PET Packaging to Grow at the Highest Rate During the Forecast Period
Figure 12 Jars Segment to Dominate the Thin Wall Packaging Market in 2018
Figure 13 Food Segment to Dominate the Thin Wall Packaging Market in 2018
Figure 14 Injection Molding Segment to Dominate the Thin Wall Packaging Market in 2018
Figure 15 Growing Food & Beverage Industry Results in Increased Demand for Thin Wall Packaging
Figure 16 Thin Wall Packaging Market Size, By Product Type, 2018 vs 2023 (USD Billion)
Figure 17 Thin Wall Packaging Market Size, By Production Process, 2018 vs 2023 (MT)
Figure 18 Thin Wall Packaging Market Size, By Application, 2018 vs 2023 (USD Billion)
Figure 19 Thin Wall Packaging Market Size, By Material, 2018 vs 2023 (USD Billion)
Figure 20 Geographical Snapshot (2018–2023): China is Projected to Register the Highest Growth Rate
Figure 21 Europe: Thin Wall Packaging Market Snapshot
Figure 22 Companies Adopted Various Growth Strategies From, 2014 to 2018
Figure 23 Market Ranking of Key Players, 2017
Figure 24 Amcor: Company Snapshot
Figure 25 Amcor: SWOT Analysis
Figure 26 Reynolds Group Holdings: Company Snapshot
Figure 27 Berry Global Group: Company Snapshot
Figure 28 Berry Global Group: SWOT Analysis
Figure 29 RPC Group PLC: Company Snapshot
Figure 30 RPC Group PLC: SWOT Analysis
Figure 31 Silgan Holdings: Company Snapshot
Figure 32 Mold-Tek Packaging: Company Snapshot
Figure 33 Greiner Packaging International: Company Snapshot


Growth opportunities and latent adjacency in Thin Wall Packaging Market