Transaction Monitoring Market by Component, Application Area (AML, FDP, Compliance Management, and Customer Identity Management), Function, Deployment Mode, Organization Size, Vertical, and Region - Global Forecast to 2023


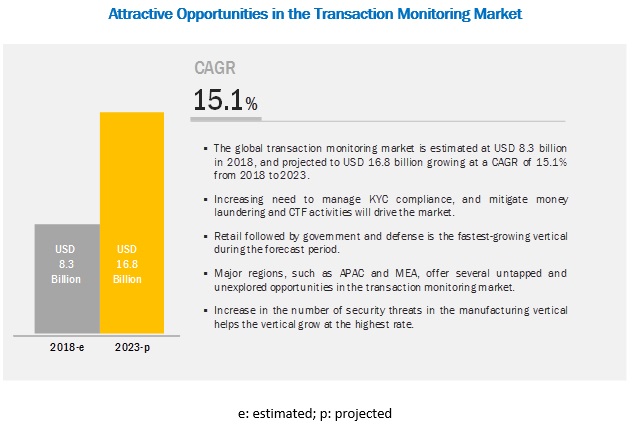
[152 Pages Report] The transaction monitoring market expected to grow from $8.3 billion in 2018 to $16.8 billion by 2023, at a Compound Annual Growth Rate (CAGR) of 15.1% during the forecast period. The organizations� need to manage KYC compliance, and mitigate money laundering and Counter-Terrorist Financing (CTF) activities; and the use of advanced analytics to provide proactive risk alerts are expected to be the major drivers of the market.
The cloud deployment mode to grow at a higher CAGR during the forecast period
The cloud deployment mode is expected to grow at a higher CAGR, as Small and Medium-sized Enterprises (SMEs) are rapidly adopting the cost-effective cloud deployment mode. This model helps SMEs avoid the costs associated with hardware, software, storage, and technical staff. The cloud-based platform offers a unified way in the form of Software-as-a-Service (SaaS)-based security services to secure business applications. It is also beneficial for organizations with strict budgets for security investments.
The SMEs segment to grow at a higher CAGR during the forecast period
The SMEs segment is expected to grow at a higher CAGR during the forecast period, due to the increasing data protection regulations and lack of high-cost security solution within the payment network infrastructure. SMEs are small in terms of their size, but cater to a large number of customers globally. The robust and comprehensive transaction monitoring solution is not implemented in SMEs due to financial constraints in these organizations. However, the large enterprises segment is estimated to account for a higher market share in 2018.
The transaction monitoring solution and services have been deployed across verticals, including Banking, Financial Services, and Insurance (BFSI); government and defense; IT and telecom; retail; healthcare; energy and utilities; and manufacturing; The retail vertical is expected to grow at the highest CAGR during the forecast period, whereas the BFSI vertical is estimated to have the largest Transaction Monitoring Market size in 2018.
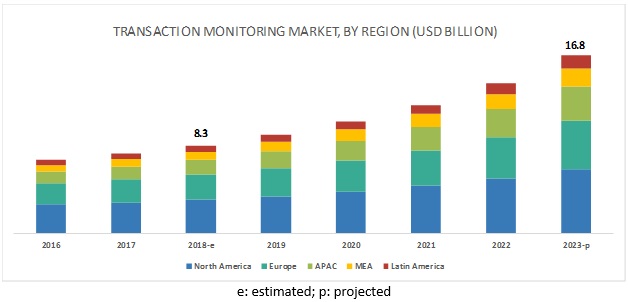
North America to account for the largest market size during the forecast period
The global transaction monitoring market has been segmented on the basis of regions into North America, Europe, Asia Pacific (APAC), Middle East and Africa (MEA), and Latin America to provide a region-specific analysis in the report. North America, followed by Europe, is expected to become the largest revenue-generating region for transaction monitoring solution and service vendors in 2018. The increasing need to manage KYC compliance, and mitigate money laundering and Counter-Terrorist Financing (CTF) activities; and use of advanced analytics to provide proactive risk alerts are some of the key factors expected to fuel the growth of the market in North America. The APAC market is gaining traction, as the transaction monitoring solution provides proactive security measures for preventing data breaches. SMEs as well as large organizations in the APAC region have become more aware of the transaction monitoring process and its benefits and started adopting them to secure from suspicious transactions and money laundering activities.
Key Market Players
Major vendors who offer transaction monitoring solutions across the globe are NICE (Israel), Oracle (US), FICO (US), BAE Systems (UK), Fiserv (US), SAS (US), Experian (Ireland), FIS (US), ACI Worldwide (US), Refinitiv (UK), Software AG (Germany), ComplyAdvantage (US), Infrasoft Technologies (India), ACTICO (Germany), ComplianceWise (Netherlands), EastNets (UAE), Bottomline (US), Beam Solutions (US), IdentityMind (US), and CaseWare (Canada). These vendors have adopted various types of organic and inorganic growth strategies, such as new product launches, partnerships and collaborations, to expand their offerings in the transaction monitoring market.
BAE systems is one of the leading operators of the world�s largest global transaction monitoring space that helps secure the payment networks from money laundering and CTF activities. The company is growing in the market by using various strategies, such as launching advanced products and services, and entering partnerships. Similarly, Fiserv, another leading transaction monitoring solutions provider, has implemented various strategies to deliver the cutting-edge transaction monitoring solution and services to global organizations. Various organic and inorganic growth strategies are helping transaction monitoring vendors in staying ahead in the global transaction monitoring market.
Get online access to the report on the World's First Market Intelligence Cloud
- Easy to Download Historical Data & Forecast Numbers
- Company Analysis Dashboard for high growth potential opportunities
- Research Analyst Access for customization & queries
- Competitor Analysis with Interactive dashboard
- Latest News, Updates & Trend analysis
Request Sample Scope of the Report
Get online access to the report on the World's First Market Intelligence Cloud
- Easy to Download Historical Data & Forecast Numbers
- Company Analysis Dashboard for high growth potential opportunities
- Research Analyst Access for customization & queries
- Competitor Analysis with Interactive dashboard
- Latest News, Updates & Trend analysis

|
Report Metrics |
Details |
|
Market size available for years |
2016�2023 |
|
Base year considered |
2017 |
|
Forecast period |
2018�2023 |
|
Forecast units |
Billion (USD) |
|
Segments covered |
Components, Application Areas, Functions, Deployment Modes, Organization Size, Verticals, and Regions |
|
Regions covered |
North America, APAC, Europe, MEA, and Latin America |
|
Companies covered |
NICE (Israel), Oracle (US), FICO (US), BAE Systems (UK), Fiserv (US), SAS (US), Experian (Ireland), FIS (US), ACI Worldwide (US), Refinitiv (UK), Software AG (Germany), ComplyAdvantage (US), Infrasoft Technologies (India), ACTICO (Germany), ComplianceWise (Netherlands), EastNets (UAE), Bottomline (US), Beam Solutions (US), IdentityMind (US), and CaseWare (Canada) |
This research report categorizes the transaction monitoring market based on components, application areas, functions, deployment modes, organization size, verticals, and regions.
Based on Components, the market has been segmented as follows:
- Solution
- Services
- Professional Services
- Consulting
- Integration
- Training and education
- Support and maintenance
- Managed Services
Based on Application Areas, the Transaction Monitoring Market has been segmented as follows:
- Anti-Money Laundering
- Customer Identity Management
- Fraud Detection and Prevention
- Compliance Management
Based on Functions, the Transaction Monitoring Market has been segmented as follows:
- Case Management
- KYC/Customer Onboarding
- Dashboard and Reporting
- Watch List Screening
Based on Deployment Modes, the transaction monitoring market has been segmented as follows:
- On-premises
- Cloud
Based on Organization Size, the market has been segmented as follows:
- Small and Medium-sized Enterprises (SMEs)
- Large enterprises
Based on Regions, the transaction monitoring market has been segmented as follows::
- North America
- US
- Canada
- Europe
- UK
- Germany
- France
- Rest of Europe
- APAC
- China
- Japan
- India
- Rest of APAC
- MEA
- Middle East
- Africa
- Latin America
- Brazil
- Mexico
- Rest of Latin America
Key questions addressed by the report:
- Define, describe, and forecast the transaction monitoring market based on components, application areas, functions, deployment modes, organization size, verticals, and regions.
- Detailed analysis of the market�s subsegments with respect to individual growth trends, prospects, and contributions to the total market
- Revenue forecast of the market�s segments with respect to 5 major regions, namely, North America, Europe, APAC, MEA, and Latin America
- Detailed analysis of the competitive developments, such as mergers and acquisitions, new product developments, and business expansions, in the market
Frequently Asked Questions (FAQ):
What is Transaction monitoring?
What are the application areas of transaction monitoring?
Below mentioned are the application areas of transaction monitoring
- Anti-Money Laundering
- Customer Identity Management
- Fraud Detection and Prevention
- Compliance Management
Why is transaction monitoring important?
Why is AML transaction monitoring process?
What are the functions of transaction monitoring?
- Case Management
- KYC/Customer Onboarding
- Dashboard and Reporting
- Watch List Screening
What are the top trends in transaction monitoring market?
Trends that are impacting the transaction monitoring market includes:
- Organizations� need to manage kyc compliance and mitigate money laundering and CTF activities
- Use of advanced analytics to provide proactive risk alerts
- Organizations� need to comply with stringent regulatory compliances
Opportunities for the transaction monitoring market:
- Integration of AI, machine learning, and big data analytics
- Increasing digitalization in payment transaction process
To speak to our analyst for a discussion on the above findings, click Speak to Analyst
Table of Contents
1 Introduction (Page No. - 18)
1.1 Objectives of the Study
1.2 Market Definition
1.3 Market Segmentation
1.4 Regions Covered
1.5 Years Considered for the Study
1.6 Currency Considered
1.7 Stakeholders
2 Research Methodology (Page No. - 21)
2.1 Research Data
2.1.1 Secondary Data
2.1.2 Primary Data
2.1.2.1 Breakup of Primaries
2.1.2.2 Key Industry Insights
2.2 Market Breakup and Data Triangulation
2.3 Market Size Estimation
2.3.1 Top-Down Approach
2.3.2 Bottom-Up Approach
2.4 Market Forecast
2.5 Assumptions for the Study
2.6 Limitations of the Study
3 Executive Summary (Page No. - 31)
4 Premium Insights (Page No. - 34)
4.1 Attractive Market Opportunities in the Transaction Monitoring Market
4.2 Market Share of Top 3 Verticals and Regions, 2018
4.3 Market, Top 3 Verticals
4.4 Market, By Component, 2018�2023
4.5 Market, By Deployment Mode, 2018
4.6 Market, By Organization Size, 2018
4.7 Market, Top 3 Verticals, 2018
4.8 Market Investment Scenario
5 Market Overview (Page No. - 39)
5.1 Introduction
5.2 Market Dynamics
5.2.1 Drivers
5.2.1.1 Organizations� Need to Manage KYC Compliance and Mitigate Money Laundering and CTF Activities
5.2.1.2 Use of Advanced Analytics to Provide Proactive Risk Alerts
5.2.1.3 Organizations� Need to Comply With Stringent Regulatory Compliances
5.2.2 Restraints
5.2.2.1 Lack of Risk Analysis Professionals
5.2.3 Opportunities
5.2.3.1 Integration of AI, Machine Learning, and Big Data Analytics
5.2.3.2 Increasing Digitalization in Payment Transaction Process
5.2.4 Challenges
5.2.4.1 Difficulties in Managing Cross-Border and Multi-Jurisdictional AML Compliance
5.3 Regulatory Landscape
5.3.1 Financial Industry Regulatory Authority
5.3.2 Financial Action Task Force
5.3.3 International Monetary Fund
5.3.4 General Data Protection Regulation
5.3.5 Gramm�Leach�Bliley Act
5.3.6 Sarbanes�Oxley Act
6 Transaction Monitoring Market, By Component (Page No. - 46)
6.1 Introduction
6.2 Solution
6.2.1 Increasing Malware and Zero-Day Attacks to Drive the Adoption of Transaction Monitoring Software
6.3 Services
6.3.1 Professional Services
6.3.1.1 Consulting Services
6.3.1.1.1 Need for Highly-Qualified Industry Experts and Domain Experts to Drive Consulting Services
6.3.1.2 Integration Services
6.3.1.2.1 Need for Integrating Complex Security Systems to Drive Integration Services
6.3.1.3 Training and Education
6.3.1.3.1 Need for Skilled Security Professionals to Drive Training and Education Services
6.3.1.4 Support and Maintenance
6.3.1.4.1 Demand for Service Providers Who Help Enterprises in Providing Installation, Maintenance, and Other Support Activities to Drive Support and Maintenance Services
6.3.2 Managed Services
6.3.2.1 Need to Comply With Stringent Regulations Driving Managed Services
7 Transaction Monitoring Market, By Application Area (Page No. - 55)
7.1 Introduction
7.2 Anti-Money Laundering
7.2.1 Need for Preventing Money Laundering Across the World to Fuel the Adoption of Transaction Monitoring
7.3 Customer Identity Management
7.3.1 Need to Secure Customer Identity Driving the Adoption of Transaction Monitoring
7.4 Fraud Detection and Prevention
7.4.1 Need to Minimize Electronic Payment Frauds Driving the Adoption of Transaction Monitoring Solutions
7.5 Compliance Management
7.5.1 Need to Comply With Continuously Evolving Regulations Fueling the Adoption of Transaction Monitoring Solutions
8 Market, By Function (Page No. - 60)
8.1 Introduction
8.2 Case Management
8.3 KYC/Customer Onboarding
8.4 Dashboard and Reporting
8.5 Watch List Screening
9 Transaction Monitoring Market, By Deployment Mode (Page No. - 61)
9.1 Introduction
9.2 On-Premises
9.2.1 Need to Control Platforms, Applications, Systems, and Data Transfers Driving On-Premises Transaction Monitoring
9.3 Cloud
9.3.1 Cost-Effectiveness of Cloud-Based Solutions to Drive Cloud-Based Transaction Monitoring
10 Market, By Organization Size (Page No. - 65)
10.1 Introduction
10.2 Small and Medium-Sized Enterprises
10.2.1 Growing Attacks in the Small and Medium-Sized Enterprises to Spur Demand for Transaction Monitoring
10.3 Large Enterprises
10.3.1 Need to Mitigate Financial Frauds in Large Enterprises to Fuel the Adoption of Transaction Monitoring
11 Transaction Monitoring Market, By Vertical (Page No. - 69)
11.1 Introduction
11.2 Banking, Financial Services, and Insurance
11.2.1 Growing Threat to Monetary Transactions Encouraging BFSI Organizations to Deploy Transaction Monitoring Solutions
11.3 Government and Defense
11.3.1 Increase in Bribery, Corruption, and Data Theft to Drive the Adoption of Transaction Monitoring Solutions in Government and Defense
11.4 IT and Telecom
11.4.1 Need to Protect Large Volume of Sensitive Data Driving the Adoption of Transaction Monitoring Solutions
11.5 Retail
11.5.1 Need to Secure Financial Transactions Driving the Adoption of Transaction Monitoring Solutions in the Retail Vertical
11.6 Healthcare
11.6.1 Need to Protect Sensitive Healthcare Data Driving the Adoption of Transaction Monitoring Solutions in Healthcare
11.7 Energy and Utilities
11.7.1 Frauds Over Billing and Loading, Tax, and Supply to Fuel the Demand for Transaction Monitoring in the Energy and Utilities Vertical
11.8 Manufacturing
11.8.1 Increasing Instances of Check Tampering, Money Laundering, and Asset Misappropriation Frauds to Increase the Adoption of Transaction Monitoring Solutions in the Manufacturing Vertical
11.9 Others
12 Transaction Monitoring Market, By Region (Page No. - 79)
12.1 Introduction
12.2 North America
12.2.1 United States
12.2.1.1 Increasing Initiatives By Organizations to Minimize Financial Crimes Driving the Growth of Market in United States
12.2.2 Canada
12.2.2.1 Organizations� Need to Comply With Stringent Regulations Fueling the Market in Canada
12.3 Europe
12.3.1 United Kingdom
12.3.1.1 Need to Comply With GDPr Driving the Growth of Market in United Kingdom
12.3.2 Germany
12.3.2.1 Use of Advanced Analytics to Provide Proactive Risk Alerts Driving the Growth of Market in Germany
12.3.3 France
12.3.3.1 Adoption of Proactive Approaches to Reduce Money Laundering Activities Driving the Growth of Transaction Monitoring Market in France
12.3.4 Rest of Europe
12.3.4.1 Organizations� Need to Comply With Cross-Border Regulations Encouraging Them to Deploy Transaction Monitoring Solutions
12.4 Asia Pacific
12.4.1 China
12.4.1.1 Complexities in Transaction Processing Systems Driving the Adoption of Transaction Monitoring in China
12.4.2 Japan
12.4.2.1 Organization� Initiatives to Proactively Mitigate Financial Crimes Driving the Growth of Transaction Monitoring in Japan
12.4.3 India
12.4.3.1 Increased Money Laundering Activities, Financial Frauds, and Corruption Drivering the Growth of Transaction Monitoring Market in India
12.4.4 Rest of Asia Pacific
12.5 Middle East and Africa
12.5.1 Middle East
12.5.1.1 Organizations� Need to Protect Financial Crimes Across BFSI, Energy and Utilities, and Healthcare Verticals Fueling the Demand for Transaction Monitoring Solutions in the Middle East
12.5.2 Africa
12.5.2.1 Increased Financial Losses Due to Growing Financial Crimes Driving the Adoption of Transaction Monitoring Solutions in Africa
12.6 Latin America
12.6.1 Brazil
12.6.1.1 Organizations� Need to Secure Payment Transaction Fueling the Adoption of Transaction Monitoring in Brazil
12.6.2 Mexico
12.6.2.1 Need for Security of Increasing Online Financial Transactions Fueling the Deployment of Transaction Monitoring Solutions in Mexico
12.6.3 Rest of Latin America
13 Competitive Landscape (Page No. - 105)
13.1 Overview
13.2 Competitive Scenario
13.2.1 Partnerships, Agreements, and Collaborations
13.2.2 New Product Launches/Product Enhancements
13.3 Competitive Leadership Mapping
13.3.1 Visionary Leaders
13.3.2 Inovators
13.3.3 Dynamic Differentiators
13.3.4 Emerging Players
14 Company Profiles (Page No. - 110)
14.1 Introduction
(Business Overview, Solutions Products Offered, Recent Developments, SWOT Analysis, and MnM View)*
14.2 FICO
14.3 Bae Systems
14.4 Fiserv
14.5 SAS
14.6 Experian
14.7 Nice
14.8 Oracle
14.9 FIS
14.10 ACI Worldwide
14.11 Software AG
14.12 Refinitiv
14.13 Complyadvantage
14.14 Infrasoft Technologies
14.15 Caseware
14.16 Actico
14.17 Compliancewise
14.18 Eastnets
14.19 Bottomline Technologies
14.20 Beam Solutions
14.21 Identitymind
*Details on Business Overview, Solutions Offered, Recent Developments, SWOT Analysis, and MnM View Might Not Be Captured in Case of Unlisted Companies.
15 Appendix (Page No. - 145)
15.1 Discussion Guide
15.2 Knowledge Store: Marketsandmarkets� Subscription Portal
15.3 Available Customizations
15.4 Related Reports
15.5 Author Details
List of Tables (76 Tables)
Table 1 Factor Analysis
Table 2 Transaction Monitoring Market Size and Growth, 2016�2023 (USD Million, Y-O-Y%)
Table 3 Market Size, By Component, 2016�2023 (USD Million)
Table 4 Solution: Market Size, By Region, 2016�2023 (USD Million)
Table 5 Market Size, By Service Type, 2016�2023 (USD Million)
Table 6 Services: Market Size, By Region, 2016�2023 (USD Million)
Table 7 Market Size, By Professional Service, 2016�2023 (USD Million)
Table 8 Professional Services: Transaction Monitoring Market Size, By Region, 2016�2023 (USD Million)
Table 9 Consulting Services Market Size, By Region, 2016�2023 (USD Million)
Table 10 Integration Services Market Size, By Region, 2016�2023 (USD Million)
Table 11 Training and Education Services Market Size, By Region, 2016�2023 (USD Million)
Table 12 Support and Maintenance Services Market Size, By Region, 2016�2023 (USD Million)
Table 13 Managed Services Market Size, By Region 2016�2023 (USD Million)
Table 14 Transaction Monitoring Market Size, By Application Area, 2016�2023 (USD Million)
Table 15 Anti-Money Laundering Market Size, By Region 2016�2023 (USD Million)
Table 16 Customer Identity Management Market Size, By Region, 2016�2023 (USD Million)
Table 17 Fraud Detection and Prevention Market Size, By Region, 2016�2023 (USD Million)
Table 18 Compliance Management Market Size, By Region 2016�2023 (USD Million)
Table 19 Market Size, By Deployment Mode, 2016�2023 (USD Million)
Table 20 On-Premises: Market Size, By Region, 2016�2023 (USD Million)
Table 21 Cloud Deployment Mode: Market Size, By Region, 2016�2023 (USD Million)
Table 22 Market Size, By Organization Size, 2016�2023 (USD Million)
Table 23 Small and Medium-Sized Enterprises: Market Size, By Region, 2016�2023 (USD Million)
Table 24 Large Enterprises: Market Size, By Region, 2016�2023 (USD Million)
Table 25 Transaction Monitoring Market Size, By Vertical, 2016�2023 (USD Million)
Table 26 Banking, Financial Services, and Insurance: Market Size, By Region, 2016�2023 (USD Million)
Table 27 Government and Defense: Market Size, By Region, 2016�2023 (USD Million)
Table 28 IT and Telecom: Market Size, By Region, 2016�2023 (USD Million)
Table 29 Retail: Market Size, By Region, 2016�2023 (USD Million)
Table 30 Healthcare: Market Size, By Region, 2016�2023 (USD Million)
Table 31 Energy and Utilities: Market Size, By Region, 2016�2023 (USD Million)
Table 32 Manufacturing: Market Size, By Region, 2016�2023 (USD Million)
Table 33 Others: Market Size, By Region, 2016�2023 (USD Million)
Table 34 Market Size, By Region, 2016�2023 (USD Million)
Table 35 North America: Transaction Monitoring Market Size, By Component, 2016�2023 (USD Million)
Table 36 North America: Market Size, By Service, 2016�2023 (USD Million)
Table 37 North America: Market Size, By Professional Service, 2016�2023 (USD Million)
Table 38 North America: Market Size, By Application Area, 2018�2023 (USD Million)
Table 39 North America: Market Size, By Deployment Mode, 2016�2023 (USD Million)
Table 40 North America: Market Size, By Organization Size, 2016�2023 (USD Million)
Table 41 North America: Market Size, By Vertical, 2016�2023 (USD Million)
Table 42 North America: Market Size, By Country, 2016�2023 (USD Million)
Table 43 Europe: Transaction Monitoring Market Size, By Component, 2016�2023 (USD Million)
Table 44 Europe: Market Size, By Service, 2016�2023 (USD Million)
Table 45 Europe: Market Size, By Professional Service, 2016�2023 (USD Million)
Table 46 Europe: Market Size, By Application Area, 2016�2023 (USD Million)
Table 47 Europe: Market Size, By Deployment Mode, 2016�2023 (USD Million)
Table 48 Europe: Market Size, By Organization Size, 2016�2023 (USD Million)
Table 49 Europe: Market Size, By Vertical, 2016�2023 (USD Million)
Table 50 Europe: Market Size, By Country, 2016�2023 (USD Million)
Table 51 Asia Pacific: Transaction Monitoring Market Size, By Component, 2016�2023 (USD Million)
Table 52 Asia Pacific: Market Size, By Service, 2016�2023 (USD Million)
Table 53 Asia Pacific: Market Size, By Professional Service, 2016�2023 (USD Million)
Table 54 Asia Pacific: Market Size, By Application Area, 2016�2023 (USD Million)
Table 55 Asia Pacific: Market Size, By Deployment Mode, 2016�2023 (USD Million)
Table 56 Asia Pacific: Market Size, By Organization Size, 2016�2023 (USD Million)
Table 57 Asia Pacific: Market Size, By Vertical, 2016�2023 (USD Million)
Table 58 Asia Pacific: Market Size, By Country, 2016�2023 (USD Million)
Table 59 Middle East and Africa: Transaction Monitoring Market Size, By Component, 2016�2023 (USD Million)
Table 60 Middle East and Africa: Market Size, By Service, 2016�2023 (USD Million)
Table 61 Middle East and Africa: Market Size, By Professional Service, 2016�2023 (USD Million)
Table 62 Middle East and Africa: Market Size, By Application Area, 2016�2023 (USD Million)
Table 63 Middle East and Africa: Market Size, By Deployment Mode, 2016�2023 (USD Million)
Table 64 Middle East and Africa: Market Size, By Organization Size, 2016�2023 (USD Million)
Table 65 Middle East and Africa: Market Size, By Vertical, 2016�2023 (USD Million)
Table 66 Middle East and Africa: Market Size, By Sub-Region, 2016�2023 (USD Million)
Table 67 Latin America: Transaction Monitoring Market Size, By Component, 2016�2023 (USD Million)
Table 68 Latin America: Market Size, By Service, 2016�2023 (USD Million)
Table 69 Latin America: Market Size, By Professional Service, 2016�2023 (USD Million)
Table 70 Latin America: Market Size, By Application Area, 2016�2023 (USD Million)
Table 71 Latin America: Market Size, By Deployment Mode, 2016�2023 (USD Million)
Table 72 Latin America: Market Size, By Organization Size, 2016�2023 (USD Million)
Table 73 Latin America: Market Size, By Vertical, 2016�2023 (USD Million)
Table 74 Latin America: Market Size, By Country, 2016�2023 (USD Million)
Table 75 Partnerships, Agreements, and Collaborations, 2017�2018
Table 76 New Product Launches/Product Enhancements, 2016�2018
List of Figures (40 Figures)
Figure 1 Transaction Monitoring Market: Research Design
Figure 2 Market: Top-Down and Bottom-Up Approaches
Figure 3 Services Segment to Grow at A Higher CAGR During the Forecast Period
Figure 4 North America to Account for the Highest Market Share in 2018
Figure 5 Increasing Need to Comply With Regulations Driving the Demand for Transaction Monitoring Solutions and Services Across Verticals and Regions
Figure 6 Banking, Financial Services, and Insurance Vertical, and North America to Account for the Highest Market Shares in 2018
Figure 7 Banking, Financial Services, and Insurance Vertical Followed By Government and Defense Vertical to Account for the Highest Market Shares in 2018
Figure 8 Solution Segment to Account for A Higher Market Share During the Forecast Period
Figure 9 On-Premises Segment to Account for A Higher Market Share in 2018
Figure 10 Large Enterprises Segment to Account for A Higher Market Share in 2018
Figure 11 Banking, Financial Services, and Insurance Vertical Followed By Government and Defense Vertical to Account for the Highest Market Shares in 2018
Figure 12 Asia Pacific to Emerge as the Best Market for Investment in the Next 5 Years
Figure 13 Drivers, Restraints, Opportunities, and Challenges: Transaction Monitoring Market
Figure 14 Incidence of Financial Crime Over the Last 12 Months
Figure 15 Services Segment to Record A Higher Growth Rate During the Forecast Period
Figure 16 Compliance Management Segment to Record A Higher Growth Rate During the Forecast Period
Figure 17 Cloud Deployment Mode to Record A Higher Growth Rate During the Forecast Period
Figure 18 Small and Medium-Sized Enterprises Segment to Record A Higher Growth Rate During the Forecast Period
Figure 19 Retail Vertical to Record the Highest Growth Rate During the Forecast Period
Figure 20 Asia Pacific to Hold the Highest Market Share During the Forecast Period
Figure 21 North America: Transaction Monitoring Market Snapshot
Figure 22 Asia Pacific: Market Snapshot
Figure 23 Key Developments By the Leading Players in the Market for 2016�2018
Figure 24 Market (Global) Competitive Leadership Mapping, 2018
Figure 25 Geographic Revenue Mix of the Top Players in the Transaction Monitoring Market
Figure 26 FICO: Company Snapshot
Figure 27 SWOT Analysis: FICO
Figure 28 BAE Systems: Company Snapshot
Figure 29 SWOT Analysis: BAE Systems
Figure 30 Fiserv: Company Snapshot
Figure 31 SWOT Analysis: Fiserv
Figure 32 SAS: Company Snapshot
Figure 33 SWOT Analysis: SAS
Figure 34 Experian: Company Snapshot
Figure 35 SWOT Analysis: Experian
Figure 36 Nice: Company Snapshot
Figure 37 Oracle: Company Snapshot
Figure 38 FIS: Company Snapshot
Figure 39 ACI Worldwide: Company Snapshot
Figure 40 Software AG: Company Snapshot
The study involved 4 major activities to estimate the current market size of the transaction monitoring market. Exhaustive secondary research was done to collect information on the market, peer market, and parent market. The next step was to validate these findings, assumptions, and sizing with industry experts across the value chain through primary research. Both top-down and bottom-up approaches were employed to estimate the complete market size. Thereafter, the market breakup and data triangulation procedures were used to estimate the market size of the market�s segments and subsegments.
Secondary Research
In the secondary research process, various secondary sources, such as D&B Hoovers, Bloomberg Businessweek, and Dun & Bradstreet, have been referred to, for identifying and collecting information for this study. These secondary sources included annual reports; press releases and investor presentations of companies; whitepapers, certified publications, and articles by recognized authors; gold standard and silver standard websites; Anti-money Laundering (AML) and transaction monitoring technology Research and Development (R&D) organizations; regulatory bodies; and databases.
Primary Research
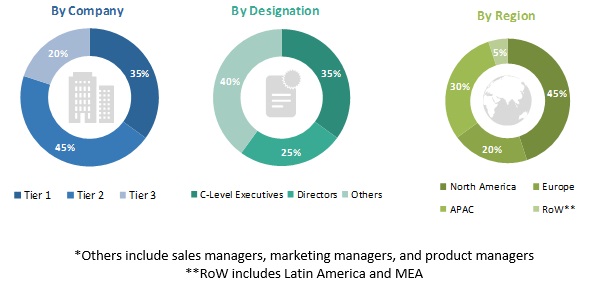
Various primary sources from both the supply and demand sides of the transaction monitoring market ecosystem were interviewed to obtain qualitative and quantitative information for this study. The primary sources from the supply side included industry experts, such as Chief Executive Officers (CEOs), Vice Presidents (VPs), marketing directors, technology and innovation directors, related key executives from various vendors who provide the transaction monitoring solution and services, associated service providers, and system integrators operating in the targeted regions. All possible parameters that affect the market covered in this research study have been accounted for, viewed in extensive detail, verified through primary research, and analyzed to get the final quantitative and qualitative data.
Following is the breakup of the primary respondents:
To know about the assumptions considered for the study, download the pdf brochure
Market Size Estimation
For making market estimates and forecasting the transaction monitoring market and the other dependent submarkets, top-down and bottom-up approaches were used. The bottom-up procedure was used to arrive at the overall market size of the global market using the revenues and offerings of the key companies in the market. The research methodology used to estimate the market size includes the following:
- The key players in the market were identified through extensive secondary research.
- The market size, in terms of value, was determined with the help of primary and secondary research processes.
All percentage shares, splits, and breakups were determined using secondary sources and verified through primary sources.
Data Triangulation
With data triangulation and validation through primary interviews, the exact value of the overall parent market size was determined and confirmed using this study. The overall market size was then used in the top-down procedure to estimate the size of other individual markets via percentage splits of the market segmentation.
Report Objectives
- To define, describe, and forecast the transaction monitoring market by component (solution and services), application area, function, deployment mode, organization size, vertical, and region
- To provide detailed information about the major factors (drivers, restraints, opportunities, and challenges) influencing the growth of the market
- To analyze the micromarkets with respect to individual growth trends, prospects, and contributions to the overall market
- To analyze market opportunities for stakeholders by identifying the high-growth segments of the market
- To forecast the market size of the segments with respect to the 5 main regions, namely, North America, Europe, Asia Pacific (APAC), Middle East and Africa (MEA), and Latin America
- To profile the key players in the market and comprehensively analyze their market size and core competencies
- To track and analyze competitive developments, such as new product launches; mergers and acquisitions; and partnerships, agreements, and collaborations, in the global market
Available Customizations
With the given market data, MarketsandMarkets offers customizations as per the company�s specific needs. The following customization options are available for the report:
Product Analysis
- Product matrix gives a detailed comparison of the product portfolio of each company
Company information
- Detailed analysis and profiling of additional market players (up to 5)


Growth opportunities and latent adjacency in Transaction Monitoring Market