Usage Based Insurance Market for ICE & Electric Vehicle, by Package (PAYD, PHYD, MHYD), Technology (OBD-II, Embedded Telematics Box, Smartphone), Vehicle (New, Old), Device Offering (BYOD, Company Provided) and Region - Global Forecast to 2028
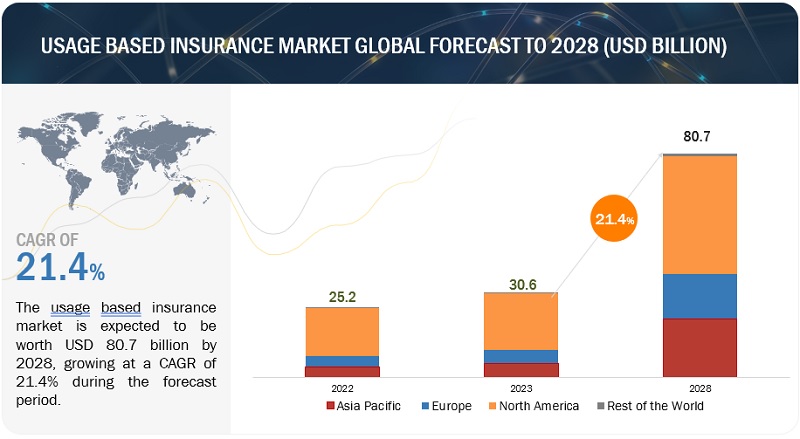
[194 Pages Report] The global usage based insurance (UBI) market is projected to grow from USD 30.6 billion in 2023 to USD 80.7 billion by 2028, at a CAGR of 21.4%. The key factors driving the usage-based insurance market are the lower premiums charged compared to traditional insurance for the automotive, the government regulations imposed on adopting telematic devices, higher sales of connected cars, and increasing sales of on-road vehicles, which drive the UBI market.
To know about the assumptions considered for the study, Request for Free Sample Report
To know about the assumptions considered for the study, download the pdf brochure
Market Dynamics
DRIVER: Increasing adoption of telematics and connected cars.
Telematics has become commonplace in the automotive industry. Car telematics enhance driving behavior and road safety, and usage-based insurance (UBI) aligns insurance premiums. The Global System for Mobile Communications, or GSMA, predicts the telematics market will grow to USD 750 billion by 2030. The telematics sector is expanding for two main reasons. First, governments are becoming eager to impose telematics regulations, which is already happening in the European Union and Russia. Second, there is a growing need for automobiles to be more connected and intelligent. According to a whitepaper by LexisNexis Risk Solutions, between 80% and 90% of those who bought auto insurance in 2017 had telematics-enabled coverage. IMS (Intelligent Mechatronic Systems) forecasts that the vehicle telematics market will expand at 23–24% CAGR over the following several years due to increased regulatory regulations and technology penetration. Additionally, because of the rising demand for linked automobile services, insurance companies may assist clients in times of need, which speeds up the claims process and saves time. Consequently, the growing acceptance of connected car services would significantly impact the market for automobile usage based insurance.
RESTRAINT: Ambiguity over regulations and legislative environments
Each state in the US has its own usage-based insurance rules and regulations. Illinois, for instance, has rules governing pay-as-you-drive (PAYD) plans but lacks specific rules governing pay-how-you-drive (PHYD). Using usage-based automobile insurance in the US is complicated by dealing with many legislations sets. Various automobile insurance requirements in each state have also hampered cross-state fleet operations. For instance, Illinois mandates carriers disclose their underwriting methodologies, whereas California restricts product pricing parameters. Due to inconsistent requirements, insurance businesses are compelled to offer novel goods and services that abide by local laws. As a result, the enterprises must increase the variety of their products. The legal framework for usage-based vehicle insurance favors lower premiums for safe driving practices. Thus, regulatory, and legislative ambiguity may limit the expansion of the usage-based vehicle insurance market.
OPPORTUNITY:Developing automotive usage-based insurance ecosystem
A robust ecosystem is developing around connected car services as usage based auto insurance demand skyrockets. Automotive insurance embedded telematics box and telematics providers, data platform and analytics firms, big data companies, and cloud service providers are some of the participants in this ecosystem. In a number of ways, insurance businesses are undergoing a digital transition. For instance, machine learning or predictive modeling technologies may replace the analytics capabilities of insurance firms. Additionally, traditional data sets comprising risk profiles based on claims history are being replaced by the increasing accessibility of real-time data collected from automobiles. The demand for linked automobile services, the expansion of automotive telematics, and mobile-based telematics will all present huge prospects for usage-based insurance market participants.
CHALLENGE: Data privacy and lack of standardization in the system
The adoption of Usage-Based Insurance (UBI) in the automotive industry brings forth notable challenges, particularly in the areas of data privacy and the lack of standardization. While UBI promises more personalized and cost-effective insurance rates based on driving behavior, it relies on the continuous collection and analysis of driver data. This has raised significant concerns about data privacy, as consumers worry about how their sensitive information is handled and safeguarded by insurance companies. Moreover, the absence of standardized metrics and assessment methodologies among UBI programs creates confusion and complexity for both insurers and policyholders. The lack of uniformity in the industry's approach to evaluating driver behavior and determining premiums makes it challenging for individuals to make informed choices and for regulators to ensure fairness. These challenges underscore the need for robust data privacy regulations and industry standards to promote transparency, consumer trust, and consistent practices in the rapidly evolving UBI landscape.
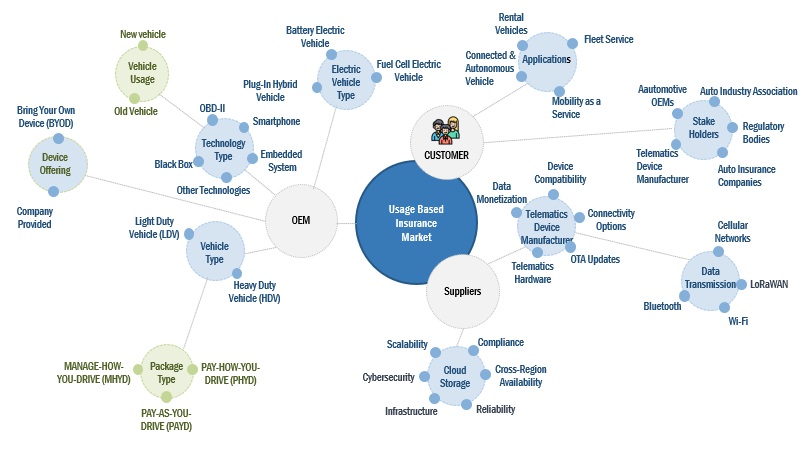
Usage-Based Insurance Market Ecosystem.
The major OEMs of the usage-based insurance market have the latest technologies, diversified portfolios, and strong distribution networks globally. The major players in the usage-based insurance market include UnipolSai Assicurazioni S.p.A (Italy), Progressive Casualty Insurance Company (US), Allstate Insurance Company (US), State Farm Automobile Mutual Insurance Company (US), Liberty Mutual Insurance Company (US), AXA (France), Assicurazioni Generali (Italy), Allianz (Germany), Webfleet Solutions (The Netherlands), Verizon (US).
The PHYD segment, by package type, holds the second largest market share.
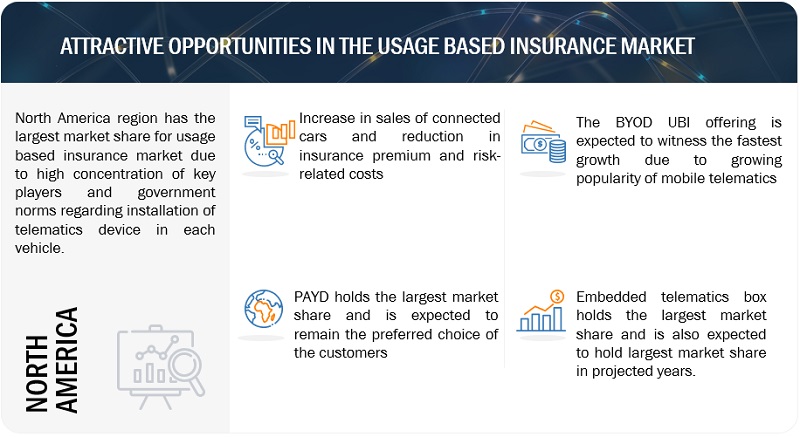
Pay How You Drive (PAYD) is a usage based insurance (UBI) program that charges drivers based on their driving distance. PAYD programs are typically more affordable than traditional insurance plans, especially for drivers who drive less than average. PAYD programs appeal to younger drivers, who are more likely to be interested in new technologies and personalized insurance products. PAYD programs can also help insurers retain customers looking for ways to save money on their insurance premiums. According to IIHS, in 2021, a total of 3,058 teenagers were dead in motor vehicle crash deaths. According to LexisNexis Risk Solutions, 17-19-year-old drivers’ casualty statistics fell by 31% in 2018 since 2011 in the UK, providing compelling evidence of the role of telematics. Telematics insurance programs reduced auto crashes involving young drivers by 20%. Growing concerns about safety among parents and developments in behavioral telematics technology have driven market growth in the US. Hence, this telematics insurance program has reduced auto crashes involving young drivers by 20%.
Overall, the PAYD programs make UBI more accessible, affordable, and attractive to consumers. PAYD programs also promote safer and more efficient driving, enabling new and innovative insurance products and services. As a result, PAYD programs are playing a key role in driving the growth of the UBI market.
The new vehicles are the fastest-growing segment in vehicle usage type for the usage based insurance market.
The value of old vehicles depreciates over the years, so the average UBI premium is less than new vehicles. According to OICA, passenger car sales increased from 56.4 million in 2021 to 57.4 million in 2022, witnessing an increment of 1.7%. However, this increase in sales statistics has increased the usage-based insurance market. The European and North American governing bodies have focused on safety due to an increase in sales of pre-installed telematics devices, sensors, and connected car technology. This increase in demand for security is driving the UBI program. Also, according to Capgemini, China and is expected to represent a connected car market share of 20.8% by 2023.
Additionally, according to Novarica's Research Council CIO Survey (2020-Q4), telematics is currently being used by 35% of large Passenger cars and commercial (P&C) vehicle insurers and 12% of mid-sized P&C insurers. Europe is the second largest usage-based insurance market for new vehicles, where the adoption of usage-based insurance is projected to increase in Germany, France, and Spain. Also, growing initiatives by the government have driven the UBI market. For instance, In December 2019, the amendments in the Motor Vehicle Act with revised penalties for violation of possession of a basic TPL policy increased the sales of auto insurance policies in India. Such revisions in the insurance sector and increased sales of connected cars are expected to positively impact the usage-based insurance market, especially for new vehicles.
Plug-in Hybrid electric vehicle holds the second largest market share in electric vehicle.
Plug-in hybrid vehicles (PHEVs) are significantly impacting the Usage-Based Insurance (UBI) market by offering a unique opportunity to monitor and assess driving behavior while promoting eco-friendly driving habits. According to IEA, global PHEV sales stood at 2.9 million in 2022 compared to 1.9 million in 2021. The adoption rate of usage-based insurance is comparatively higher in PHEVs as these vehicles are classified as premium vehicles and have higher insurance premiums. Also, according to Markets and Market analysis, the charging infrastructure market is projected to grow from USD 11.9 billion in 2022 to USD 76.9 billion due to surplus investments made for the public charging stations by the government, business, and private firms to fulfill the needs of increasing sales of EVs and PHEVs globally, which has ultimately boosted the market for pre-installed telematic devices in the PHEVs.
The governing body of the US has implemented a federal tax credit law, wherein all EV and PHEV owners get up to USD 7,500 tax credit, making them convenient and affordable to consumers. These initiatives have increased sales for PHEVs globally. Also, as the PHEVs are offered with advanced sensors and telematic devices, there is no need for external telematic device fitments. Hence, these factors have made PHEVs the second-largest market during the forecasted period.
Asia Pacific is the fastest-growing market in the usage based insurance market.
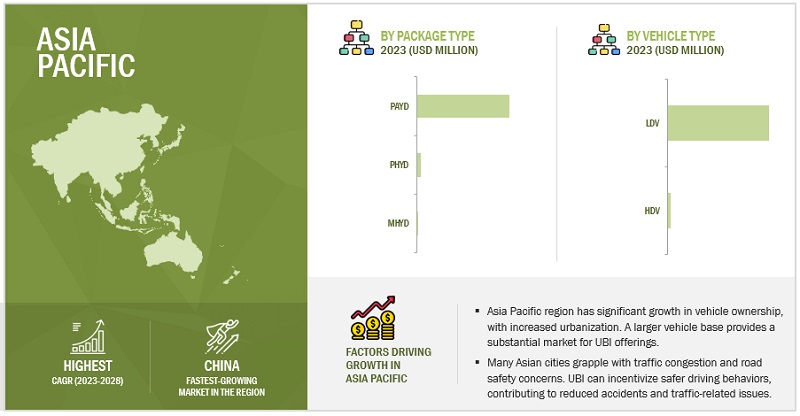
Asia Pacific is estimated to be the fastest-growing region for the usage-based insurance market. The Asia Pacific region has some of the highest vehicle ownership rates in the world. This means a large pool of potential customers for UBI products. The UBI ecosystems in many Asia Pacific nations are partnering with some service providers for the UBI program. For instance, GrabTaxi from Singapore has collaborated with AXA to provide UBI insurance for all GrabTaxi drivers. The Asia Pacific region is also one of the fastest-growing regions regarding IoT technology. In the past 4-5 years, key countries like China, Japan, and India have rapidly adopted the IoT technology used by automotive OEMS present here.
Toyota Motor Corporation (Japan), Honda Motor Company (Japan), Hyundai Motor Company (South Korea), Nissan Motor Company (Japan), Kia Corporation (South Korea), Suzuki Motor Corporation (Japan), Geely Automobile Holdings (China), SAIC Motor Corporation (China), Great Wall Motor Company (China), BYD Company (China), and Tata Motors (India) are the major key players in this region. According to OICA, the passenger cars sold in the Asia Pacific region grew by 10.6%, which was 58.3 million in 2022, which has gradually propelled the adoption of UBI program. Also, some governing bodies like China promote using connected cars to reduce traffic congestion and improve air quality. This number of initiatives to promote the adoption of connected cars and IoT technology has made the Asia Pacific region the fastest-growing market for UBI adoption.
Key Market Players
The usage based insurance market is consolidated with players such as UnipolSai Assicurazioni S.p.A (Italy), Progressive Casualty Insurance Company (US), Allstate Insurance Company (US), State Farm Automobile Mutual Insurance Company (US), and Liberty Mutual Insurance Company (US) are the key companies operating in the usage-based insurance market. These companies adopted new product launches, partnerships, and joint ventures to gain traction in the automotive insurance market.
Get online access to the report on the World's First Market Intelligence Cloud
- Easy to Download Historical Data & Forecast Numbers
- Company Analysis Dashboard for high growth potential opportunities
- Research Analyst Access for customization & queries
- Competitor Analysis with Interactive dashboard
- Latest News, Updates & Trend analysis
Request Sample Scope of the Report
Get online access to the report on the World's First Market Intelligence Cloud
- Easy to Download Historical Data & Forecast Numbers
- Company Analysis Dashboard for high growth potential opportunities
- Research Analyst Access for customization & queries
- Competitor Analysis with Interactive dashboard
- Latest News, Updates & Trend analysis
|
Report Attribute |
Details |
|
Market size available for years |
2019–2028 |
|
Base year considered |
2022 |
|
Market Growth forecast |
USD 80.7 Billion by 2028 from USD 30.6 Billion in 2023 at 21.4% CAGR |
|
Forecast period |
2023–2028 |
|
Forecast units |
Value (USD Million/Billion) |
|
Segments Covered |
By package type, by vehicle type, by vehicle age, by device offering, by electric vehicle, by technology, and by region |
|
Geographies covered |
Asia Pacific, North America, Europe, and Rest of the World. |
|
Top Players |
UnipolSai Assicurazioni S.p.A (Italy), Progressive Casualty Insurance Company (US), Allstate Insurance Company (US), State Farm Automobile Mutual Insurance Company (US), and Liberty Mutual Insurance Company (US) |
With the given market data, MarketsandMarkets offers customizations per the company’s specific needs.
The study segments the usage based insurance market:
Usage Based Insurance Market, By Package Type
- Pay-As-You-Drive (PAYD)
- Pay-How-You-Drive (PHYD)
- Manage-How-You-Drive (MHYD)
Usage Based Insurance Market, By Vehicle Type
- Light-duty Vehicle (LDV)
- Heavy-duty Vehicle (HDV)
Usage Based Insurance Market, By Vehicle Usage
- New Vehicle
- Old Vehicle
Usage Based Insurance Market, By Device Offering
- Bring Your Own Device (BYOD)
- Company Provided
Usage Based Insurance Market, By Electric Vehicle Type
- Battery Electric Vehicle (BEV)
- Plug-in Hybrid Vehicle (PHEV)
- Fuel-cell Electric Vehicle (FCEV)
Usage Based Insurance Market, By Technology Type
- OBD-II
- Smartphone
- Embedded Telematics Box
- Other Technologies
Recent Developments
- In June 2023, UnipolSai introduced BeRebel, a new car insurance policy based on the pay-per-use model. BeRebel is the first of its kind in Italy and Europe. It is a monthly, kilometer-based, fully digital car policy. It has a fixed monthly cost of about USD 10.69, which includes 200 km of travel, and an additional kilometer driven will be charged at a cost of about 2 cents/km. The Unused kilometers can be carried over to the following month. This policy is based on telematics data, which tracks the kilometers driven and the driving style.
- In February 2022, State Farm Mutual Automobile Insurance Company launched a usage-based insurance (UBI) program that uses data from a vehicle’s telematics system to track driving behavior and mileage. Drivers who exhibit safe driving habits and drive fewer miles can earn discounts on their insurance premiums. In this service, the agent provides a small device that plugs into the vehicle's diagnostic port where the device will collect data from the vehicle's telematics system and send it to State Farm.
- Progressive Corporation and Protective Insurance Corporation announced in February 2021 had signed a legally binding agreement in which Progressive agreed to buy all of Protective Insurance Corporation's outstanding Class A and Class B ordinary shares.
- In July 2021, Unipol's Linear Assicurazioni and Cambridge Mobile Telematics (CMT) launched Italy’s first try-before-you-buy auto insurance program. The program, called “Drive Smart, Pay Less,” allows drivers to test drive a car insurance policy for 14 days before they commit to buying it. The program uses CMT's DriveWell telematics platform to track the driver’s behavior. The platform measures speed, acceleration, braking, and cornering to assess the driver’s risk profile.
Frequently Asked Questions (FAQ):
What is the current size of the usage-based insurance market?
The usage based insurance market is estimated to be USD 30.6 billion in 2023 and is projected to reach USD 80.7 billion by 2028 at a CAGR of 21.4%.
What distinguishes usage-based insurance from pay-per-mile coverage?
Usage-based auto insurance keeps tabs on bad driving habits including speeding and abrupt braking. Based on these driving habits, the UBI insurance rate is modified (typically in the form of reductions).
A base fee and a per-mile rate are calculated in a conventional pay-per-mile insurance contract. For instance, a pay-per-mile plan might have a base charge of USD 30 per month and a per-mile rate of USD 0.06. As a result, if any person has travelled 500 miles in a month, then his premium would be around USD 60 (USD 30 monthly base rate multiplied by USD 0.06 per mile travelled equals USD 60).
Who are the top key players in the usage-based insurance market?
The usage based insurance market is dominated by globally established players such as UnipolSai Assicurazioni S.p.A (Italy), Progressive Casualty Insurance Company (US), Allstate Insurance Company (US), State Farm Automobile Mutual Insurance Company (US), and Liberty Mutual Insurance Company (US). These companies focus on developing adopt expansion strategies new products, , and partnerships, undertake collaborations, and mergers & acquisitions to gain traction in this growing usage-based insurance market.
What are the trends in the usage based insurance market?
Participants like automotive IOT and insurance platform providers, data platform and analytics companies, automotive embedded telematics box and telematics providers, big data companies, and cloud service providers are expected to see growth opportunities as the automotive usage-based insurance ecosystem develops.
What is the future of the usage based insurance market?
The growing popularity of UBI programs in Europe and North America has increasing penetration in vehicles and rolling out of various UBI programs is expected to drive the UBI market.
To speak to our analyst for a discussion on the above findings, click Speak to Analyst
Various secondary sources, directories, and databases have been used to identify and collect information for an extensive study of the usage based insurance market. The study involved four main activities in estimating the current size of the usage based insurance market: secondary research, validation through primary research, assumptions, and market analysis. Exhaustive secondary research was carried out to collect information on the market, such as the service types as well as the upcoming technologies and trends. The next step was to validate these findings, assumptions, and market analysis with industry experts across the value chain through primary research. The top-down approach was employed to estimate the complete market size for different segments considered in this study.
Secondary Research
In the secondary research process, various secondary sources have been used to identify and collect information useful for an extensive commercial study of the usage-based insurance market. Secondary sources include company annual reports/presentations, press releases, industry association publications [such as publications on vehicle sales, EEA (European Energy Agency), IEA (International Energy Agency), ACEA (European Automobile Manufacturers Association), T&E (Transport and Environment), country-level automotive associations and trade organizations, and the US Department of Transportation (DOT)], UBI related magazine articles, directories, technical handbooks, World Economic Outlook, trade websites, and technical articles. Additionally, secondary research has been carried out to understand the average insurance premiums by vehicle type, historic sales of new vehicles, and vehicle parc.
Primary Research
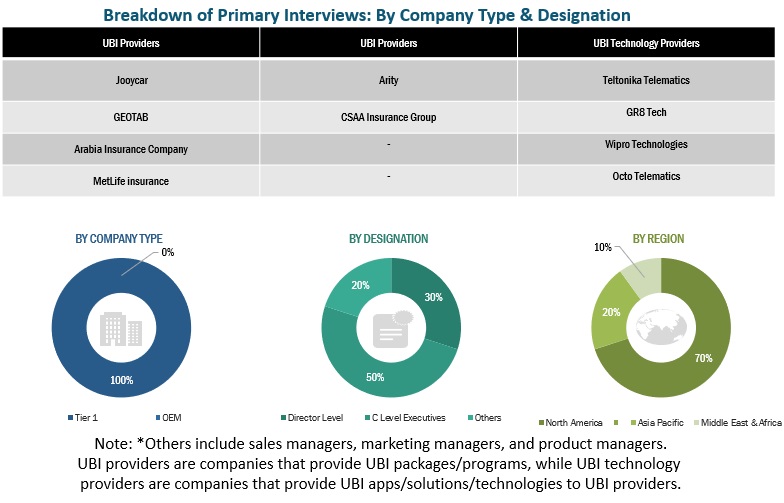
In the primary research process, various primary sources from both the supply and demand sides were interviewed to obtain qualitative and quantitative information on the market. The primary sources from the supply side included industry experts such as CXOs, vice presidents, directors from business development, marketing, product development/innovation teams, and related key executives from various key companies. Various system integrators, industry associations, independent consultants/industry veterans, and key opinion leaders were also interviewed.
Primary interviews have been conducted to gather insights such as ICE vehicle and electric vehicle sales forecast, UBI market forecast, UBI penetration, future technology trends, and upcoming technologies in the UBI industry. Data triangulation was then done with the information gathered from secondary research. Stakeholders from the demand as well as supply side have been interviewed to understand their views on the aforementioned points.
Primary interviews have been conducted with market experts from UBI providers and UBI technology providers across four major regions, namely, North America, Europe, Asia Pacific, and the Rest of the World. A similar percentage of primary interviews have been conducted with the UBI providers and UBI technology providers, respectively. Primary data has been collected through questionnaires, emails, and telephonic interviews. In the canvassing of primaries, we have strived to cover various departments within organizations, such as sales and operations, to provide a holistic viewpoint in our report.
After interacting with industry experts, we have also conducted brief sessions with highly experienced independent consultants to reinforce the findings from our primaries. This, along with the in-house subject matter experts’ opinions, has led us to the findings as described in the remainder of this report.
To know about the assumptions considered for the study, download the pdf brochure
Market Size Estimation
A detailed market estimation approach was followed to estimate and validate the value of the usage-based insurance market and other dependent submarkets, as mentioned below:
- Key players in the usage-based insurance market were identified through secondary research, and their global market shares were determined through primary and secondary research.
- The research methodology included the study of annual and quarterly financial reports and regulatory filings of major market players (public) as well as interviews with industry experts for detailed market insights.
- All industry-level penetration rates, percentage shares, splits, and breakdowns for the usage-based insurance were determined using secondary sources and verified through primary sources.
- All key macro indicators affecting the revenue growth of the market segments and sub-segments have been accounted for, viewed in extensive detail, verified through primary research, and analyzed to get the validated and verified quantitative and qualitative data.
- The gathered market data was consolidated and added with detailed inputs, analyzed, and presented in this report.
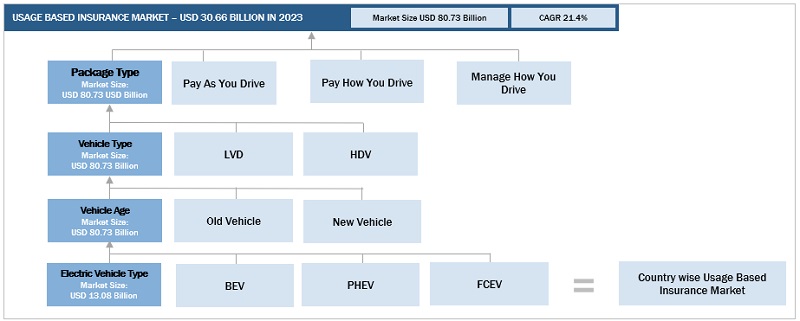
Usage-Based Insurance Market: Bottom-Up Approach
Usage-Based Insurance Market: Top-Down Approach
- The top-down approach has been used to estimate and validate the size of the usage-based insurance market, by technology type. The market share of each technology was derived at regional level through secondary research & insights from industry experts. Further, UBI market was segmented based on market share for each technology at regional level. The similar approach is used in device offering type.
Top-Down Approach Usage-Based Insurance Market At Regional Level

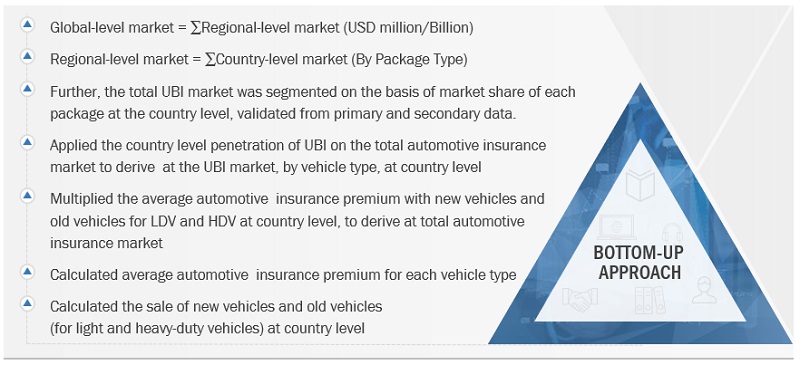
Bottom-Up Approach Usage-Based Insurance Market At Regional Level
Data Triangulation
After arriving at the overall market size—using the market size estimation processes as explained above—the market was split into several segments and sub-segments. To complete the overall market engineering process and arrive at the exact statistics of each market segment and sub segment, data triangulation and market breakdown procedures were employed, wherever applicable. The data was triangulated by studying various factors and trends.
Market Definition
As per the National Association of Insurance Commissioners (NAIC), usage based Insurance (UBI) is a type of auto insurance that tracks mileage and driving behaviour. UBI is often powered by in-vehicle telecommunication devices (telematics)—technology that is available in a vehicle and is self-installed using a plug-in device or already integrated into the original equipment installed by car manufacturers. It can also be available through mobile applications. The basic idea of UBI is that a driver's behavior is monitored in real time, allowing insurers to align driving behavior more closely with premium rates.
Stakeholders
- Automotive OEMs
- Manufacturers of telematics devices
- Technology investors
- Service providers
- National and Regional Environmental Regulatory Agencies or Organizations
- Automotive usage Insurance company
- Technology standards organization, forum, alliances, and associations
- Agents and brokers of usage usage-based insurance market
- Regional Automobile Associations
- Telematics device suppliers for OEMs and Automotive Tier
- Traders, distributors, and suppliers of telematics components and raw material suppliers
- Organized and unorganized aftermarket suppliers of telematics devices
Report Objectives
-
To define, describe, and forecast the usage-based insurance market, in terms of value
(USD million), based on the following segments:- By Package type [pay-as-you-drive (PAYD), pay-how-you-drive (PHYD), and manage-how-you-drive (MHYD)]
- By Technology type [OBD-II, smartphone, embedded telematics box, and other technologies]
- By Vehicle type [light-duty vehicles and heavy-duty vehicles]
- By Vehicle age [new vehicles and old vehicles]
- By Device offering [bring your own device (BYOD) and company provided]
- By Electric and Hybrid Vehicle [battery electric vehicle (BEV), plug-in hybrid vehicle (PHEV) and fuel-cell electric vehicle (FCEV)]
- By Region (Asia Pacific, Europe, North America, and RoW)
- To understand the market dynamics (drivers, restraints, opportunities, and challenges) and conduct patent analysis, case study analysis, supply chain analysis, regulatory analysis, and ecosystem analysis.
- To understand the dynamics of the market players and distinguish them into stars, emerging leaders, pervasive players, and participants according to their product portfolio strength and business strategies.
- To strategically analyze markets with respect to individual growth trends, prospects, and contributions to the total market.
- To understand the dynamics of competitors and distinguish them into stars, emerging leaders, pervasive players, and participants per the strength of their product portfolio and business strategies.
- To analyze recent developments, such as agreements/partnerships/collaborations, joint ventures/mergers and acquisitions, geographic expansions, and product developments of key players in the usage based insurance market.
- To identify innovations and patents by assessing the intellectual property (IP) landscape for any particular product or technology.
- To understand the general impact of the recession on the usage-based insurance market and how it will affect the overall economy of the country or region.
Available Customizations
Along with the market data, MarketsandMarkets offers customizations in accordance with company-specific needs.
The following customization options are available for the report:
Usage Based Insurance Market, By Vehicle Type, By Country
- Light-duty vehicle
- Heavy-duty vehicle
Note: This will be further segmented by region.
Usage Based Insurance Market, By Vehicle Type, By Vehicle Age, By Region
- Asia Pacific
- Europe
- North America
- RoW
Usage Based Insurance Market, By Off-Highway Vehicle Type, By Region
- Construction
- Agriculture
Note: This will be further segmented by region.


 Generating Response ...


Growth opportunities and latent adjacency in Usage Based Insurance Market
We are reviewing different Usage-Based Insurance scenarios, as part of the strategy for this topic we are looking for a strategic partner to help us understand how to introduce UBI solutions in the Mexican market. We would like to know and understand the needs of the Mexican market to enter with UBI solutions, here are a couple of points that we would like to know: 1. Evaluate the Mexican UBI market opportunity 2. Understand the Mexican personal auto insurance market 3. Understand Mexican personal line insurance companiesí key needs and challenges 4. Identify opportunities for telematics in the personal line market 5. Understand the Mexican commercial auto insurance market 6. Understand Mexican commercial line insurance companiesí key needs and challenges 7. Identify opportunities for telematics in the commercial line market
Usage-Based Insurance Market report was published and updated early last month and is the most updated market report available with us on the Usage-Based Insurance Market. The report breaks-down the market size and growth forecast for ICE vehicles and for Battery Electric Vehicle (BEV), Plug-in Hybrid Vehicle (PHEV) and Fuel-cell Electric Vehicle (FCEV), further broken down by 1) By Package Type: Pay-As-You-Drive (PAYD), Pay-How-You-Drive (PHYD), Manage-How-You-Drive (MHYD) 2) By Technology: OBD-II, Smartphone, Black Box, Embedded, Other technologies 3) By Vehicle Type: Light-duty Vehicle (LDV), Heavy-duty Vehicle (HDV) 4 By Vehicle Age: New Vehicle, Old Vehicle 5) By Device Offering: Bring Your Own Device (BYOD), Company Provided Market share analysis of top players, including their business and service portfolio, last three year financials, contracts awarded, organic and in-organic growth strategies, SWOT analysis, key investments, and MnM view point of each company, is covered for all global and regional players.