User Activity Monitoring Market by Component, Technology Type (Behavior Analytics, Log Management), Application Area (System, Application, File, Network Monitoring), Deployment Mode, Organization Size, Vertical, and Region - Global Forecast to 2023


[159 Pages Report] The UAM market has passed through several phases, with more than 20 years of evolutionary stages. UAM solutions monitor and record the activities of the internal and external users of devices, networks, and other IT resources in an organization. The increasing need of the organizations to gain control over their employees and third-party vendors is expected to be encouraging them to deploy UAM solutions. UAM solutions constantly monitor users and record their activities to detect suspicious activities. The solutions match the user�s activity patters with the existing patterns to identify malicious actions and alert organizations� IT staff to mitigate the potential security risks.
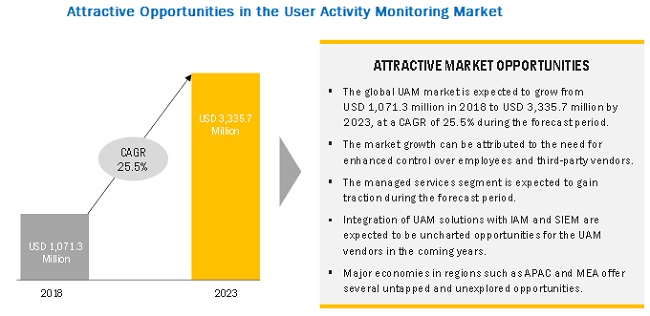
The global User Activity Monitoring market (UAM) size is expected to grow from USD 1,071.3 million in 2018 to USD 3,335.7 million by 2023, at a Compound Annual Growth Rate (CAGR) of 25.5% during the forecast period.
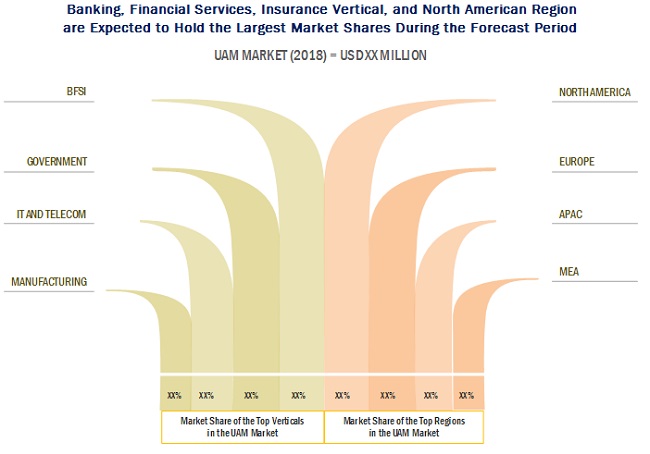
�By vertical, the BFSI vertical is expected to dominate the market with the largest market share during the forecast period.�
The BFSI vertical comprises commercial banks, insurance companies, mutual funds firms, cooperatives, non-banking financial companies, pension funds, and other smaller financial institutions. This vertical is an early adopter of cutting-edge UAM solutions, due to the regular transmission of highly sensitive financial data over emails. The BFSI vertical faces various challenges, such as stringent regulatory and security requirements and the need for superior customer service delivery. Additionally, this vertical is always on the lookout for security products and services that protect its critical assets from harmful employee actions, such as frauds, IP thefts, and inappropriate behavior.
�By component, the services segment to grow at a higher cagr during the forecast period.�
The growth in the UAM market can be attributed to the increase in the deployment of cloud-based UAM solutions in regions, such as APAC and MEA. The services segment is expected to grow at a higher CAGR during the forecast period, compared to the solution segment.
�By vertical, the government and defense vertical is expected to grow at the fastest rate during the forecast period.�
This vertical includes all the government and defense organizations. Security threats in this vertical are increasing at an alarming rate. Moreover, this vertical is targeted to extract highly confidential and sensitive data of critical sectors, such as governments, prime contractors, and suppliers. Additionally, the governments across various regions are witnessing reduced employee productivity due to the result of internet misuse. Due to such reasons, organizations are deploying UAM solutions for enhancing their productivity. The advanced UAM solutions provide in-depth information about applications� usage, network activities, email/webmail/chat/Instant Messaging (IM) scripts, document tracking, and file transfers. Furthermore, these UAM solutions help the government and defense organizations in conducting incident responses, monitoring high-risk insiders, and measuring employees� productivity.
�By technology type, APAC is expected to witness the highest growth rate.�
The region is experiencing rapid digitization, and the protection of digital assets has become the prime objective of organizations in the region.
�North America is expected to be the top region in terms of market size during the forecast period.�
North America is the region of innovative technology adopters and houses a huge number of UAM vendors, which are expected to be the reasons for the highest growth of the market.
Market Dynamics
Driver: Increasing need among organizations to optimize employee productivity
The UAM solution plays a crucial role in optimizing organizations� efficiency by enhancing employee productivity. The single sign-on solution helps employees use multiple business applications. It identifies employees and sanctions access securely. Integrated UAM products provide a single console administration facility, which can help gain higher visibility and comprehensive coverage in organizations.
Additionally, UAM solutions reduce security risks and provide a robust security mechanism that enables organizations to mitigate potential security threats and data loss. These solutions help users access information through mobile devices; with this facility, users can work from a remote location. These solutions also provide a better security experience and are becoming popular in SMEs and large enterprises across a variety of verticals. UAM solutions deliver robust security to the credentials of superusers and safeguard organizations� sensitive data from unauthorized access and cyber-attacks. Due to the cost-saving and employee productivity enhancement features, the UAM solution is being increasingly deployed in organizations. Therefore, the UAM market is expected to witness significant growth in recent years.
Restraint: High cost of innovation for developing robust UAM solutions
Insider attacks and security breaches are continuously growing, and organizations are increasing their IT security investments to ensure protection against advanced threats, zero-day malware, Trojans, and other targeted threats. Investments are becoming a matter of concern for many organizations, including SMEs. Furthermore, the development cost for robust security solutions is high, which, in turn, leads to increased implementation costs for customers. Budget constraints are becoming a significant barrier to the growth of the UAM market. The cost factor is proving a hindrance to carry out IT security operations in organizations effectively.
Additionally, security investments in SMEs are not sufficient to fulfill every security need. Therefore, organizations have to understand which information assets are the most important to curb the evolving security threats. The security investments by organizations in developing economies, such as MEA and Latin America, are lower as compared to the other regions, and these investments should be increased for better protection from emerging cyber threats.
Opportunity: Integration of UAM solutions with IAM and SIEM
The integration of UAM with Identity and Access Management (IAM) and SIEM improves the security posture of organizations by providing the capabilities of these solutions in a unified way. The UAM solution helps enterprises manage security threats and stringent regulatory compliances. Organizations can use integrated UAM solutions as a strategic initiative to achieve robust protection from internal and external threats. This would help companies increase their focus on monitoring users and the resources accessed by them. IAM technology provides access and privilege policy management but not UAM. However, the integration of UAM with IAM delivers the robust security capabilities of UAM to IAM users for protecting them against potential security threats. Therefore, many vendors are forming partnerships with other leading companies to provide integrated UAM solutions with IAM and SIEM capabilities, for delivering comprehensive security to global organizations.
Challenge: Managing user privacy
The UAM solution intensely monitors all user activities and provides comprehensive reports on the same. This in-depth monitoring can often impact user privacy. It becomes very challenging for organizations to implement UAM and preserve the confidentiality of users simultaneously. Therefore, UAM vendors are focusing on developing solutions that can achieve a balance between robust security and privacy preservation. They are aiming to develop a policy-based UAM solution that provides secure access to the captured activities and offers notifications about the recording policies to users. To detect insider threats and maintain privacy, the solution should monitor the pattern of user activities instead of inspecting the content. Such solutions would enable organizations to manage employee privacy and maintain robust security. Organizations can overcome this challenge by trying to avoid the collection of sensitive employee data, such as bank details and data at the HR portal.
Get online access to the report on the World's First Market Intelligence Cloud
- Easy to Download Historical Data & Forecast Numbers
- Company Analysis Dashboard for high growth potential opportunities
- Research Analyst Access for customization & queries
- Competitor Analysis with Interactive dashboard
- Latest News, Updates & Trend analysis
Request Sample Scope of the Report
Get online access to the report on the World's First Market Intelligence Cloud
- Easy to Download Historical Data & Forecast Numbers
- Company Analysis Dashboard for high growth potential opportunities
- Research Analyst Access for customization & queries
- Competitor Analysis with Interactive dashboard
- Latest News, Updates & Trend analysis

|
Report Metric |
Details |
|
Market size available for years |
2016�2023 |
|
Base year considered |
2017 |
|
Forecast period |
2018�2023 |
|
Forecast units |
USD million |
|
Segments covered |
Component, Technology types, Installation types, Application area, Deployment modes, Organization sizes, Verticals, and Region |
|
Geographies covered |
North America, Europe, Asia Pacific (APAC), the Middle East and Africa (MEA) and Latin America |
|
Companies covered |
Micro Focus (UK), Splunk (US), Forcepoint (US), Imperva (US), ManageEngine (US), CyberArk (US), Rapid7 (US), Centrify (US), SolarWinds (US), Securonix(US), NetWrix (US), Digital Guardian (US), Birch Grove Software (US), LogRhythm (US), Sumo Logic (US), Balabit (Hungary), ObserveIT (US), Dtex Systems (US), WALLIX (France), Teramind (US), Veriato (US), SysKit (Croatia), Ekran System (US), NetFort (Ireland), and TSFactory (US) |
The research report segments the User Activity Monitoring market into the following submarkets:
Market by Component:- Solution
- Services
- Professional Services
- Consulting Services
- Training and Education
- Support and Maintenance
- Managed Services
- Professional Services
User Activity Monitoring Market by Technology Type:
- Behavior Analytics
- Log management
- Auditing and reporting
- Others (visual forensics and user activity alerting)
Market by Installation Type:
- Proxy-based
- Agent-based
User Activity Monitoring Market by Application Area:
- System monitoring
- Application Monitoring
- File monitoring
- Network monitoring
- Database monitoring
Market by Deployment Mode:
- On-premises
- Cloud
User Activity Monitoring Market by Organization Size:
- Small and Medium-sized Enterprises
- Large Enterprises
Market by Vertical:
- Government and Defense
- Banking, Financial Services, and Insurance (BFSI)
- IT and Telecom
- Healthcare
- Retail
- Manufacturing
- Energy and Utilities
- Others (Education, Media and Entertainment, and Travel and Transportation)
User Activity Monitoring Market by Region:
- North America
- Europe
Asia Pacific (APAC)
- The Middle East and Africa (MEA)
- Latin America
Key Market Players
ObserveIT (US), Teramind (US), Veriato (US), Sumo Logic (US), Balabit (Hungary)
Recent Developments
- In March 2018, CyberArk acquired certain assets of Vaultive, a privately held cloud security provider. The acquisition helped CyberArk deliver better visibility and control over privileged users and employees.
- In February 2018, Dtex Systems enhanced its Advanced User Behavior Intelligence Platform with capabilities to meet the need for purpose-built, scalable insider threat solutions that work seamlessly within modern security environments.
- In February 2018, WALLIX launched the Discovery tool to enable the analysis of vulnerabilities caused by unused or unknown privileged accounts, and to help ensure compliance and security, and prevent data breaches.
- In January 2018, Sumo Logic acquired FactorChain, a security investigation platform provider. The acquisition helped Sumo Logic boost its threat investigation capabilities.
Critical questions the report answers:
- What are the upcoming trends for the UAM market?
- Which segment in the UAM market provides the most opportunity for growth?
- Who are the leading vendors operating in the market?
- What are the opportunities for new market entrants in the UAM market?
To speak to our analyst for a discussion on the above findings, click Speak to Analyst
Table of Contents
1 Introduction (Page No. - 18)
1.1 Objectives of the Study
1.2 Market Definition
1.3 Market Scope
1.4 Years Considered for the Study
1.5 Currency
1.6 Stakeholders
2 Research Methodology (Page No. - 21)
2.1 Research Data
2.1.1 Secondary Data
2.1.2 Primary Data
2.1.2.1 Breakdown of Primaries
2.1.2.2 Key Industry Insights
2.2 Market Size Estimation
2.2.1 Bottom-Up Approach
2.2.2 Top-Down Approach
2.3 Research Assumptions and Limitations
2.3.1 Limitations
3 Executive Summary (Page No. - 27)
4 Premium Insights (Page No. - 31)
4.1 Attractive Market Opportunities in the Market
4.2 Market By Component, 2018�2023
4.3 Market By Service, 2018�2023
4.4 Market By Vertical and Region
5 User Activity Monitoring Market Overview and Industry Trends (Page No. - 33)
5.1 Introduction
5.2 Market Dynamics
5.2.1 Drivers
5.2.1.1 Need for Enhanced Control Over Employees and Third-Party Vendors in Enterprises
5.2.1.2 Increasing Need Among Organizations to Optimize the Employee Productivity
5.2.1.3 Lack of Experts in the Cybersecurity Profession
5.2.1.4 Stringent Regulatory Compliances and Adoption of the Best Practices
5.2.2 Restraints
5.2.2.1 High Cost of Innovation for Developing Robust Solutions
5.2.3 Opportunities
5.2.3.1 Integration of Solutions With IAM and SIEM
5.2.4 Challenges
5.2.4.1 Managing the User Privacy
5.3 Functioning of User Activity Monitoring Tools
5.4 Innovation Spotlight
6 User Activity Monitoring Market, By Component (Page No. - 38)
6.1 Introduction
6.2 Solution
6.3 Services
6.3.1 Managed Services
6.3.2 Professional Services
6.3.2.1 Consulting Services
6.3.2.2 Training and Education
6.3.2.3 Support and Maintenance
7 User Activity Monitoring Market, By Technology Type (Page No. - 46)
7.1 Introduction
7.2 Behavior Analytics
7.3 Log Management
7.4 Auditing and Reporting
7.5 Others
8 User Activity Monitoring Market By Installation Type (Page No. - 51)
8.1 Introduction
8.2 Proxy-Based
8.3 Agent-Based
9 Market By Application Area (Page No. - 52)
9.1 Introduction
9.2 System Monitoring
9.3 Application Monitoring
9.4 File Monitoring
9.5 Network Monitoring
9.6 Database Monitoring
10 User Activity Monitoring Market, By Deployment Mode (Page No. - 58)
10.1 Introduction
10.2 Cloud
10.3 On-Premises
11 Market By Organization Size (Page No. - 62)
11.1 Introduction
11.2 Small and Medium-Sized Enterprises
11.3 Large Enterprises
12 User Activity Monitoring Market, By Vertical (Page No. - 66)
12.1 Introduction
12.2 Government and Defense
12.3 Banking, Financial Services, and Insurance
12.4 It and Telecom
12.5 Healthcare
12.6 Retail
12.7 Manufacturing
12.8 Energy and Utilities
12.9 Others
13 User Activity Monitoring Market, By Region (Page No. - 74)
13.1 Introduction
13.2 North America
13.3 Europe
13.4 Asia Pacific
13.5 Middle East and Africa
13.6 Latin America
14 Competitive Landscape (Page No. - 96)
14.1 Overview
14.2 Market Ranking
14.3 Competitive Scenario
14.3.1 New Product Launches and Product Upgradations
14.3.2 Partnerships, Collaborations, and Agreements
14.3.3 Acquisitions
15 Company Profiles (Page No. - 101)
(Business Overview, Products and Services Offered, Recent Developments, SWOT Analysis, MnM View)*
15.1 Introduction
15.2 Micro Focus
15.3 Splunk
15.4 Rapid7
15.5 Forcepoint
15.6 Digital Guardian
15.7 Solarwinds
15.8 Securonix
15.9 Imperva
15.10 Logrhythm
15.11 Sumo Logic
15.12 Balabit
15.13 Observeit
15.14 Dtex Systems
15.15 Wallix
15.16 Teramind
15.17 Veriato
15.18 Syskit
15.19 Ekran System
15.20 Netfort
15.21 Manageengine
15.22 Cyberark
15.23 Centrify
15.24 Netwrix
15.25 Birch Grove Software
15.26 Tsfactory
*Details on Business Overview, Products and Services Offered, Recent Developments, SWOT Analysis, MnM View Might Not Be Captured in Case of Unlisted Companies.
16 Appendix (Page No. - 147)
16.1 Other Developments
16.2 Discussion Guide
16.3 Knowledge Store: Marketsandmarkets� Subscription Portal
16.4 Introducing RT: Real-Time Market Intelligence
16.5 Available Customizations
16.6 Related Reports
16.7 Author Details
List of Tables (83 Tables)
Table 1 User Activity Monitoring Market Size and Growth Rate, 2016�2023 (USD Million, Y-O-Y %)
Table 2 Innovation Spotlight: Latest User Activity Monitoring Innovations
Table 3 Market Size, By Component, 2016�2023 (USD Million)
Table 4 Solution: Market Size By Region, 2016�2023 (USD Million)
Table 5 Services: Market Size By Region, 2016�2023 (USD Million)
Table 6 Services: Market Size By Type, 2016�2023 (USD Million)
Table 7 Managed Services: Market Size By Region, 2016�2023 (USD Million)
Table 8 Professional Services: Market Size By Type, 2016�2023 (USD Million)
Table 9 Professional Services: Market Size By Region, 2016�2023 (USD Million)
Table 10 Consulting Services Market Size, By Region, 2016�2023 (USD Million)
Table 11 Training and Education Market Size, By Region, 2016�2023 (USD Million)
Table 12 Support and Maintenance Market Size, By Region, 2016�2023 (USD Million)
Table 13 User Activity Monitoring Market Size, By Technology Type, 2016�2023 (USD Million)
Table 14 Behavior Analytics: Market Size By Region, 2016�2023 (USD Million)
Table 15 Log Management: Market Size By Region, 2016�2023 (USD Million)
Table 16 Auditing and Reporting: Market Size By Region, 2016�2023 (USD Million)
Table 17 Others: Market Size By Region, 2016�2023 (USD Million)
Table 18 Market Size, By Application Area, 2016�2023 (USD Million)
Table 19 System Monitoring: Market Size By Region, 2016�2023 (USD Million)
Table 20 Application Monitoring: Market Size By Region, 2016�2023 (USD Million)
Table 21 File Monitoring: Market Size By Region, 2016�2023 (USD Million)
Table 22 Network Monitoring: Market Size By Region, 2016�2023 (USD Million)
Table 23 Database Monitoring: Market Size By Region, 2016�2023 (USD Million)
Table 24 User Activity Monitoring Market Size, By Deployment Mode, 2016�2023 (USD Million)
Table 25 Cloud: Market Size By Region, 2016�2023 (USD Million)
Table 26 On-Premises: Market Size By Region, 2016�2023 (USD Million)
Table 27 Market Size, By Organization Size, 2016�2023 (USD Million)
Table 28 Small and Medium-Sized Enterprises: Market Size By Region, 2016�2023 (USD Million)
Table 29 Large Enterprises: Market Size By Region, 2016�2023 (USD Million)
Table 30 Market Size, By Vertical, 2016�2023 (USD Million)
Table 31 Government and Defense: Market Size By Region, 2016�2023 (USD Million)
Table 32 Banking, Financial Services, and Insurance: Market Size By Region, 2016�2023 (USD Million)
Table 33 It and Telecom: Market Size By Region, 2016�2023 (USD Million)
Table 34 Healthcare: Market Size By Region, 2016�2023 (USD Million)
Table 35 Retail: Market Size By Region, 2016�2023 (USD Million)
Table 36 Manufacturing: Market Size By Region, 2016�2023 (USD Million)
Table 37 Energy and Utilities: Market Size By Region, 2016�2023 (USD Million)
Table 38 Others: Market Size By Region, 2016�2023 (USD Million)
Table 39 User Activity Monitoring Market Size, By Region, 2016�2023 (USD Million)
Table 40 North America: Market Size By Component, 2016�2023 (USD Million)
Table 41 North America: Market Size By Service, 2016�2023 (USD Million)
Table 42 North America: Market Size By Professional Service, 2016�2023 (USD Million)
Table 43 North America: Market Size By Technology Type, 2016�2023 (USD Million)
Table 44 North America: Market Size By Application Area, 2016�2023 (USD Million)
Table 45 North America: Market Size By Deployment Mode, 2016�2023 (USD Million)
Table 46 North America: Market Size By Organization Size, 2016�2023 (USD Million)
Table 47 North America: Market Size By Vertical, 2016�2023 (USD Million)
Table 48 Europe: User Activity Monitoring Market Size, By Component, 2016�2023 (USD Million)
Table 49 Europe: Market Size By Service, 2016�2023 (USD Million)
Table 50 Europe: Market Size By Professional Service, 2016�2023 (USD Million)
Table 51 Europe: Market Size By Technology Type, 2016�2023 (USD Million)
Table 52 Europe: Market Size By Application Area, 2016�2023 (USD Million)
Table 53 Europe: Market Size By Deployment Mode, 2016�2023 (USD Million)
Table 54 Europe: Market Size By Organization Size, 2016�2023 (USD Million)
Table 55 Europe: Market Size By Vertical, 2016�2023 (USD Million)
Table 56 Asia Pacific: User Activity Monitoring Market Size, By Component, 2016�2023 (USD Million)
Table 57 Asia Pacific: Market Size By Service, 2016�2023 (USD Million)
Table 58 Asia Pacific: Market Size By Professional Service, 2016�2023 (USD Million)
Table 59 Asia Pacific: Market Size By Technology Type, 2016�2023 (USD Million)
Table 60 Asia Pacific: Market Size By Application Area, 2016�2023 (USD Million)
Table 61 Asia Pacific: Market Size By Deployment Mode, 2016�2023 (USD Million)
Table 62 Asia Pacific: Market Size By Organization Size, 2016�2023 (USD Million)
Table 63 Asia Pacific: Market Size By Vertical, 2016�2023 (USD Million)
Table 64 Middle East and Africa: User Activity Monitoring Market Size, By Component, 2016�2023 (USD Million)
Table 65 Middle East and Africa: Market Size By Service, 2016�2023 (USD Million)
Table 66 Middle East and Africa: Market Size By Professional Service, 2016�2023 (USD Million)
Table 67 Middle East and Africa: Market Size By Technology Type, 2016�2023 (USD Million)
Table 68 Middle East and Africa: Market Size By Application Area, 2016�2023 (USD Million)
Table 69 Middle East and Africa: Market Size By Deployment Mode, 2016�2023 (USD Million)
Table 70 Middle East and Africa: Market Size By Organization Size, 2016�2023 (USD Million)
Table 71 Middle East and Africa: Market Size By Vertical, 2016�2023 (USD Million)
Table 72 Latin America: User Activity Monitoring Market Size, By Component, 2016�2023 (USD Million)
Table 73 Latin America: Market Size By Service, 2016�2023 (USD Million)
Table 74 Latin America: Market Size By Professional Service, 2016�2023 (USD Million)
Table 75 Latin America: Market Size By Technology Type, 2016�2023 (USD Million)
Table 76 Latin America: Market Size By Application Area, 2016�2023 (USD Million)
Table 77 Latin America: Market Size By Deployment Mode, 2016�2023 (USD Million)
Table 78 Latin America: Market Size By Organization Size, 2016�2023 (USD Million)
Table 79 Latin America: Market Size By Vertical, 2016�2023 (USD Million)
Table 80 User Activity Monitoring Market: Ranking Analysis
Table 81 New Product Launches and Product Upgradations, 2017�2018
Table 82 Partnerships, Collaborations, and Agreements, 2017
Table 83 Acquisitions, 2016-2018
List of Figures (40 Figures)
Figure 1 Global User Activity Monitoring Market Segmentation
Figure 2 Global Market: Research Design
Figure 3 Breakdown of Primary Interviews: By Company, Designation, and Region
Figure 4 Data Triangulation
Figure 5 Market Size Estimation Methodology: Bottom-Up Approach
Figure 6 Market Size Estimation Methodology: Top-Down Approach
Figure 7 User Activity Monitoring Market Share, By Technology Type, 2018�2023
Figure 8 Application Monitoring Segment is Expected to Grow at the Highest CAGR During the Forecast Period
Figure 9 Managed Services Segment is Expected to Grow at A Higher CAGR During the Forecast Period
Figure 10 Banking, Financial Services, and Insurance Vertical is Expected to Have the Largest Market Size in 2018
Figure 11 North America is Estimated to Have the Largest Market Share in 2018
Figure 12 Need for Enhanced Control Over Employees and Third-Party Vendors is Expected to Boost the Growth of the User Activity Monitoring Market
Figure 13 Services Segment is Expected to Grow at A Higher CAGR During the Forecast Period
Figure 14 Managed Services Segment is Expected to Grow at A Higher CAGR During the Forecast Period
Figure 15 Banking, Financial Services, and Insurance Vertical, and North American Region are Expected to Hold the Largest Market Shares During the Forecast Period
Figure 16 Market: Drivers, Restraints, Opportunities, and Challenges
Figure 17 User Activity Monitoring Market: Major Cause of Data Breaches During 2016�2017
Figure 18 Functioning of the User Activity Monitoring Solution
Figure 19 Services Segment to Grow at A Higher CAGR During the Forecast Period
Figure 20 Auditing and Reporting Technology Type is Estimated to Grow at the Highest CAGR During the Forecast Period
Figure 21 Application Monitoring Application Area is Expected to Grow at the Highest CAGR During the Forecast Period
Figure 22 Cloud-Based Deployment Mode is Expected to Grow at A Higher CAGR During the Forecast Period
Figure 23 Small and Medium-Sized Enterprises Segment is Expected to Grow at A Higher CAGR During the Forecast Period
Figure 24 Government and Defense Vertical is Expected to Grow at the Highest CAGR During the Forecast Period
Figure 25 North America is Estimated to Hold the Largest Market Size During the Forecast Period
Figure 26 North America: Market Snapshot
Figure 27 Asia Pacific: Market Snapshot
Figure 28 Key Market Evaluation Framework
Figure 29 Key Developments By the Leading Companies in the User Activity Monitoring Market, 2015�2017
Figure 30 Geographic Revenue Mix of the Top 2 Market Players
Figure 31 Micro Focus: Company Snapshot
Figure 32 Micro Focus: SWOT Analysis
Figure 33 Splunk: Company Snapshot
Figure 34 Splunk: SWOT Analysis
Figure 35 Rapid7: Company Snapshot
Figure 36 Rapid7: SWOT Analysis
Figure 37 Forcepoint: SWOT Analysis
Figure 38 Digital Guardian: SWOT Analysis
Figure 39 Imperva: Company Snapshot
Figure 40 Wallix: Company Snapshot


Growth opportunities and latent adjacency in User Activity Monitoring Market