Virtualization Security Market by Component (Solution (Virtual Infrastructure & Lifecycle Protection) & Services (Professional & Managed)), Deployment, Organization Size, End User (Service Providers & Enterprises), and Region - Global Forecast to 2024


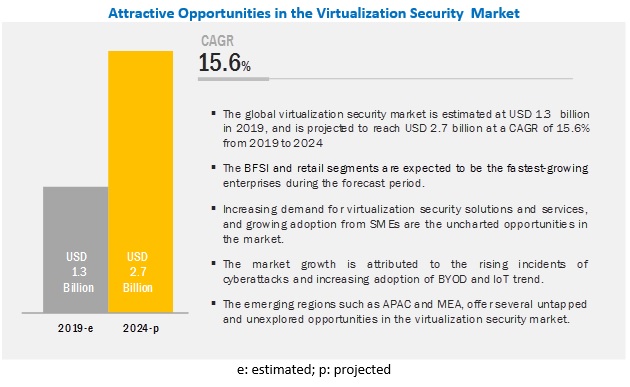
[165 Pages Report] The global virtualization security market size is expected to grow USD 1.3 billion in 2019 to USD 2.7 billion by 2024, at a Compound Annual Growth Rate (CAGR) of 15.6% during the forecast period. The virtualization security solution acts as a barrier to secure perimeter access to a network. It provides dedicated security services and assured traffic isolation within the cloud, along with customizable firewall controls as an additional managed service.
The virtual lifecycle protection segment is expected to have a significant market size during the forecast period.
VMs move through the infrastructure; they are susceptible to attack as they move through the infrastructure. There are 2 two proprietary approaches to tracking the Virtual Machine (VM) movement. One method is to tag the VM with a unique label. The other is to use a fingerprint that identifies the VM by following a proprietary algorithm that looks at specific characteristics of a VM to establish a unique identity. Implementations of such approaches enables the use of a virtual lifecycle cycle protection solution that may track movement and identify any integrity violation of the VM during campaign.
The integration and design segment is expected to grow at the highest CAGR during the forecast period.
Integration and design, is a comprehensive and robust security framework, is one of the necessary and most important steps of protecting infrastructure from physical as well as cyber-attacks. These security system architectures are designed according to the standards and compliances set by government bodies and organizations. Designing cybersecurity architecture requires network mapping and the blueprint of the entire system. It is executed by identifying network assets; analyzing security risks; developing security plans and policies; and training, implementing, and maintaining security. System integration involves the integration of the vendor�s security system into the customer�s security system plan with minimum deviation and as per according to the requirements. The design and system integration services reduce risks and complexity and increase the return on investment.
Europe is expected to grow at a significant CAGR during the forecast period
This region comprises major growing economies, such as the UK, Germany, and France. The virtualization security market is expected to be witnessing growth opportunities in this region, with the major players focusing on expanding their presence across various enterprises, such as healthcare, BFSI, retail, and manufacturing. The Europe an region is the second-largest in terms of adopting virtualization security solutions and services. Quite similar to North America, enterprises in this region have been demonstrating a progressive growth in the implementation of virtualization security solutions and services, due to the presence of influential technical experts and substantial IT budgets. Europe has a proficient technology background, and the strong proliferation of cloud has further stimulated IT organizations to adopt virtualization security solutions and services for better security of workloads. The availability of a higher number of virtualization security providers is expected to be one of the major factors in helping this region contribute significantly to the growth of the virtualization security market. Using virtualization security solutions and services, enterprises in this region have reported significant cost reductions, greater security, more automation, and improved customer experience.
Key Market Players
The major virtualization security vendors include Trend Micro (Japan), VMware (US), Juniper Networks (US), Fortinet (US), Sophos (UK), Cisco (US), IBM (US), Centrify (US), HyTrust (US), Check Point (Israel), Tripwire (US), HPE (US), Dell EMC (US), Intel (US), CA Technologies (US), Symantec (US), StrataCloud (US), ESET (Slovakia), McAfee (US), and Huawei (China).
Get online access to the report on the World's First Market Intelligence Cloud
- Easy to Download Historical Data & Forecast Numbers
- Company Analysis Dashboard for high growth potential opportunities
- Research Analyst Access for customization & queries
- Competitor Analysis with Interactive dashboard
- Latest News, Updates & Trend analysis
Request Sample Scope of the Report
Get online access to the report on the World's First Market Intelligence Cloud
- Easy to Download Historical Data & Forecast Numbers
- Company Analysis Dashboard for high growth potential opportunities
- Research Analyst Access for customization & queries
- Competitor Analysis with Interactive dashboard
- Latest News, Updates & Trend analysis

|
Report Metric |
Details |
|
Market size available for years |
2017�2024 |
|
Base year considered |
2018 |
|
Forecast period |
2019�2024 |
|
Forecast units |
Value (USD Billion) |
|
Segments covered |
Component (solution and services), organization size, deployment, end-user (service providers and enterprises), and region |
|
Geographies covered |
North America, Europe, APAC, MEA, and Latin America |
|
Companies Covered |
Trend Micro (Japan), VMware (US), Juniper Networks (US), Fortinet (US), Sophos (UK), Cisco (US), IBM (US), Centrify (US), HyTrust (US), Check Point (Israel), Tripwire (US), HPE (US), Dell EMC (US), Intel (US), CA Technologies (US), Symantec (US), StrataCloud (US), ESET (Slovakia), McAfee (US), and Huawei (China) |
The research report categorizes the market based on component (solution and services), deployment, organization size, end user (service providers and enterprises), and region.
By component, the virtualization security market has the following segments:
- Solutions
- Host Based
- Anti-malware
- Virtual Appliance
- Virtual Zone
- Virtual Infrastructure Protection
- Virtual LifeCycle Protection
- Log and Patch Management
- Configuration Management
- Virtualization Security API
- Services
- Professional Services
- Integration and Design
- Consulting
- Support and Maintenance
- Training and Education
- Managed Services
- Professional Services
By deployment, the virtualization security market has the following segments:
- On-premises
- Cloud
By organization size, the market has the following segments:
- Small and Medium-sized Enterprises (SMEs)
- Large Enterprises
By end user, the virtualization security market has the following segments:
- Service Providers
- Cloud Service Provider
- Telecom Service Provider
- Enterprises
- Banking, Financial Services and Insurance (BFSI)
- Government, Defense and Aerospace
- Healthcare and Life Sciences
- Retail
- Manufacturing
- Education
- Others (Hospitality, Transportation and Logistics, Media and Entertainment, Industrial Control, and Energy and Utilities)
By region, the virtualization security market has the following segments:
- North America
- United States (US)
- Canada
- Europe
- United Kingdom (UK)
- France
- Germany
- Rest of Europe
- APAC
- Australia and New Zealand
- Japan
- China
- Rest of APAC
- MEA
- Middle East
- Africa
- Latin America
- Brazil
- Mexico
- Rest of Latin America
Recent Developments:
- In July 2019, Trend Micro extended the reach of its virtualization security offerings to address the full range of the DevSecOps life cycle. The latest updates to the Deep Security-as-a-Service solution add the ability to inspect all lateral and horizontal traffic movement between virtualizations and platform layers, such as Kubernetes and Docker.
- In December 2018, VMWare introduced VMWare NSX Service Mesh to provide features such as connectivity, management, monitoring, and security to networks with containerized microservices on cloud platforms.
- In October 2018, Fortinet acquired ZoneFox, a cloud-based threat analytics company. The acquisition would strengthen the company�s existing endpoint and SIEM security solutions.
Frequently Asked Questions (FAQ):
What is Virtualization Security?
Virtualization security is a set of policies, processes, and procedures performed and implemented to safeguard Virtual Machines (VMs), virtual networks, virtualized environments, and infrastructures from attacks and vulnerabilities from primary physical devices.
What is the growth scope of the virtualization security market?
The global virtualization security market size is expected to grow USD 1.3 billion in 2019 to USD 2.7 billion by 2024, at a Compound Annual Growth Rate (CAGR) of 15.6% during the forecast period. The virtualization security solution acts as a barrier to secure perimeter access to a network. It provides dedicated security services and assured traffic isolation within the cloud, along with customizable firewall controls as an additional managed service.
What are virtualization security services?
The services segment have been categorized into two services namely: Professional Services (Integration and Design, Consulting, Support and Maintenance, and Training and Education), and Managed Services. The demand for services is directly related to the adoption level of virtualization security solutions. The adoption of virtualization security solutions is increasing to secure business-sensitive cloud and on-premises applications. Managed services segment has a major influence on the virtualization security market size. Furthermore, these services help in reducing costs, increasing the overall revenue, and enhancing business performance.
Who are the prominent players in the virtualization security market
Trend Micro, VMware, Juniper Networks, Fortinet, Sophos, Cisco, IBM, Centrify, HyTrust, Check Point are some of the prominent players in the virtualization security market.
What is the regional analysis of the virtualization security market?
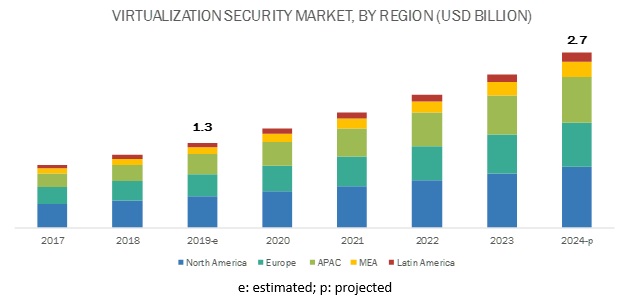
North America is expected to hold the largest market size due to the early adoption of advanced technologies and the increase in the need for improved operational efficiencies among enterprises. Europe is projected to account for the second-largest market share, after North America and APAC is expected to be the fastest-growing region in the virtualization security market by 2024.
What are the top trends in virtualization security market?
Trends that are impacting the virtualization security market includes:
- Increasing adoption of virtual applications across SMES and large enterprises
- Rising incidence of cyberattacks
- Increase in stringent regulations and compliance requirements
- Increasing adoption of BYOD and IoT trends
Opportunities for the virtualization security market:
- Increasing demand for virtualization security solutions and services
- Growing adoption among SMES
To speak to our analyst for a discussion on the above findings, click Speak to Analyst
Table of Contents
1 Introduction (Page No. - 21)
1.1 Objectives of the Study
1.2 Market Definition
1.2.1 Inclusions and Exclusions
1.3 Market Scope
1.3.1 Market Segmentation
1.3.2 Regions Covered
1.4 Years Considered for the Study
1.5 Currency Considered
1.6 Stakeholders
2 Research Methodology (Page No. - 25)
2.1 Research Data
2.1.1 Secondary Data
2.1.2 Primary Data
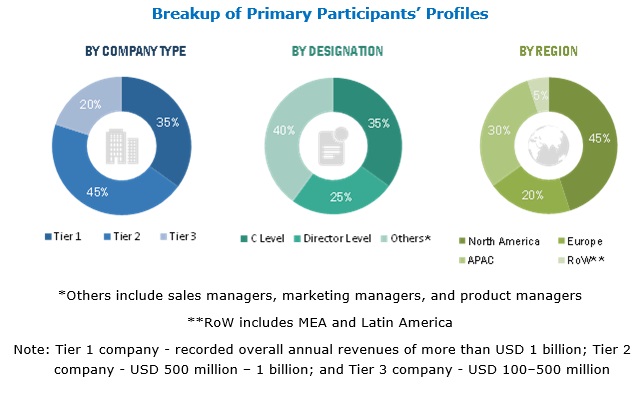
2.1.2.1 Breakup of Primary Profiles
2.1.2.2 Key Industry Insights
2.2 Market Breakdown and Data Triangulation
2.3 Market Size Estimation
2.3.1 Top-Down Approach
2.3.2 Bottom-Up Approach
2.4 Market Forecast
2.5 Competitive Leadership Mapping Research Methodology
2.5.1 Vendor Inclusion Criteria
2.6 Assumptions for the Study
2.7 Limitations of the Study
3 Executive Summary (Page No. - 33)
4 Premium Insights (Page No. - 37)
4.1 Attractive Market Opportunities in the Virtualization Security Market
4.2 Market, By Component, 2019
4.3 Market, By Professional Service, 2019�2024
4.4 Market, Market Share of Top 3 Enterprises and Regions, 2019
4.5 Market, By Organization Size, 2019
4.6 Market Investment Scenario
5 Market Overview (Page No. - 40)
5.1 Introduction
5.2 Market Dynamics
5.2.1 Drivers
5.2.1.1 Increasing Adoption of Virtual Applications Across SMES and Large Enterprises
5.2.1.2 Rising Incidence of Cyberattacks
5.2.1.3 Increase in Stringent Regulations and Compliance Requirements
5.2.1.4 Increasing Adoption of Byod and IoT Trends
5.2.2 Restraints
5.2.2.1 Lack of Skilled Professionals
5.2.3 Opportunities
5.2.3.1 Increasing Demand for Virtualization Security Solutions and Services
5.2.3.2 Growing Adoption Among SMES
5.2.4 Challenges
5.2.4.1 Compatibility Issues With Legacy Systems
5.2.4.2 Lack of Awareness of Virtualization Security
5.3 Vulnerabilities in Virtualized Environment
5.4 Good Practices in Virtualized Environment
5.5 Porter�s Five Forces Model: Virtualization Security
5.6 Use Cases
6 Virtualization Security Market, By Component (Page No. - 51)
6.1 Introduction
6.2 Solutions
6.2.1 Host-Based
6.2.1.1 Need to Avoid Unidentified Authentication to Any of the Guest Operating System Driving the Growth of Host-Based Solutions Segment
6.2.2 Anti-Malware
6.2.2.1 Need to Detect and Block Some Malware at the Network Level During and After Infection Driving the Growth of Anti-Malware Solutions Segment
6.2.3 Virtual Appliance
6.2.3.1 Increasing Need to Secure Virtual Machine Driving the Growth of Virtual Appliance Solutions Segment
6.2.4 Virtual Zone
6.2.4.1 Growing Need to Secure Virtual Environment Driving the Growth of Virtual Zone Solutions Segment
6.2.5 Virtual Infrastructure Protection
6.2.5.1 Need to Limit the Potential Risk of Attack Through Bypass of the Management Console and Direct Connection Driving the Growth of Virtual Infrastructure Protection Solutions Segment
6.2.6 Virtual Life Cycle Protection
6.2.6.1 Need to Limit Susceptible Attacks Driving the Growth of Virtual Life Cycle Protection Solutions Segment
6.2.7 Log and Patch Management
6.2.7.1 Growing Demand for Updated and Secured Virtual Machine Driving the Growth of Log and Patch Management Solutions Segment
6.2.8 Configuration Management
6.2.8.1 Growing Demand for Configuration Security Driving the Configuration Management Solutions Segment
6.2.9 Virtualization Security API
6.2.9.1 Growing Need to Provide Performance Monitoring and Scanning/Remediation of Memory-Resident Malware Driving the Virtualization Security API Solutions Segment
6.3 Services
6.3.1 Professional Services
6.3.1.1 Integration and Design
6.3.1.1.1 Increasing Need to Provide Integration of the Vendor�s Security System Into the Customer�s Security System Plan With Minimum Deviation Driving the Growth of Integration and Design Services Segment
6.3.1.2 Consulting
6.3.1.2.1 Need to Enhance Security in the Existing It Systems Driving the Growth of Consulting Services Segment
6.3.1.3 Support and Maintenance
6.3.1.3.1 Need to Help Enterprises in Providing Installation, Maintenance, and Other Support Activities Driving the Growth of
Support and Maintenance Services Segment
6.3.1.4 Training and Education
6.3.1.4.1 Need to Help in Achieving Critical Skills for Improving the Overall Security of Personal Devices, Laptops, and Other
Computing Devices to Drive the Growth of Training and Education Services Segment
6.3.2 Managed Services
6.3.2.1 Need to Protect Business-Critical Applications Driving the Growth of Managed Services Segment
7 Virtualization Security Market, By Deployment (Page No. - 71)
7.1 Introduction
7.2 Cloud
7.2.1 Need for Service-Oriented Architecture and a Robust Set of Transformation Processes to Meet Business Objectives Driving the Growth of Cloud Segment
7.3 On-Premises
7.3.1 Increasing Demand for Data Validation, Standardization, and Robust Matching to Drive the Growth of On-Premises Segment
8 Market, By Organization Size (Page No. - 75)
8.1 Introduction
8.2 Small and Medium-Sized Enterprises
8.2.1 Increasing Need for Secured Cloud and Virtualized Environment to Boost the Growth of Small and Medium-Sized Enterprises Segment
8.3 Large Enterprises
8.3.1 Increasing use of Virtual Secured Applications to Fuel the Growth of Large Enterprises Segment
9 Virtualization Security Market, By End User (Page No. - 79)
9.1 Introduction
9.2 Service Providers
9.2.1 Cloud Service Providers
9.2.1.1 Growing Need for Healthy Security Posture to Boost the Market Among Cloud Service Providers
9.2.2 Telecom Service Providers
9.2.2.1 Advent of 5g Networks, and the Need to Support IoT Devices Through Secured Connectivity Driving the Growth of Market Among Various Telecom Service Providers
9.3 Enterprises
9.3.1 Banking, Financial Services, and Insurance
9.3.1.1 Increasing Adoption of Virtualized Environment for Better Financial Transactions to Boost the Growth of Virtualization Security Market in BFSI Segment
9.3.2 Government, Defense, and Aerospace
9.3.2.1 Need for Reduced Capex and Optimized Governance Processes to Fuel the Growth of Market in Government, Defense, and Aerospace Segment
9.3.3 Healthcare and Life Sciences
9.3.3.1 Growing Demand for Data Encryption, Application Firewalls, Disaster Recovery and Business Continuity to Fuel the Growth of Market in Healthcare and Life Sciences Segment
9.3.4 Retail
9.3.4.1 Growing Demand for Secured Personalized Experiences Across All the Touchpoints, Including Point of Sale and Web Driving the Growth of Virtualization Security Market in Retail Segment
9.3.5 Manufacturing
9.3.5.1 Increasing use of Virtualization to Optimally use Control Systems Driving the Growth of Market in Manufacturing Segment
9.3.6 Education
9.3.6.1 Increasing Need to Safeguard the Interest of the Universities and Education System Driving the Growth of Market in Education Segment
9.3.7 Other Enterprises
10 Virtualization Security Market, By Region (Page No. - 96)
10.1 Introduction
10.2 North America
10.2.1 United States
10.2.1.1 Increasing Need for Security and Faster Configurations to Boost the Adoption of Virtualization Security Solutions in the US
10.2.2 Canada
10.2.2.1 Growing Data Security Concerns and the Regulations to Fuel the Adoption of Virtualization Security Solutions in Canada
10.3 Europe
10.3.1 United Kingdom
10.3.1.1 Adoption of Cloud and Virtualization Services to Drive the Growth of Market in the UK
10.3.2 Germany
10.3.2.1 Advancement Toward Digitalization Approach to Propel the Growth of Virtualization Security Market in Germany
10.3.3 France
10.3.3.1 Increasing Virtual Workloads and Need to Protect Them Driving the Growth of Market in France
10.3.4 Rest of Europe
10.4 Asia Pacific
10.4.1 Australia and New Zealand
10.4.1.1 Rapid Adoption of Digital Transformation Initiatives Among Enterprises to Boost the Adoption of Virtualization Security Solutions in ANZ
10.4.2 Japan
10.4.2.1 Growing Interest of Organizations Toward Implementing Virtualization Technology-Based Solutions to Fuel the Growth of Market in Japan
10.4.3 China
10.4.3.1 High It Spending and Stable Government Support for Implementing the Latest Technologies to Drive the Growth of Virtualization Security Market in China
10.4.4 Rest of Asia Pacific
10.5 Middle East and Africa
10.5.1 Middle East
10.5.1.1 Growing Need to Provide Robust Virtual Applications Driving the Growth of Market in the Middle East
10.5.2 Africa
10.5.2.1 Growing Demand for Digital Transformations Through the Adoption of Virtualized Environments to Boost the Growth of Market in Africa
10.6 Latin America
10.6.1 Mexico
10.6.1.1 Increased Productivity By Using Virtualization Solutions to Boost the Growth of Virtualization Security Market in Mexico
10.6.2 Brazil
10.6.2.1 Increasing Awareness of Organizations for Virtualization Technology to Improve Service Operations to Drive the Growth of Market in Brazil
10.6.3 Rest of Latin America
11 Competitive Landscape (Page No. - 127)
11.1 Competitive Leadership Mapping
11.1.1 Visionary Leaders
11.1.2 Innovators
11.1.3 Dynamic Differentiators
11.1.4 Emerging Companies
11.2 Competitive Scenario
11.2.1 Partnerships, Agreements, and Collaborations
11.2.2 New Product Launches/Product Enhancements
11.2.3 Mergers and Acquisitions
11.2.4 Business Expansions
12 Company Profiles (Page No. - 133)
12.1 Introduction
(Business Overview, Solutions, Products & Services, Key Insights, Recent Developments, SWOT Analysis, MnM View)*
12.2 Trend Micro
12.3 VMware
12.4 Juniper Networks
12.5 Fortinet
12.6 Sophos
12.7 Cisco
12.8 IBM
12.9 Centrify
12.10 HyTrust
12.11 Checkpoint
12.12 Tripwire
12.13 Hewlett Packard Enterprise (HPE)
12.14 Dell EMC
12.15 Intel
12.16 CA Technologies
12.17 Symantec
12.18 StrataCloud
12.19 ESET
12.20 McAfee
12.21 Huawei
12.22 10zig Technology Inc.
*Details on Business Overview, Solutions, Products & Services, Key Insights, Recent Developments, SWOT Analysis, MnM View Might Not be Captured in Case of Unlisted Companies.
13 Appendix (Page No. - 158)
13.1 Discussion Guide
13.2 Knowledge Store: Marketsandmarkets� Subscription Portal
13.3 Available Customizations
13.4 Related Reports
13.5 Author Details
List of Tables (113 Tables)
Table 1 United States Dollar Exchange Rate, 2016�2018
Table 2 Factor Analysis
Table 3 Evaluation Criteria
Table 4 Virtualization Security Market Size and Growth Rate, 2017�2024 (USD Million, Y-O-Y %)
Table 5 Vulnerabilities in Virtualized Environment: Guest OS and Host OS
Table 6 Vulnerabilities in Virtualized Environment: Containers
Table 7 Vulnerabilities in Virtualized Environment: Hypervisor/Virtual Machine Manager (VMM)
Table 8 Vulnerabilities in Virtualized Environment: Virtual Networks
Table 9 Vulnerabilities in Virtualized Environment: Virtual Storage
Table 10 Component-Specific Security Good Practices for Virtualized Environments: Guest OS and Host OS
Table 11 Component-Specific Security Good Practices for Virtualized Environments: Containers
Table 12 Component-Specific Security Good Practices for Virtualized Environments: Hypervisor/VMM
Table 13 Component-Specific Security Good Practices for Virtualized Environments: Virtual Network
Table 14 Component-Specific Security Good Practices for Virtualized Environments: Virtual Storage
Table 15 Porter�s Five Forces Model: Virtualization Security
Table 16 Virtualization Security use Cases
Table 17 Virtualization Security Market Size, By Component, 2017�2024 (USD Million)
Table 18 Solution: Market Size, By Type, 2017�2024 (USD Million)
Table 19 Solutions: Market Size, By Region, 2017�2024 (USD Million)
Table 20 Host-Based: Market Size, By Region, 2017�2024 (USD Thousand)
Table 21 Anti-Malware: Market Size, By Region, 2017�2024 (USD Thousand)
Table 22 Virtual Appliance: Market Size, By Region, 2017�2024 (USD Thousand)
Table 23 Virtual Zone: Virtualization Security Market Size, By Region, 2017�2024 (USD Thousand)
Table 24 Virtual Infrastructure Protection: Market Size, By Region, 2017�2024 (USD Thousand)
Table 25 Virtual Life Cycle Protection: Market Size, By Region, 2017�2024 (USD Thousand)
Table 26 Log and Patch Management: Market Size, By Region, 2017�2024 (USD Thousand)
Table 27 Configuration Management: Market Size, By Region, 2017�2024 (USD Thousand)
Table 28 Virtualization Security API: Market Size, By Region, 2017�2024 (USD Thousand)
Table 29 Virtualization Security Market Size, By Service, 2017�2024 (USD Million)
Table 30 Services: Market Size, By Region, 2017�2024 (USD Million)
Table 31 Professional Services: Market Size, By Type, 2017�2024 (USD Million)
Table 32 Professional Services: Market Size, By Region, 2017�2024 (USD Million)
Table 33 Integration and Design: Market Size, By Region, 2017�2024 (USD Thousand)
Table 34 Consulting: Virtualization Security Market Size, By Region, 2017�2024 (USD Thousand)
Table 35 Support and Maintenance: Market Size, By Region, 2017�2024 (USD Thousand)
Table 36 Training and Education: Market Size, By Region, 2017�2024 (USD Thousand)
Table 37 Managed Services: Market Size, By Region, 2017�2024 (USD Million)
Table 38 Virtualization Security Market Size, By Deployment, 2017�2024 (USD Million)
Table 39 Cloud: Market Size, By Region, 2017�2024 (USD Million)
Table 40 On-Premises: Market Size, By Region, 2017�2024 (USD Million)
Table 41 Market Size, By Organization Size, 2017�2024 (USD Million)
Table 42 Small and Medium-Sized Enterprises: Market Size, By Region, 2017�2024 (USD Million)
Table 43 Large Enterprises: Market Size, By Region, 2017�2024 (USD Million)
Table 44 Virtualization Security Market Size, By End User, 2017�2024 (USD Million)
Table 45 Market Size, By Service Provider, 2017�2024 (USD Million)
Table 46 Service Providers: Market Size, By Region, 2017�2024 (USD Million)
Table 47 Cloud Service Providers: Market Size, By Region, 2017�2024 (USD Million)
Table 48 Telecom Trends
Table 49 Telecom Service Providers: Market Size, By Region, 2017�2024 (USD Thousand)
Table 50 Virtualization Market Size, By Enterprise, 2017�2024 (USD Million)
Table 51 Enterprises: Virtualization Security Market Size, By Region, 2017�2024 (USD Million)
Table 52 Banking, Financial Services, and Insurance: Market Size, By Region, 2017�2024 (USD Thousand)
Table 53 Government, Defense, and Aerospace: Market Size, By Region, 2017�2024 (USD Thousand)
Table 54 Healthcare and Life Sciences: Market Size, By Region, 2017�2024 (USD Thousand)
Table 55 Retail: Market Size, By Region, 2017�2024 (USD Thousand)
Table 56 Manufacturing: Virtualization Security Market Size, By Region, 2017�2024 (USD Thousand)
Table 57 Education: Market Size, By Region, 2017�2024 (USD Thousand)
Table 58 Others: Market Size, By Region, 2017�2024 (USD Thousand)
Table 59 Market Size, By Region, 2017�2024 (USD Million)
Table 60 North America: Virtualization Security Market Size, By Component, 2017�2024 (USD Million)
Table 61 North America: Market Size, By Solution, 2017�2024 (USD Thousand)
Table 62 North America: Market Size, By Service, 2017�2024 (USD Million)
Table 63 North America: Market Size, By Professional Service, 2017�2024 (USD Million)
Table 64 North America: Market Size, By Deployment, 2017�2024 (USD Million)
Table 65 North America: Market Size, By Organization Size, 2017�2024 (USD Million)
Table 66 North America: Market Size, By End User, 2017�2024 (USD Million)
Table 67 North America: Market Size, By Service Provider, 2017�2024 (USD Million)
Table 68 North America: Market Size, By Enterprise, 2017�2024 (USD Million)
Table 69 North America: Market Size, By Country, 2017�2024 (USD Million)
Table 70 Europe: Virtualization Security Market Size, By Component, 2017�2024 (USD Million)
Table 71 Europe: Market Size, By Solution, 2017�2024 (USD Thousand)
Table 72 Europe: Market Size, By Service, 2017�2024 (USD Million)
Table 73 Europe: Market Size, By Professional Service, 2017�2024 (USD Thousand)
Table 74 Europe: Market Size, By Deployment, 2017�2024 (USD Million)
Table 75 Europe: Market Size, By Organization Size, 2017�2024 (USD Million)
Table 76 Europe: Market Size, By End User, 2017�2024 (USD Million)
Table 77 Europe: Market Size, By Service Provider, 2017�2024 (USD Million)
Table 78 Europe: Market Size, By Enterprise, 2017�2024 (USD Thousand)
Table 79 Europe: Market Size, By Country, 2017�2024 (USD Thousand)
Table 80 Asia Pacific: Virtualization Security Market Size, By Component, 2017�2024 (USD Million)
Table 81 Asia Pacific: Market Size, By Solution, 2017�2024 (USD Thousand)
Table 82 Asia Pacific: Market Size, By Service, 2017�2024 (USD Million)
Table 83 Asia Pacific: Market Size, By Professional Service, 2017�2024 (USD Thousand)
Table 84 Asia Pacific: Market Size, By Deployment, 2017�2024 (USD Million)
Table 85 Asia Pacific: Market Size, By Organization Size, 2017�2024 (USD Million)
Table 86 Asia Pacific: Market Size, By End User, 2017�2024 (USD Million)
Table 87 Asia Pacific: Market Size, By Service Provider, 2017�2024 (USD Million)
Table 88 Asia Pacific: Market Size, By Enterprise, 2017�2024 (USD Thousand)
Table 89 Asia Pacific: Market Size, By Country, 2017�2024 (USD Million)
Table 90 Middle East and Africa: Virtualization Security Market Size, By Component, 2017�2024 (USD Million)
Table 91 Middle East and Africa: Market Size, By Solution, 2017�2024 (USD Thousand)
Table 92 Middle East and Africa: Market Size, By Service, 2017�2024 (USD Million)
Table 93 Middle East and Africa: Market Size, By Professional Service, 2017�2024 (USD Thousand)
Table 94 Middle East and Africa: Market Size, By Deployment, 2017�2024 (USD Million)
Table 95 Middle East and Africa: Market Size, By Organization Size, 2017�2024 (USD Million)
Table 96 Middle East and Africa: Market Size, By End User, 2017�2024 (USD Million)
Table 97 Middle East and Africa: Market Size, By Service Provider, 2017�2024 (USD Million)
Table 98 Middle East and Africa: Market Size, By Enterprise, 2017�2024 (USD Thousand)
Table 99 Middle East and Africa: Market Size, By Country, 2017�2024 (USD Million)
Table 100 Latin America: Virtualization Security Market Size, By Component, 2017�2024 (USD Million)
Table 101 Latin America: Market Size, By Solution, 2017�2024 (USD Thousand)
Table 102 Latin America: Market Size, By Service, 2017�2024 (USD Million)
Table 103 Latin America: Market Size, By Professional Service, 2017�2024 (USD Thousand)
Table 104 Latin America: Market Size, By Deployment, 2017�2024 (USD Million)
Table 105 Latin America: Market Size, By Organization Size, 2017�2024 (USD Million)
Table 106 Latin America: Market Size, By End User, 2017�2024 (USD Million)
Table 107 Latin America: Market Size, By Service Provider, 2017�2024 (USD Thousand)
Table 108 Latin America: Market Size, By Enterprise, 2017�2024 (USD Thousand)
Table 109 Latin America: Market Size, By Country, 2017�2024 (USD Million)
Table 110 Partnerships, Agreements, and Collaborations, 2018
Table 111 New Product Launches/Product Enhancements, 2018�2019
Table 112 Mergers and Acquisitions, 2018�2019
Table 113 Business Expansions, 2019
List of Figures (61 Figures)
Figure 1 Global Virtualization Security Market: Research Design
Figure 2 Research Methodology
Figure 3 Market: Bottom-Up and Top-Down Approaches
Figure 4 Global Market to Witness Significant Growth During the Forecast Period
Figure 5 Services Segment to Grow at a Higher CAGR During the Forecast Period
Figure 6 North America to Account for the Highest Market Share in 2019
Figure 7 Fastest Growing Segments of the Virtualization Security Market
Figure 8 Increasing Demand for Virtualization Security Solutions and Services and Growing Adoption From Small and Medium-Sized Enterprises to Fuel the Growth of Market
Figure 9 Virtualization Security Solutions Segment to Account for a Higher Market Share During the Forecast Period
Figure 10 Integration and Design to Account for the Highest Market Share During the Forecast Period
Figure 11 Banking, Financial Services, and Insurance and North America to Account for the Highest Market Shares in 2019
Figure 12 Small and Medium-Sized Enterprises Segment to Grow at a Higher CAGR During the Forecast Period
Figure 13 Asia Pacific to Emerge as the Best Market for Investments in the Next 5 Years
Figure 14 Drivers, Restraints, Opportunities, and Challenges: Virtualization Security Market
Figure 15 Solutions Segment to Dominate the Component Segment in the Market During the Forecast Period
Figure 16 Virtual Infrastructure Protection Segment to Dominate the Market During the Forecast Period
Figure 17 North America to Dominate the Solutions Segment in the Market During the Forecast Period
Figure 18 Asia Pacific to Grow at the Highest CAGR in the Virtual Infrastructure Protection Segment During the Forecast Period
Figure 19 North America to Account for the Largest Market Size During the Forecast Period
Figure 20 Professional Services to Dominate the Services Segment During the Forecast Period
Figure 21 Asia Pacific to Grow at the Highest CAGR in the Services Segment During the Forecast Period
Figure 22 Support and Maintenance Segment to Grow at the Highest CAGR During the Forecast Period
Figure 23 North America to Dominate the Professional Services Segment During the Forecast Period
Figure 24 North America to Dominate the Professional Services Segment During the Forecast Period
Figure 25 Asia Pacific to Grow at the Highest CAGR in the Managed Services Segment During the Forecast Period
Figure 26 Cloud Segment to Dominate the Market During the Forecast Period
Figure 27 Asia Pacific to Grow at the Highest CAGR in the Cloud Segment During the Forecast Period
Figure 28 North America to Dominate the On-Premises Segment in the Virtualization Security Market During the Forecast Period
Figure 29 Large Enterprises Segment to Dominate the Market During the Forecast Period
Figure 30 Asia Pacific to Grow at the Highest CAGR During the Forecast Period
Figure 31 North America to Dominate the Market During the Forecast Period
Figure 32 Enterprises to Dominate the End User Segment During the Forecast Period
Figure 33 Cloud Service Providers to Dominate the End User Segment During the Forecast Period
Figure 34 North America to Dominate the Service Provider Segment During the Forecast Period
Figure 35 Asia Pacific to Grow at the Highest CAGR in the Cloud Service Providers Segment During the Forecast Period
Figure 36 Asia Pacific to Grow at the Highest CAGR in the Telecom Service Providers Segment During the Forecast Period
Figure 37 Retail Segment to Grow at the Highest CAGR in the Enterprises Segment During the Forecast Period
Figure 38 North America to Dominate the Enterprise Segment in the Virtualization Security Market During the Forecast Period
Figure 39 Asia Pacific to Grow at the Highest CAGR in the BFSI Segment During the Forecast Period
Figure 40 North America to Dominate the Retail Segment in the Market During the Forecast Period
Figure 41 North America to Account for the Largest Market Size in the Global Virtualization Security Market During the Forecast Period
Figure 42 Asia Pacific to be an Attractive Market for Investments
Figure 43 North America: Market Snapshot
Figure 44 Solutions Segment to Account for the Largest Market Size During the Forecast Period
Figure 45 Solutions Segment to Have a Larger Market Size in the Component Segment During the Forecast Period
Figure 46 Asia Pacific: Market Snapshot
Figure 47 Solutions Segment to Have a Significant Market Size During the Forecast Period
Figure 48 Solutions Segment to Grow at a Significant CAGR During the Forecast Period
Figure 49 Solutions Segment to Have a Larger Market Size During the Forecast Period
Figure 50 Global Virtualization Security Market (Global), Competitive Leadership Mapping, 2019
Figure 51 Key Developments By the Leading Players in the Market, 2018�2019
Figure 52 Trend Micro: Company Snapshot
Figure 53 Trend Micro: SWOT Analysis:
Figure 54 VMware: Company Snapshot
Figure 55 VMware: SWOT Analysis
Figure 56 Juniper Networks: Company Snapshot
Figure 57 Juniper Networks: SWOT Analysis
Figure 58 Fortinet: Company Snapshot
Figure 59 Fortinet: SWOT Analysis
Figure 60 Sophos: Company Snapshot
Figure 61 Sophos: SWOT Analysis
The study involved four major activities in estimating the current market size for the virtualization security market. Extensive secondary research was done to collect information on the market, peer market, and parent market. The next step was to validate these findings, assumptions, and sizing with industry experts across the value chain through primary research. Both top-down and bottom-up approaches were employed to estimate the total market size. After that, market breakup and data triangulation were used to estimate the market size of segments and subsegments.
Secondary Research
The market size of companies offering virtualization security solution and services globally was derived with the help of the secondary data available through paid and unpaid sources. In the secondary research process, various secondary sources, such as D&B Hoovers, Bloomberg BusinessWeek, and Factiva, have been referred to for identifying and collecting information for the study. The secondary sources included annual reports, press releases, and investor presentations of companies; white papers, journals, and certified publications, such as such as The European Union Agency for Cybersecurity (ENISA), National Institute of Standards and Technology, Cloud Security Alliance, and Storage Networking Industry Association; and articles from recognized authors, directories, and databases. Secondary research was mainly used to obtain key information about the industry�s supply chain, the total pool of key players, market classification, and segmentation according to the industry trends to the bottom-most level, regional markets, and key developments from both market and technology oriented perspectives, all of which were further validated by primary sources.
Primary Research
The virtualization security market comprises several stakeholders, such as virtualization security solution and service vendors, Virtual infrastructure suppliers, Virtualization Security Application Programming Interface (API) providers, Virtual installation, monitoring, and controlling companies, cloud service providers, system integrators, Value-Added Resellers (VARs), Information Technology (IT) security agencies, consulting firms, Managed Security Service Providers (MSSPs), and research organizations. The primary sources included industry experts from the core and related verticals, and preferred suppliers, manufacturers, distributors, service providers, technology developers, and technologists from companies and organizations related to all the segments of the market�s value chain. In-depth interviews were conducted with various primary respondents, including Chief Executive Officers (CEOs), Vice Presidents (VPs), marketing directors, virtualization security experts, and innovation directors, and related key executives from various key companies and organizations operating in the market, to obtain and verify critical qualitative and quantitative information, as well as assess the market�s prospects. The market was estimated by analyzing various driving factors, restraints, opportunities, challenges, industry trends, and key players� strategies in the virtualization security market space.
Various primary sources from both the supply and demand sides of the market were interviewed to obtain qualitative and quantitative information.
To know about the assumptions considered for the study, download the pdf brochure
Market Size Estimation
Both top-down and bottom-up approaches were used to estimate and validate the total size of the virtualization security market. The methods were also used extensively to determine the size of various subsegments in the market. The research methodology used to estimate the market size includes the following:
- The key players in the industry and markets have been identified through extensive secondary research
- The industry�s supply chain and market size, in terms of value, have been determined through primary and secondary research processes
- All percentage shares split, and breakups have been determined using secondary sources and verified through primary sources
Data Triangulation
After arriving at the overall market size, using the market size estimation processes as explained above, the market was split into several segments and subsegments. To complete the overall market engineering process and arrive at the exact statistics of each market segment and subsegment, the data triangulation, and market breakup procedures were employed, wherever applicable. Extensive qualitative and quantitative analyses were performed on the complete market engineering process to list the key information/insights throughout the report.
Report Objectives
- To define, segment, and project the global market size for virtualization security market
- To define, describe, and forecast the market by component (solution and services), organization size, deployment, end-user (service providers and enterprises), and region
- To provide detailed information about the major factors (drivers, restraints, opportunities, and challenges) influencing the growth of the market
- To analyze the micro-markets concerning individual growth trends, prospects, and contributions to the overall market
- To analyze market opportunities for stakeholders by identifying the high growth segments of the market
- To forecast the market size of the segments with respect to major regions, such as North America, Europe, Asia Pacific (APAC), Middle East, and Africa (MEA), and Latin America
- To profile the key players in the market and comprehensively analyze their market size and core competencies
- To track and analyze competitive developments, such as new product launches; mergers and acquisitions; and partnerships, agreements, and collaborations in the global virtualization security market
Key Questions Addressed by the Report:
- Where would all these developments take the industry in the mid to long term?
- What are the upcoming industry solutions for the virtualization security market?
- Which are the major factors expected to drive the market?
- Which region would offer high growth for vendors in the market?
- Which solution would gain the largest market share in the market?
Available Customizations
With the given market data, MarketsandMarkets offers customizations as per the company�s specific needs. The following customization options are available for the report:
Product Analysis
- Product matrix that gives a detailed comparison of the product portfolio of each company
Geographic Analysis
- Further breakup of the North American market into US and Canada
- Further breakup of the European market into UK, Germany, France, and Rest of Europe
- Further breakup of the Asia Pacific (APAC) virtualization security market into China, Japan, Australia and New Zealand (ANZ), and Rest of APAC
- Further breakup of the Middle East and Africa (MEA) market into Middle East and Africa
- Further breakup of the Latin American market into Brazil, Mexico, and Rest of Latin America
Company Information
- Detailed analysis and profiling of the additional market players


Growth opportunities and latent adjacency in Virtualization Security Market