WAN Optimization Market by Component (Solution (Traditional WAN and SD-WAN) and Services (Professional and Managed)), Deployment Type (Cloud and On-premises), Vertical, End User (Large Enterprises and SMEs), and Region - Global Forecast to 2025


The global WAN Optimization Market size was valued at $1.0 billion in 2020 and it is projected to reach $1.4 billion by the end of 2025 at a CAGR of 6.7% during the forecast period. The major factor driving the growth of the WAN optimization market include increasing cloud-based WAN optimization solutions as this enables companies to keep their branch offices and data center connected, and also reduces the cost of deployment and maintenance by 30–40%.

To know about the assumptions considered for the study, Request for Free Sample Report
Market Dynamics
Driver: Rising need to ensure users’ quality of experience and productivity
Most cloud-based applications for their effective utilization need good bandwidth and low latency. In large-scale WAN deployments, latency, bandwidth constraints, and packet loss are inevitable. WAN optimization enables enterprises and service providers to save money and reduce costs with reduced bandwidth requirements and increased user efficiency by alleviating the effects of latency and distance between branch offices, data centers, and cloud. Customer experience is critical and important factor during this applications era. Employee productivity and customer satisfaction is not realized when applications are failed to perform properly. The digital transformation fails to produce the desired business impact, unless the application performance is protected and delivered optimally for all users. The important challenge of IT teams of every organization is to dynamically orchestrate the performance and user experience of every application in real time irrespective of the size, location, or complexity of the network environment, which can be solved with the help of the WAN optimization solution.
Restraint: Latency of network for video content and VoIP
VoIP and video content are the growing concerns in this market as they become more persistent in enterprises. Enterprises use videos as one of the prime sources for communication, training, and education. The major challenge with these videos is that they are distributed within and outside the enterprises covering a large network. Hence, it becomes challenging to maintain consistency and transfer the data with high quality to end users. To perform a seamless transmission of these videos and VoIP data synchronization are critical factors that needs to be maintained throughout the process. The maintenance of this synchronization is a difficult job, which is a challenge for the WAN optimization solution industry. Unlike WAN optimization, SD-WAN specializes in real-time network scenarios, accounting for jitter, latency, and packet loss to ensure traffic is travelling optimally across WAN at all times. It can increase visibility into public or private (or both) applications to have more control over operations.
Opportunity: WAN optimization for cloud technology
Enterprises are rapidly adopting cloud technology to improve the scalability of internet-based database capabilities while reducing costs and risks. Hence, businesses engage in the practice of cloud computing WAN optimization technology, which accelerates slow applications across a network as well as is used to improve the cloud computing performance. WAN optimization leverages the power of the cloud to provide businesses with uninterrupted and high-performance connectivity with centralized management and control as well as creating a strong network for business growth. Fully managed cloud-enabled WAN system offers various benefits such as minimizing the risk of technological obsolescence, plugging security gaps, keeping the network safe against the latest security threats, and keeping control of infrastructure and operational costs.
Challenge: Hybrid WAN solution for enterprises
Hybrid networks will be a great opportunity in the future for the growth of the WAN optimization market. These networks are quite easy to deploy through cloud, are flexible enough to changing enterprise demands, and provide quick global availability. These networks do not suffer from congestion issues; in fact, they maintain stable latency and low-packet loss due to the dedicated Point-of-Presence (PoP). Enabling intelligent functionality such as QoS, WAN, and protocol optimization, and deduplication/compression would eliminate the need for on-premises applications. These factors make hybrid networks a good option for enterprises, and thus are expected to boost the WAN optimization market.
By component, the services segment to have a higher growth rate during the forecast period
WAN optimization service providers render a variety of services, which are categorized into professional services and managed services. Professional services comprise consulting, implementation, and support and maintenance services. These services are important as they enable CSPs, network operators, enterprises, and various organizations to transform their branch offices and data center structures, connectivity and policies for optimal performance, and also help in reducing the total cost of deployment.
By deployment mode, cloud segment is expected to have a larger market share during the forecast period
The cloud deployment mode is gaining traction in the market due to its several advantages such as cost-saving for additional hardware and software, and scalability over the on-premises solutions. In the cloud deployment mode, vendors such as Aryaka Networks are offering WAN optimization as a cloud-based service. These are based on a multilayered integrated platform developed to deliver high level of data transfer through optimizing the protocol, caching, and compression. One of the other important advantages of WAN optimization-as-a-service is that enterprises can customize the solution according to their requirements, whenever a new application is installed. These cloud-based services include reduced licensing costs, ability to cut out unnecessary Information Technology (IT) staff, focus on maintenance, and flexibility in expansion of businesses. However, to deploy the cloud model, enterprises need to analyze the benefits of their existing set-up as well as those that a cloud-based service can give them.
By region, North America to record the highest growth during the forecast period
North America has been a predominately receptive market toward the adoption of the WAN optimization solution. The region is witnessing huge demands for SD-WAN solution due to the rising demand for the next-generation 5G network. Enterprises in the region are shifting to managed SD-WAN services due to the rapidly changing technological landscape. Telecom providers in North America are providing services for both accelerating and monitoring application performance by integrating different toolsets. Major WAN optimization vendors are headquartered in this region developing new technologies which are making the WAN optimization process much efficient and cost-effective. Especially in North America, the introduction of cloud-based WAN optimization solution has accelerated the adoption rate of this solution. North America mainly consists of the US and Canada in which the US is contributing higher in the region. The US is witnessing heavy investments in the broadband infrastructure in the country and contributing to the growth of the WAN optimization market in the region.

To know about the assumptions considered for the study, download the pdf brochure
Key Market Players
The key market players profiled in this report include Cisco (US), Riverbed (US), Citrix (US), Infovista (UK), Silver Peak (US), Array Networks (US), Aryaka (US), Circadence (US), Fat Pipe (US), Nuage Networks(US), Oracle (US), Huawei(China), Wanos (South Africa), Equinix (US), Exinda (US), F5 (US), Aruba (US), and VMware(US). These players adopt various growth strategies, including partnerships and new service launches, to expand their presence in the WAN optimization market and increase their customer base.
The study includes an in-depth competitive analysis of these key players in the WAN Optimization Market with their company profiles, recent developments, and key market strategies.
Get online access to the report on the World's First Market Intelligence Cloud
- Easy to Download Historical Data & Forecast Numbers
- Company Analysis Dashboard for high growth potential opportunities
- Research Analyst Access for customization & queries
- Competitor Analysis with Interactive dashboard
- Latest News, Updates & Trend analysis
Request Sample Scope of the Report
Get online access to the report on the World's First Market Intelligence Cloud
- Easy to Download Historical Data & Forecast Numbers
- Company Analysis Dashboard for high growth potential opportunities
- Research Analyst Access for customization & queries
- Competitor Analysis with Interactive dashboard
- Latest News, Updates & Trend analysis

|
Report Metric |
Details |
|
Market size available for years |
2018-2025 |
|
Base year considered |
2019 |
|
Forecast period |
2020-2025 |
|
Forecast units |
Value (USD Billion) |
|
Segments covered |
components (solution and services), solution, services, deployment mode, end user, verticals, and regions |
|
Regions covered |
North America, Europe, APAC, MEA, and Latin America |
|
Companies covered |
Cisco (US), Riverbed (US), Citrix (US), Infovista (UK), Silver Peak (US), Array Networks (US), Aryaka (US), Circadence (US), Fat Pipe (US), Nuage Networks(US), Oracle (US), Huawei(China), Wanos (South Africa), Equinix (US), Exinda (US), F5 (US), Aruba (US), and VMware(US). |
This research report categorizes the market to forecast revenue and analyze trends in each of the following submarkets:
Based on components, the WAN optimization market has the following segments:
- Solutions
- Services
Based on solutions, the market has the following segments:
- Traditional WAN
- SD-WAN
Based on services, the WAN optimization market has the following segments:
- Professional Services
- Managed Services
Based on deployment modes, the market has the following segments:
- Cloud
- On-premises
Based on end user types, the WAN optimization market has the following segments:
- SMEs
- Large enterprises
Based on regions, the market has the following segments
-
North America
- US
- Canada
-
Europe
- UK
- Germany
- Rest of Europe
-
APAC
- China
- India
- Rest of APAC
-
MEA
- UAE
- KSA
- Rest of MEA
-
Latin America
- Brazil
- Mexico
- Rest of Latin America
Recent Developments:
- In November 2018, Cisco integrated advanced security with the SD-WAN technology to enable IT to offer better application experiences, and enhance users’ productivity and integrated security, from the branch offices to the cloud.
- In September 2019, Cisco worked with Altice USA to expand the scale of its SD-WAN service offerings to enterprises . This partnership enabled Altice USA to offer its enterprise customers various differentiated services in a seamless, reliable, and secure manner.
- In May 2019, Riverbed launched Riverbed SaaS Accelerator, a new solution that significantly accelerates the performance of leading SaaS applications. The new SaaS Accelerator solution improves user experience and business outcomes. This solution enables companies to directly measure, monitor, and accelerate the performance of SaaS-based enterprise apps.
- In August 2019, G-Net partnered with Riverbed to launch G-Net Visibility-as-a-Service (GVaaS) . This partnership delivers managed Visibility-as-a-Service (VaaS) offerings for network and application performance, and digital experience management and security.
- In February 2018, ZTE and Infovista partnered to deliver a carrier-grade and application-centric SD-WAN solution to enable successful digital transformations for enterprises. This partnership helped ZTE to provide digital transformation for enterprises globally.
Frequently Asked Questions (FAQ):
What is the projected market value of the global WAN Optimization Market?
The Global WAN Optimization market size is expected to grow from USD 1.0 billion in 2020 to USD 1.4 billion by 2025, at a Compound Annual Growth Rate (CAGR) of 6.7% during the forecast period.
Which region has the largest market share in the WAN Optimization Market?
North America is estimated to hold the largest market share in WAN Optimization Market in 2020. North America is one of the technologically advanced markets in the world.
Which Service is expected to hold a larger market size during the forecast period?
Among services, the project professional services is expected to hold the largest market size during the forecast period.
Which Deployment mode is expected to hold a larger market size during the forecast period?
Among Deployment mode, the cloud segment is expected to hold a larger market size during the forecast period.
Who are the major vendors in the WAN Optimization Market?
Major vendors in the WAN Optimization Market include Cisco (US), Riverbed (US), Citrix (US), Infovista (UK), Silver Peak (US), Array Networks (US), Aryaka (US), Circadence (US), Fat Pipe (US), Nuage Networks(US), Oracle (US), Huawei(China), Wanos (South Africa), Equinix (US), Exinda (US), F5 (US), Aruba (US), and VMware(US).) .
To speak to our analyst for a discussion on the above findings, click Speak to Analyst
TABLE OF CONTENTS
1 INTRODUCTION (Page No. - 18)
1.1 OBJECTIVES OF THE STUDY
1.2 MARKET DEFINITION
1.2.1 INCLUSIONS AND EXCLUSIONS
1.3 MARKET SCOPE
1.3.1 MARKET SEGMENTATION
1.3.2 REGIONS COVERED
1.4 YEARS CONSIDERED FOR THE STUDY
1.5 CURRENCY CONSIDERED
1.6 STAKEHOLDERS
2 RESEARCH METHODOLOGY (Page No. - 21)
2.1 RESEARCH DATA
2.1.1 SECONDARY DATA
2.1.2 PRIMARY DATA
2.1.2.1 Breakup of primary profiles
2.1.2.2 Key industry insights
2.2 MARKET BREAKUP AND DATA TRIANGULATION
2.3 MARKET SIZE ESTIMATION
2.4 MARKET FORECAST
2.5 RESEARCH ASSUMPTIONS
2.5.1 ASSUMPTIONS FOR THE STUDY
3 EXECUTIVE SUMMARY (Page No. - 28)
4 PREMIUM INSIGHTS (Page No. - 31)
4.1 ATTRACTIVE OPPORTUNITIES IN THE MARKET
4.2 WAN OPTIMIZATION MARKET IN ASIA PACIFIC, BY COMPONENT AND COUNTRY
4.3 MAJOR COUNTRIES
5 MARKET OVERVIEW AND INDUSTRY TRENDS (Page No. - 33)
5.1 INTRODUCTION
5.2 MARKET DYNAMICS
5.2.1 DRIVERS
5.2.1.1 Rising need to ensure users’ quality of experience and productivity
5.2.1.2 Rising number of data centers and branch offices
5.2.1.3 Rise of cloud-based WAN optimization solution
5.2.2 RESTRAINTS
5.2.2.1 Latency of network for video content and VoIP
5.2.3 OPPORTUNITIES
5.2.3.1 WAN optimization for cloud technology
5.2.3.2 Hybrid WAN solution for enterprises
5.2.4 CHALLENGES
5.2.4.1 High capital and operational expenditure for WAN optimization solution
5.2.4.2 Availability of low-cost bandwidth
5.3 USE CASES
5.3.1 USE CASE 1: CTC TECHNOLOGIES
5.3.2 USE CASE 2: CISCO
5.3.3 USE CASE 3: RIVERBED
5.3.4 USE CASE 4: INFOVISTA
5.3.5 USE CASE 5: INFOVISTA
5.4 TECHNOLOGY ANALYSIS
5.5 IMPACT OF COVID-19 ON BUSINESS
5.5.1 ENTERPRISE NETWORK-TRAFFIC-PATTERNS IS IMPACTED BY THE COVID-19 PANDEMIC
5.5.2 AWARENESS ABOUT PROPER DISASTER RECOVERY PLAN
6 WAN OPTIMIZATION MARKET, BY COMPONENT (Page No. - 40)
6.1 INTRODUCTION
6.2 SOLUTION
6.2.1 SOLUTION: MARKET DRIVERS
6.3 SERVICES
6.3.1 SERVICES: MARKET DRIVERS
7 MARKET, BY SOLUTION (Page No. - 44)
7.1 INTRODUCTION
7.2 TRADITIONAL WIDE AREA NETWORK
7.3 SOFTWARE-DEFINED WIDE AREA NETWORK
8 WAN OPTIMIZATION MARKET, BY SERVICE (Page No. - 47)
8.1 INTRODUCTION
8.2 PROFESSIONAL SERVICES
8.2.1 PROFESSIONAL SERVICES: MARKET DRIVERS
8.3 MANAGED SERVICES
8.3.1 MANAGED SERVICES: MARKET DRIVERS
9 MARKET, BY DEPLOYMENT MODE (Page No. - 51)
9.1 INTRODUCTION
9.2 CLOUD
9.2.1 CLOUD: MARKET DRIVERS
9.3 ON-PREMISES
9.3.1 ON-PREMISES: MARKET DRIVERS
10 WAN OPTIMIZATION MARKET, BY END USER (Page No. - 55)
10.1 INTRODUCTION
10.2 SMALL AND MEDIUM-SIZED ENTERPRISES
10.2.1 SMALL AND MEDIUM-SIZED ENTERPRISES: MARKET DRIVERS
10.3 LARGE ENTERPRISES
10.3.1 LARGE ENTERPRISES: MARKET DRIVERS
11 MARKET, BY VERTICAL (Page No. - 59)
11.1 INTRODUCTION
11.2 BANKING, FINANCIAL SERVICES AND INSURANCE
11.2.1 BANKING, FINANCIAL SERVICES AND INSURANCE: MARKET DRIVERS
11.3 HEALTHCARE
11.3.1 HEALTHCARE: MARKET DRIVERS
11.4 INFORMATION TECHNOLOGY AND TELECOM
11.4.1 INFORMATION TECHNOLOGY AND TELECOM: MARKET DRIVERS
11.5 MANUFACTURING
11.5.1 MANUFACTURING: MARKET DRIVERS
11.6 RETAIL
11.6.1 RETAIL: MARKET DRIVERS
11.7 MEDIA AND ENTERTAINMENT
11.7.1 MEDIA AND ENTERTAINMENT: MARKET DRIVERS
11.8 ENERGY
11.8.1 ENERGY: MARKET DRIVERS
11.9 EDUCATION
11.9.1 EDUCATION: MARKET DRIVERS
11.10 OTHERS
12 WAN OPTIMIZATION MARKET, BY REGION (Page No. - 69)
12.1 INTRODUCTION
12.2 NORTH AMERICA
12.2.1 NORTH AMERICA: MARKET DRIVERS
12.2.2 NORTH AMERICA: TARIFF AND REGULATORY LANDSCAPE
12.2.3 UNITED STATES
12.2.4 CANADA
12.3 EUROPE
12.3.1 EUROPE: MARKET DRIVERS
12.3.2 EUROPE: TARIFF AND REGULATORY LANDSCAPE
12.3.3 UNITED KINGDOM
12.3.4 GERMANY
12.3.5 REST OF EUROPE
12.4 ASIA PACIFIC
12.4.1 ASIA PACIFIC: MARKET DRIVERS
12.4.2 ASIA PACIFIC: TARIFF AND REGULATORY LANDSCAPE
12.4.3 CHINA
12.4.4 INDIA
12.4.5 REST OF ASIA PACIFIC
12.5 MIDDLE EAST AND AFRICA
12.5.1 MIDDLE EAST AND AFRICA: MARKET DRIVERS
12.5.2 MIDDLE EAST AND AFRICA: TARIFF AND REGULATORY LANDSCAPE
12.5.3 UNITED ARAB EMIRATES
12.5.4 KINGDOM OF SAUDI ARABIA
12.5.5 REST OF MIDDLE EAST AND AFRICA
12.6 LATIN AMERICA
12.6.1 LATIN AMERICA: WAN OPTIMIZATION MARKET DRIVERS
12.6.2 LATIN AMERICA: TARIFF AND REGULATORY LANDSCAPE
12.6.3 BRAZIL
12.6.4 MEXICO
12.6.5 REST OF LATIN AMERICA
13 COMPETITIVE LANDSCAPE (Page No. - 108)
13.1 OVERVIEW
13.2 MARKET SHARE AND RANKING
13.3 COMPETITIVE LEADERSHIP MAPPING, 2020
13.3.1 VISIONARY LEADERS
13.3.2 INNOVATORS
13.3.3 DYNAMIC DIFFERENTIATORS
13.3.4 EMERGING COMPANIES
13.4 STRENGTH OF PRODUCT PORTFOLIO
13.5 BUSINESS STRATEGY EXCELLENCE
13.6 KEY DEVELOPMENTS
13.7 COMPETITIVE SCENARIO
13.7.1 NEW PRODUCT LAUNCHES
13.7.2 BUSINESS EXPANSIONS
13.7.3 PARTNERSHIPS
14 COMPANY PROFILE (Page No. - 116)
(Business Overview, products and Solutions Offered, Recent Developments, and SWOT Analysis)*
14.1 INTRODUCTION
14.2 CISCO
14.3 THOMA BRAVO (RIVERBED)
14.4 CITRIX
14.5 INFOVISTA
14.6 SILVER PEAK
14.7 ARRAY NETWORKS
14.8 ARYAKA NETWORK
14.9 CIRCADENCE
14.10 FAT PIPE
14.11 NUAGE NETWORKS (NOKIA)
14.12 ORACLE
14.13 HUAWEI
14.14 WANOS
14.15 EQUINIX
14.16 GFI SOFTWARE (EXINDA)
14.17 F5 NETWROKS
14.18 ARUBA NETWORKS(HPE)
14.19 VMWARE
14.20 RIGHT-TO-WIN
*Details on Business Overview, products and Solutions Offered, Recent Developments, and SWOT Analysis might not be captured in case of unlisted companies.
15 APPENDIX (Page No. - 145)
15.1 DISCUSSION GUIDE
15.2 KNOWLEDGE STORE: MARKETSANDMARKETS’ SUBSCRIPTION PORTAL
15.3 AVAILABLE CUSTOMIZATION
15.4 RELATED REPORTS
15.5 AUTHOR DETAILS
LIST OF TABLES (115 TABLES)
TABLE 1 FACTOR ANALYSIS
TABLE 2 WAN OPTIMIZATION MARKET SIZE, GLOBAL, 2018–2025 (USD MILLION)
TABLE 3 MARKET SIZE, BY COMPONENT, 2018–2025 (USD MILLION)
TABLE 4 SOLUTION: MARKET SIZE, BY REGION, 2018–2025 (USD MILLION)
TABLE 5 SERVICES: MARKET SIZE, BY REGION, 2018–2025 (USD MILLION)
TABLE 6 MARKET SIZE, BY SOLUTION, 2018–2025 (USD MILLION)
TABLE 7 TRADITIONAL WIDE AREA NETWORK: MARKET SIZE, BY REGION, 2018–2025 (USD MILLION)
TABLE 8 SOFTWARE-DEFINED WIDE AREA NETWORK: MARKET SIZE, BY REGION, 2018–2025 (USD MILLION)
TABLE 9 MARKET SIZE, BY SERVICE, 2018–2025 (USD MILLION)
TABLE 10 PROFESSIONAL SERVICES: MARKET SIZE, BY REGION, 2018–2025 (USD MILLION)
TABLE 11 MANAGED SERVICES: MARKET SIZE, BY REGION, 2018–2025 (USD MILLION)
TABLE 12 MARKET SIZE, BY DEPLOYMENT MODE, 2018–2025 (USD MILLION)
TABLE 13 CLOUD: MARKET SIZE, BY REGION, 2018–2025 (USD MILLION)
TABLE 14 ON-PREMISES: MARKET SIZE, BY REGION, 2018–2025 (USD MILLION)
TABLE 15 MARKET SIZE, BY END USER 2018–2025 (USD MILLION)
TABLE 16 SMALL AND MEDIUM-SIZED ENTERPRISES: MARKET SIZE, BY REGION, 2018–2025 (USD MILLION)
TABLE 17 LARGE ENTERPRISES: MARKET SIZE, BY REGION, 2018–2025 (USD MILLION)
TABLE 18 WAN OPTIMIZATION MARKET SIZE, BY VERTICAL, 2018–2025 (USD MILLION)
TABLE 19 BANKING, FINANCIAL SERVICES AND INSURANCE: MARKET SIZE, BY REGION, 2018–2025 (USD MILLION)
TABLE 20 HEALTHCARE: MARKET SIZE, BY REGION, 2018–2025 (USD MILLION)
TABLE 21 INFORMATION TECHNOLOGY AND TELECOM: MARKET SIZE, BY REGION, 2018–2025 (USD MILLION)
TABLE 22 MANUFACTURING: MARKET SIZE, BY REGION, 2018–2025 (USD MILLION)
TABLE 23 RETAIL: MARKET SIZE, BY REGION, 2018–2025 (USD MILLION)
TABLE 24 MEDIA AND ENTERTAINMENT: MARKET SIZE, BY REGION, 2018–2025 (USD MILLION)
TABLE 25 ENERGY: MARKET SIZE, BY REGION, 2018–2025 (USD MILLION)
TABLE 26 EDUCATION: MARKET SIZE, BY REGION, 2018–2025 (USD MILLION)
TABLE 27 OTHERS: MARKET SIZE, BY REGION, 2018–2025 (USD MILLION)
TABLE 28 WAN OPTIMIZATION MARKET SIZE, BY REGION, 2018–2025 (USD MILLION)
TABLE 29 NORTH AMERICA: WAN OPTIMIZATION MARKET SIZE, BY COMPONENT, 2018–2025 (USD MILLION)
TABLE 30 NORTH AMERICA: MARKET SIZE, BY SOLUTION, 2018–2025 (USD MILLION)
TABLE 31 NORTH AMERICA: MARKET SIZE, BY END USER, 2018–2025 (USD MILLION)
TABLE 32 NORTH AMERICA: MARKET SIZE, BY DEPLOYMENT MODE, 2018–2025 (USD MILLION)
TABLE 33 NORTH AMERICA: MARKET SIZE, BY VERTICAL, 2018–2025 (USD MILLION)
TABLE 34 NORTH AMERICA: MARKET SIZE, BY COUNTRY, 2018–2025 (USD MILLION)
TABLE 35 UNITED STATES: WAN OPTIMIZATION MARKET SIZE, BY COMPONENT, 2018–2025 (USD MILLION)
TABLE 36 UNITED STATES: MARKET SIZE, BY SOLUTION, 2018–2025 (USD MILLION)
TABLE 37 UNITED STATES: MARKET SIZE, BY SERVICE, 2018–2025 (USD MILLION)
TABLE 38 UNITED STATES: MARKET SIZE, BY END USER, 2018–2025 (USD MILLION)
TABLE 39 UNITED STATES: MARKET SIZE, BY DEPLOYMENT MODE, 2018–2025 (USD MILLION)
TABLE 40 CANADA: MARKET SIZE, BY COMPONENT, 2018–2025 (USD MILLION)
TABLE 41 CANADA: MARKET SIZE, BY SOLUTION, 2018–2025 (USD MILLION)
TABLE 42 CANADA: MARKET SIZE, BY SERVICE, 2018–2025 (USD MILLION)
TABLE 43 CANADA: MARKET SIZE, BY END USER, 2018–2025 (USD MILLION)
TABLE 44 CANADA: MARKET SIZE, BY DEPLOYMENT MODE, 2018–2025 (USD MILLION)
TABLE 45 EUROPE: WAN OPTIMIZATION MARKET SIZE, BY COMPONENT, 2018–2025 (USD MILLION)
TABLE 46 EUROPE: MARKET SIZE, BY SOLUTION, 2018–2025 (USD MILLION)
TABLE 47 EUROPE: MARKET SIZE, BY SERVICE, 2018–2025 (USD MILLION)
TABLE 48 EUROPE: MARKET SIZE, BY END USER, 2018–2025 (USD MILLION)
TABLE 49 EUROPE: MARKET SIZE, BY DEPLOYMENT MODE, 2018–2025 (USD MILLION)
TABLE 50 EUROPE: MARKET SIZE, BY VERTICAL, 2018–2025 (USD MILLION)
TABLE 51 EUROPE: MARKET SIZE, BY COUNTRY, 2018–2025 (USD MILLION)
TABLE 52 UNITED KINGDOM: MARKET SIZE, BY COMPONENT, 2018–2025 (USD MILLION)
TABLE 53 UK: MARKET SIZE, BY SOLUTION, 2018–2025 (USD MILLION)
TABLE 54 UNITED KINGDOM: WAN OPTIMIZATION MARKET SIZE, BY SERVICE, 2018–2025 (USD MILLION)
TABLE 55 UNITED KINGDOM: MARKET SIZE, BY END USER, 2018–2025 (USD MILLION)
TABLE 56 UNITED KINGDOM: MARKET SIZE, BY DEPLOYMENT MODE, 2018–2025 (USD MILLION)
TABLE 57 GERMANY: MARKET SIZE, BY COMPONENT, 2018–2025 (USD MILLION)
TABLE 58 GERMANY: MARKET SIZE, BY SOLUTION, 2018–2025 (USD MILLION)
TABLE 59 GERMANY: MARKET SIZE, BY SERVICE, 2018–2025 (USD MILLION)
TABLE 60 GERMANY: MARKET SIZE, BY END USER, 2018–2025 (USD MILLION)
TABLE 61 GERMANY: MARKET SIZE, BY DEPLOYMENT MODE, 2018–2025 (USD MILLION)
TABLE 62 ASIA PACIFIC: WAN OPTIMIZATION MARKET SIZE, BY COMPONENT, 2018–2025 (USD MILLION)
TABLE 63 ASIA PACIFIC: MARKET SIZE, BY SOLUTION, 2018–2025 (USD MILLION)
TABLE 64 ASIA PACIFIC: MARKET SIZE, BY SERVICE, 2018–2025 (USD MILLION)
TABLE 65 ASIA PACIFIC: MARKET SIZE, BY END USER, 2018–2025 (USD MILLION)
TABLE 66 ASIA PACIFIC: MARKET SIZE, BY DEPLOYMENT MODE, 2018–2025 (USD MILLION)
TABLE 67 ASIA PACIFIC: MARKET SIZE, BY VERTICAL, 2018–2025 (USD MILLION)
TABLE 68 ASIA PACIFIC: MARKET SIZE, BY COUNTRY, 2018–2025 (USD MILLION)
TABLE 69 CHINA: WAN OPTIMIZATION MARKET SIZE, BY COMPONENT, 2018–2025 (USD MILLION)
TABLE 70 CHINA: MARKET SIZE, BY SOLUTION, 2018–2025 (USD MILLION)
TABLE 71 CHINA: MARKET SIZE, BY SERVICE, 2018–2025 (USD MILLION)
TABLE 72 CHINA: MARKET SIZE, BY END USER, 2018–2025 (USD MILLION)
TABLE 73 CHINA: MARKET SIZE, BY DEPLOYMENT MODE, 2018–2025 (USD MILLION)
TABLE 74 INDIA: MARKET SIZE, BY COMPONENT, 2018–2025 (USD MILLION)
TABLE 75 INDIA: MARKET SIZE, BY SOLUTION, 2018–2025 (USD MILLION)
TABLE 76 INDIA: MARKET SIZE, BY SERVICE, 2018–2025 (USD MILLION)
TABLE 77 INDIA: MARKET SIZE, BY END USER, 2018–2025 (USD MILLION)
TABLE 78 INDIA: MARKET SIZE, BY DEPLOYMENT MODE, 2018–2025 (USD MILLION)
TABLE 79 MIDDLE EAST AND AFRICA: WAN OPTIMIZATION MARKET SIZE, BY COMPONENT, 2018–2025 (USD MILLION)
TABLE 80 MIDDLE EAST AND AFRICA: MARKET SIZE, BY SOLUTION, 2018–2025 (USD MILLION)
TABLE 81 MIDDLE EAST AND AFRICA: MARKET SIZE, BY SERVICE, 2018–2025 (USD MILLION)
TABLE 82 MIDDLE EAST AND AFRICA: MARKET SIZE, BY END USER, 2018–2025 (USD MILLION)
TABLE 83 MIDDLE EAST AND AFRICA: MARKET SIZE, BY DEPLOYMENT MODE, 2018–2025 (USD MILLION)
TABLE 84 MIDDLE EAST AND AFRICA: MARKET SIZE, BY VERTICAL, 2018–2025 (USD MILLION)
TABLE 85 MIDDLE EAST AND AFRICA: MARKET SIZE, BY COUNTRY, 2018–2025 (USD MILLION)
TABLE 86 UNITED ARAB EMIRATES: WAN OPTIMIZATION MARKET SIZE, BY COMPONENT, 2018–2025 (USD MILLION)
TABLE 87 UNITED ARAB EMIRATES: MARKET SIZE, BY SOLUTION, 2018–2025 (USD MILLION)
TABLE 88 UNITED ARAB EMIRATES: MARKET SIZE, BY SERVICE, 2018–2025 (USD MILLION)
TABLE 89 UNITED ARAB EMIRATES: MARKET SIZE, BY END USER, 2018–2025 (USD MILLION)
TABLE 90 UNITED ARAB EMIRATES: MARKET SIZE, BY DEPLOYMENT MODE, 2018–2025 (USD MILLION)
TABLE 91 KINGDOM OF SAUDI ARABIA: MARKET SIZE, BY COMPONENT, 2018–2025 (USD MILLION)
TABLE 92 KINGDOM OF SAUDI ARABIA: MARKET SIZE, BY SOLUTION, 2018–2025 (USD MILLION)
TABLE 93 KINGDOM OF SAUDI ARABIA: MARKET SIZE, BY SERVICE, 2018–2025 (USD MILLION)
TABLE 94 KINGDOM OF SAUDI ARABIA: MARKET SIZE, BY END USER, 2018–2025 (USD MILLION)
TABLE 95 KINGDOM OF SAUDI ARABIA: MARKET SIZE, BY DEPLOYMENT MODE, 2018–2025 (USD MILLION)
TABLE 96 LATIN AMERICA: WAN OPTIMIZATION MARKET SIZE, BY COMPONENT, 2018–2025 (USD MILLION)
TABLE 97 LATIN AMERICA: MARKET SIZE, BY SOLUTION, 2018–2025 (USD MILLION)
TABLE 98 LATIN AMERICA: MARKET SIZE, BY SERVICE, 2018–2025 (USD MILLION)
TABLE 99 LATIN AMERICA: MARKET SIZE, BY END USER, 2018–2025 (USD MILLION)
TABLE 100 LATIN AMERICA: HEALTHCARE MARKET SIZE, BY DEPLOYMENT MODE, 2018–2025 (USD MILLION)
TABLE 101 LATIN AMERICA: MARKET SIZE, BY VERTICAL, 2018–2025 (USD MILLION)
TABLE 102 LATIN AMERICA: WAN OPTIMIZATION MARKET SIZE, BY COUNTRY, 2018–2025 (USD MILLION)
TABLE 103 BRAZIL: MARKET SIZE, BY COMPONENT, 2018–2025 (USD MILLION)
TABLE 104 BRAZIL: MARKET SIZE, BY SOLUTION, 2018–2025 (USD MILLION)
TABLE 105 BRAZIL: MARKET SIZE, BY SERVICE, 2018–2025 (USD MILLION)
TABLE 106 BRAZIL: MARKET SIZE, BY END USER, 2018–2025 (USD MILLION)
TABLE 107 BRAZIL: MARKET SIZE, BY DEPLOYMENT MODE, 2018–2025 (USD MILLION)
TABLE 108 MEXICO: WAN OPTIMIZATION MARKET SIZE, BY COMPONENT, 2018–2025 (USD MILLION)
TABLE 109 MEXICO: MARKET SIZE, BY SOLUTION, 2018–2025 (USD MILLION)
TABLE 110 MEXICO: MARKET SIZE, BY SERVICE, 2018–2025 (USD MILLION)
TABLE 111 MEXICO: MARKET SIZE, BY END USER, 2018–2025 (USD MILLION)
TABLE 112 MEXICO: MARKET SIZE, BY DEPLOYMENT MODE, 2018–2025 (USD MILLION)
TABLE 113 NEW PRODUCT LAUNCHES, 2018–2019
TABLE 114 BUSINESS EXPANSIONS, 2019
TABLE 115 PARTNERSHIPS, 2018–2019
LIST OF FIGURES (34 FIGURES)
FIGURE 1 RESEARCH DESIGN
FIGURE 2 MARKET SIZE ESTIMATION METHODOLOGY: APPROACH 1 (SUPPLY SIDE): REVENUE OF SOLUTION AND SERVICES OF THE WAN OPTIMIZATION MARKET
FIGURE 3 MARKET SIZE ESTIMATION METHODOLOGY: APPROACH 1 BOTTOM-UP (SUPPLY SIDE): COLLECTIVE REVENUE OF ALL SOLUTION AND SERVICES OF THE MARKET
FIGURE 4 MARKET SIZE ESTIMATION METHODOLOGY: APPROACH 2 TOP-DOWN (DEMAND SIDE): SHARE OF THE WAN OPTIMIZATION MARKET
FIGURE 5 SOLUTION SEGMENT TO HOLD A LARGER MARKET SIZE IN 2020
FIGURE 6 CLOUD SEGMENT TO HOLD A HIGHER MARKET SHARE IN 2020
FIGURE 7 LARGE ENTERPRISES SEGMENT TO HOLD A LARGER MARKET SIZE IN 2020
FIGURE 8 WAN OPTIMIZATION SOLUTION OFFERS USERS WITH QUALITY OF EXPERIENCE AND PRODUCTIVITY
FIGURE 9 SOLUTION SEGMENT AND CHINA TO ACCOUNT FOR LARGE MARKET SHARES IN ASIA PACIFIC IN 2020
FIGURE 10 INDIA TO GROW AT THE HIGHEST CAGR DURING THE FORECAST PERIOD
FIGURE 11 DRIVERS, RESTRAINTS, OPPORTUNITIES, AND CHALLENGES: WAN OPTIMIZATION MARKET
FIGURE 12 SPENDING ON DIGITAL TRANSFORMATION
FIGURE 13 SERVICES SEGMENT TO GROW AT A HIGHER CAGR DURING THE FORECAST PERIOD
FIGURE 14 SOFTWARE-DEFINED WIDE AREA NETWORK SEGMENT TO GROW AT A HIGHER CAGR DURING THE FORECAST PERIOD
FIGURE 15 MANAGED SERVICES SEGMENT TO GROW AT A HIGHER CAGR DURING THE FORECAST PERIOD
FIGURE 16 CLOUD SEGMENT TO GROW AT A HIGHER CAGR DURING THE FORECAST PERIOD
FIGURE 17 SMALL AND MEDIUM-SIZED ENTERPRISES SEGMENT TO WITNESS A HIGHER GROWTH RATE DURING THE FORECAST PERIOD
FIGURE 18 INFORMATION TECHNOLOGY AND TELECOM SEGMENT TO WITNESS THE HIGHEST GROWTH RATE DURING THE FORECAST PERIOD
FIGURE 19 NORTH AMERICA TO EXHIBIT THE LARGEST MARKET SIZE DURING THE FORECAST PERIOD
FIGURE 20 NORTH AMERICA: MARKET SNAPSHOT
FIGURE 21 ASIA PACIFIC: MARKET SNAPSHOT
FIGURE 22 WAN OPTIMIZATION MARKET (GLOBAL) MARKET SHARE RANKING, 2020
FIGURE 23 MARKET (GLOBAL) COMPETITIVE LEADERSHIP MAPPING, 2020
FIGURE 24 PRODUCT PORTFOLIO ANALYSIS OF TOP PLAYERS IN THE MARKET
FIGURE 25 BUSINESS STRATEGY EXCELLENCE OF TOP PLAYERS IN THE MARKET
FIGURE 26 KEY DEVELOPMENTS IN THE WAN OPTIMIZATION MARKET (2018–2019)
FIGURE 27 MARKET EVALUATION FRAMEWORK, 2018–2019
FIGURE 28 CISCO: COMPANY SNAPSHOT
FIGURE 29 CISCO: SWOT ANALYSIS
FIGURE 30 RIVERBED: SWOT ANALYSIS
FIGURE 31 CITRIX: COMPANY SNAPSHOT
FIGURE 32 CITRIX: SWOT ANALYSIS
FIGURE 33 INFOVISTA: SWOT ANALYSIS
FIGURE 34 SILVER PEAK: SWOT ANALYSIS
The study involved four major activities in estimating the current market size of the Wide Area Network optimization market. Exhaustive secondary research was done to collect information on the WAN optimization market. The next step was to validate these findings, assumptions, and sizing with industry experts across the value chain using primary research. Both top-down and bottom-up approaches were employed to estimate the total market size. After that, the market breakup and data triangulation procedures were used to estimate the market size of the segments and subsegments of the WAN optimization market.
Secondary Research
In the secondary research process, various secondary sources such as D&B Hoovers, Bloomberg BusinessWeek, and Dun & Bradstreet were referred to identify and collect information for this study. These secondary sources included annual reports, press releases, and investor presentations of companies; whitepapers, certified publications, and articles by recognized authors; gold standard and silver standard websites; regulatory bodies; trade directories; and databases.
Primary Research
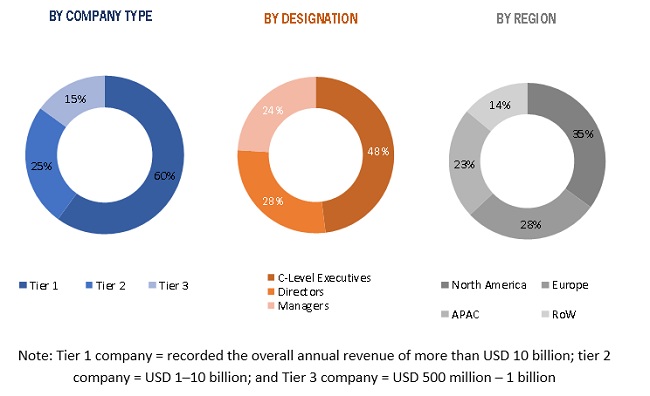
The WAN optimization market comprises several stakeholders, such as WAN optimization vendors, WAN optimization service providers, venture capitalists, government organizations, regulatory authorities, policymakers, financial organizations, consulting firms, research organizations, academic institutions, resellers and distributors, and training providers. The demand side of the WAN optimization market consists of all the firms operating in several industry verticals. The supply side includes WAN optimization providers offering WAN optimization services. Various primary sources from both the supply and demand sides of the market for WAN optimization were interviewed to obtain qualitative and quantitative information. Given below is the breakup of the primary respondents:
To know about the assumptions considered for the study, download the pdf brochure
Market Size Estimation
The top-down and bottom-up approaches were used to estimate and validate the size of the global WAN optimization market and various other dependent submarkets in the overall market. An exhaustive list of all the vendors who offer solutions and services in the market was prepared while using the top-down approach. The market share of all the vendors in the market was estimated through annual reports, press releases, funding, investor presentations, paid databases, and primary interviews. Each vendor was evaluated on the basis of its components (solutions and services). The aggregate of all companies’ revenue was extrapolated to reach the overall market size.
Furthermore, each subsegment was studied and analyzed for its global market size and regional penetration. The markets were triangulated through both primary and secondary research. The primary procedure included extensive interviews for key insights from the industry leaders, such as Chief Executive Officers (CEOs), Vice Presidents (VPs), directors, and managers.
Data Triangulation
After arriving at the overall market size using the market size estimation processes as explained above, the market was split into several segments and subsegments. The data triangulation and market breakup procedures were employed, wherever applicable, to complete the overall market engineering process and arrive at the exact statistics of each market segment and subsegment. The data was triangulated by studying various factors and trends from both demand and supply sides.
Report Objectives
- To determine and forecast the global WAN optimization market based on components (solution and services), solution , services , deployment modes, end user types, verticals, and regions from 2020 to 2025, and analyze various macro and microeconomic factors affecting the market growth
- To forecast the size of the market segments with respect to five main regions: North America, Europe, Asia Pacific (APAC), Latin America, and Middle East and Africa (MEA)
- To provide detailed information about the major factors (drivers, opportunities, threats, and challenges) influencing the growth of the WAN optimization market
- To analyze each submarket with respect to individual growth trends, prospects, and contributions to the total market
- To analyze opportunities in the market for stakeholders by identifying the high-growth segments of the WAN optimization market
- To profile key market players, such as top vendors and startups; provide a comparative analysis based on their business overviews, regional presence, product offerings, business strategies, and key financials; and illustrate the market’s competitive landscape
- To track and analyze competitive developments, such as mergers and acquisitions, new product launches, product enhancements, partnerships, agreements, and collaborations, in the market for WAN optimization
Available customizations
Along with the market data, MarketsandMarkets offers customizations as per the company’s specific needs. The following customization options are available for the report:
Company information
- Detailed analysis and profiling of additional market players (Up to 5)


Growth opportunities and latent adjacency in WAN Optimization Market
What is the SME segment's growth rate in WAN optimization market?