Wired Interface Market by Component Type (USB (USB TYPE C, and Other USB TYPE), HDMI, Thunderbolt, and DisplayPort), Device, and Geography (North America, Europe, Asia Pacific, and Rest of the World) - Global Forecast to 2023


[143 Pages Report] The wired interface market was valued at 6.30 billion units in 2017 and is expected to reach 8.78 billion units by 2023, at a CAGR of 6.2% during the forecast period. The said market was valued at USD 15.31 billion in 2017, and is expected to reach USD 34.72 billion by 2023, at a CAGR of 14.2% between 2018 and 2023. The base year considered for the study is 2017, and the forecast period is between 2018 and 2023.
Use of USB Type C Wired Interface Technology is expected to gain traction from Smartphone and Tablet devices
The wired interface market is greatly influenced by the smartphone market. According to the Cisco VNI forecast, smartphones accounted for 3.6 billion units of all network devices in 2016 and are expected to reach 6.2 billion units by 2021. This is due to the growing adoption of smartphones in Asia Pacific (APAC) and Rest of the World (RoW). The growing adoption of smartphones is expected to propel the demand for USB Type C wired interface technology during the forecast period (2018–2023).
Demand for tablets is expected to increase because of its compact size and processor upgrade. According to the Cisco VNI forecast, tablets accounted for 580.3 million units of all networks devices in 2016 and are expected to grow at a CAGR of 5.3% during the forecast period. The USB wired interface technology is used in tablets for data and power connectivity purposes.
Market Dynamics
Drivers
- Increasing use of smartphones
- Increasing adoption of wired interface connectivity because of low data streaming/transferring capacity of Bluetooth and Wi-Fi technology
Restraints
- Declining shipment of PCs and tablets
Opportunities
- Increasing application of wired interface in new devices
Challenges
- Certification of products
The objective of the report is to provide a detailed analysis of the market based on component type, device, and geography. The report also provides information regarding the major factors (drivers, restraints, opportunities, and challenges) influencing the growth of the wired interface market. In addition, key players in the market have been strategically profiled, and their market ranks and core competencies have been comprehensively analyzed. In addition, the competitive landscape for market players has been studied in detail, along with their growth strategies, such as product launches, product developments, acquisitions, partnerships, expansions, geographical expansion, contracts, and collaborations.
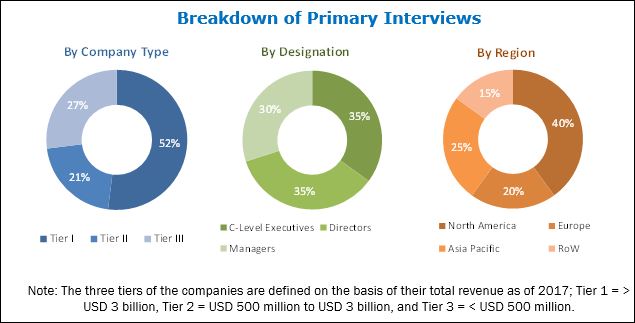
This research study involves the extensive use of secondary sources, directories, and databases (such as annual reports, press releases, journals, company websites, and paid databases) to identify and collect information (OICA, CIPA, and GSA) useful for this study. The entire procedure includes the study of the financial reports of top market players. After arriving at the overall market size, the total market has been split into several segments and subsegments, which have been confirmed with key industry experts, such as CEOs, VPs, directors, and marketing executives. The report also provides size of the market for wired interface for all device and component types. The following figure shows the breakdown of primaries based on company type, designation, and region.
To know about the assumptions considered for the study, download the pdf brochure
Companies such as Molex, Inc. (The US), Amphenol Corporation (The US), Japan Aviation Electronics Industry, Ltd. (Japan), TE Connectivity Ltd. (Switzerland), STMicroelectronics N.V. (Switzerland), NXP Semiconductors N.V. (The Netherlands), Microchip Technology Inc. (The US), Texas Instruments Inc. (The US), Cypress Semiconductor Corp. (The US), Rohm Co., Ltd. (Japan), Hirose Electric Co., Ltd. (Japan), ON Semiconductor Corporation (The US), Analog Devices Inc. (The US), Diodes Inc. (The US), Murata Manufacturing Co. Ltd. (Japan), Vishay Intertechnology, Inc. (The US), Silicon Laboratories Inc. (The US), Maxim Integrated Products, Inc. (The US), CUI, Inc. (The US), and Yamaichi Electronics Co.,Ltd. (Japan) are some of the major players in the wired interface market.
Critical questions which the report answers
- What are new application areas which the wired interface companies are exploring?
- Which are the key players in the market, and how intense is the competition?
- Which devices/industries are lucrative investment pockets of the market?
Target Audience:
- Connector manufacturers
- Semiconductor manufacturers
- Consumer electronics and automotive manufacturers
- Investors (private equity, venture capital, and others)
- Original equipment manufacturers (OEMs)
- Component and device suppliers and distributors
- Government bodies such as regulatory authorities and policymakers
- Research institutes and organizations
- Market research and consulting firms
The wired interface market in this report has been segmented:
By Component Type
-
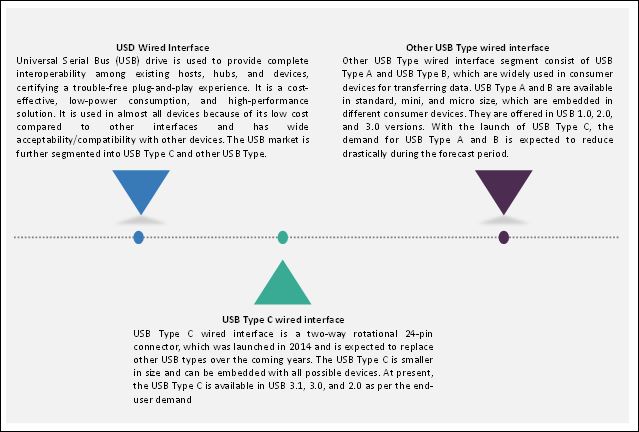
USB
- USB Type C
- Other USB Type
- HDMI
- Thunderbolt
- Display Port
By Device
- Smartphone
- Tablet
- Laptop and Desktop PC
- TV
- Virtual Reality
- Drones
- Gaming Console
- External Hard Disk
- Cameras
- Projector
-
Wearable
- Consumer Electronics
- Healthcare
-
Multimedia Device and Home theatre
- Sound Bar
- Blu-Ray Player
-
Power Bank
- USB 1
- USB 2
- More than 2 USB
- Automobile
- Desktop Monitor
- USB Flash Drive
- Set-top Box
By Geography
-
North America
- US
- Canada
- Mexico
-
Europe
- UK
- Germany
- France
- Rest of Europe
-
Asia Pacific (APAC)
- China
- India
- Japan
- South Korea
- Rest of APAC
-
Rest of the World (RoW)
- South America
- Middle East and Africa
Available Customizations:
With the given market data, MarketsandMarkets offers customizations according to the company’s specific needs. The following customization options are available for the report:
Company Information
- Detailed analysis and profiling of additional market players on the basis of various blocks of the value chain
Application Analysis
- Further breakdown of the device segments
The wired interface market is expected to reach 8.78 billion units by 2023 from 6.51 billion units in 2018, at a CAGR of 6.2% between 2018 and 2023. The said market was valued at USD 17.87 billion in 2018, and is expected to reach USD 34.72 billion by 2023, at a CAGR of 14.2% between 2018 and 2023. Major factors driving the growth of the market include increasing use of consumer devices such as smartphone and increasing demand for wired interface due to its advantage of high data and power transfer capacity over wireless technology.
PCs and laptops are expected to hold the largest share of the wired interface market throughout the forecast period. Most PCs and laptops are equipped with USB, HDMI, DisplayPort, and Thunderport technologies. Demand for PC and laptop is expected to decrease during the forecast period because of the increase in the use of smartphones and tablets. Furthermore, because of the high price of laptops, in developing economies, consumers are delaying buying new PCs/laptops, thus extending the lifecycle of existing PCs/laptops.
The USB Type C wired interface is expected to grow at the highest CAGR during the forecast period. USB Type C wired interface is a two-way rotational 24-pin connector, which is smaller in size and can be embedded with all possible devices. Thus, they are currently being adopted in compact devices such as smartphone, tablets and wearables.
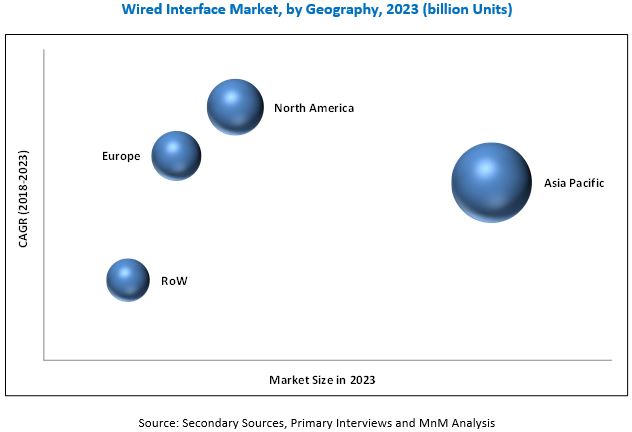
The wired interface market in North America is expected to register the highest CAGR during the forecast period. North America is a hub for technological innovations and an early adopter of new technologies. Factors such as presence of major companies, increasing consumer spending, and growing popularity of advanced devices are driving the market in North America. Asia Pacific accounted for the largest share of the overall market in 2017, with China being one of the major contributors in terms of market size.
Smartphones, tablets, and PCs and laptops will drive the growth of the wired interface market during the forecast period.
Smartphone
The wired interface market is greatly influenced by the smartphone market. According to the Cisco VNI forecast, smartphones accounted for 3.6 billion units of all network devices in 2016 and are expected to reach 6.2 billion units by 2021. This is due to the growing adoption of smartphones in Asia Pacific (APAC) and Rest of the World (RoW). The growing adoption of smartphones is expected to propel the demand for USB Type C wired interface technology during the forecast period (2018–2023).
Tablet
Demand for tablets is expected to increase because of its compact size and processor upgrade. According to the Cisco VNI forecast, tablets accounted for 580.3 million units of all networks devices in 2016 and are expected to grow at a CAGR of 5.3% during the forecast period. The USB wired interface technology is used in tablets for data and power connectivity purposes.
PC & Laptop
Demand for PCs and laptops is expected to decrease during the forecast period because of the increase in the use of smartphones and tablets. Furthermore, because of the high price of laptops, in developing economies, consumers are delaying buying new PCs/laptops, thus extending the lifecycle of existing PCs/laptops, which would indirectly affect the overall market revenue. Most PCs and laptops are equipped with USB, HDMI, DisplayPort, and Thunderport technologies. According to the Cisco VNI forecast, PCs are expected to account for 1.3 billion units of all network devices by 2021, at a CAGR of (2.5%) during the forecast period.
Critical questions the report answers:
- Where will all these developments take the industry in the mid to long term?
- What are the upcoming applications for the wired interface market?
>The shipment of PCs and tablets has witnessed a decline over the past few years. Moreover, the decline in shipment is expected to continue at least for the next couple of years and is attributed to the mature installed base and high replacement cycle of these two products. Despite the growth of overall consumer electronics segment in Asia Pacific, the shipment of PCs and tablets is expected to witness a negligible growth, affected largely by the improved performance of phablets and falling prices of smartphones. Thus, falling shipment of PCs and laptops may adversely impact the growth of the market.
Major players in the wired interface market include Molex, Inc. (The US), Amphenol Corporation (The US), Japan Aviation Electronics Industry, Ltd. (Japan), TE Connectivity Ltd. (Switzerland), STMicroelectronics N.V. (Switzerland), NXP Semiconductors N.V. (The Netherlands), Microchip Technology Inc. (The US), Texas Instruments Inc. (The US), Cypress Semiconductor Corp. (The US), Rohm Co., Ltd. (Japan), Hirose Electric Co., Ltd. (Japan), ON Semiconductor Corporation (The US), Analog Devices Inc. (The US), Diodes Inc. (The US), Murata Manufacturing Co. Ltd. (Japan), Vishay Intertechnology, Inc. (The US), Silicon Laboratories Inc. (The US), Maxim Integrated Products, Inc. (The US), CUI, Inc. (The US), and Yamaichi Electronics Co.,Ltd. (Japan).
These players adopted various strategies such as product developments, acquisitions, partnerships, expansions, and contracts to grow in the wired interface market.
To speak to our analyst for a discussion on the above findings, click Speak to Analyst
Table of Contents
1 Introduction (Page No. - 15)
1.1 Study Objectives
1.2 Definition
1.3 Study Scope
1.3.1 Markets Covered
1.3.2 Geographic Scope
1.3.3 Years Considered for the Study
1.4 Currency
1.5 Limitations
1.6 Stakeholders
2 Research Methodology (Page No. - 19)
2.1 Research Data
2.1.1 Secondary Data
2.1.1.1 List of Major Secondary Sources
2.1.2 Primary Data
2.1.2.1 Primary Sources
2.1.2.2 Key Industry Insights
2.1.2.3 Breakdown of Primaries
2.2 Market Size Estimation
2.2.1 Bottom-Up Approach
2.2.2 Top-Down Approach
2.3 Market Breakdown & Data Triangulation
2.4 Research Assumptions
3 Executive Summary (Page No. - 27)
4 Premium Insights (Page No. - 30)
4.1 Attractive Opportunities for the Wired Interface Market
4.2 Market, By Device
4.3 Market, By Component Type
4.4 Market, By Geography
5 Market Overview (Page No. - 33)
5.1 Introduction
5.2 Market Dynamics
5.2.1 Drivers
5.2.1.1 Increasing Use of Smartphones
5.2.1.2 Increasing Adoption of Wired Interface Connectivity Because of Low Data Streaming/Transferring Capacity of Bluetooth and Wi-Fi Technology
5.2.1.3 Proliferation of Automotive Infotainment
5.2.2 Restraints
5.2.2.1 Declining Shipment of PCS and Tablets
5.2.2.2 Overall Drop in Global Commodity Prices
5.2.3 Opportunities
5.2.3.1 Increasing Demand for Drone Market
5.2.3.2 Increasing Application of Wired Interface in New Devices
5.2.4 Challenges
5.2.4.1 Certification of Products
5.3 Value Chain Analysis
5.3.1 Research & Development
5.3.2 Manufacturing and Assembly
5.3.3 Distribution, Sales and Marketing
6 Wired Interface Market, By Component (Page No. - 39)
6.1 Introduction
6.2 USB Wired Interface
6.2.1 USB Type C Wired Interface
6.2.2 Other USB Type Wired Interface
6.3 Hdmi Wired Interface
6.4 Displayport Wired Interface
6.5 Thunderbolt Wired Interface
7 Wired Interface Market, By Device (Page No. - 52)
7.1 Introduction
7.2 Smartphone
7.3 Tablet
7.4 PC and Laptop
7.5 Television
7.6 Virtual Reality
7.7 Drones
7.8 Gaming Console
7.9 External Hard Disk
7.10 Camera
7.11 Projector
7.12 Wearable
7.13 Home Theatre and Multimedia Device
7.14 Power Bank
7.15 Automotive
7.16 Display Monitor
7.17 USB Flash Drive
7.18 Set-Top Box
8 Geographic Analysis (Page No. - 79)
8.1 Introduction
8.2 North America
8.3 Europe
8.4 APAC
8.5 RoW
9 Competitive Landscape (Page No. - 91)
9.1 Overview
9.2 Market Ranking Analysis
9.3 Competitive Scenario
9.3.1 Product Launches and Developments
9.3.2 10 Most Recent Partnerships, Contracts, Acquisitions, and Agreements
10 Company Profiles (Page No. - 95)
(Business Overview, Products & Solutions Offered, Recent Developments, SWOT Analysis, and MnM View)*
10.1 Key Players
10.1.1 Molex Inc.
10.1.2 Amphenol Corporation
10.1.3 Japan Aviation Electronics Industry, Ltd.
10.1.4 TE Connectivity Ltd.
10.1.5 Stmicroelectronics N.V.
10.1.6 NXP Semiconductors N.V.
10.1.7 Microchip Technology Inc
10.1.8 Texas Instruments Inc
10.1.9 Cypress Semiconductor Corp.
10.1.10 Rohm Co., Ltd.
10.1.11 Hirose Electric Co., Ltd.
10.1.12 on Semiconductor Corporation
10.1.13 Analog Devices Inc.
10.1.14 Diodes Inc.
10.1.15 Murata Manufacturing Co. Ltd.
10.1.16 Vishay Intertechnology, Inc.
10.1.17 Silicon Laboratories Inc.
10.1.18 Maxim Integrated Products, Inc.
10.1.19 CUI, Inc.
10.1.20 Yamaichi Electronics Co. Ltd.
*Details on Business Overview, Products & Solutions Offered, Recent Developments, SWOT Analysis, and MnM View Might Not Be Captured in Case of Unlisted Companies.
11 Appendix (Page No. - 137)
11.1 Insights of Industry Experts
11.2 Discussion Guide
11.3 Knowledge Store: Marketsandmarkets’ Subscription Portal
11.4 Available Customizations
11.5 Related Reports
11.6 Author Details
List of Tables (84 Tables)
Table 1 Wired Interface Market 2016–2023 (USD Million)
Table 2 Market, By Component, 2016–2023 (USD Million)
Table 3 Market, By Component, 2016–2023 (Units Million)
Table 4 USB Wired Interface, By Device, 2016–2023 (USD Million)
Table 5 USB Wired Interface, By Device, 2016–2023 (Million Units)
Table 6 USB Type C Wired Interface Market, By Device, 2016–2023 (Million Units)
Table 7 USB Type C Market, By Region, 2016–2023 (Million Units)
Table 8 Other USB Type Wired Interface Market, By Device, 2016–2023 (Million Units)
Table 9 Other USB Type Market, By Region, 2016–2023 (Million Units)
Table 10 HDMI Wired Interface Market, By Device, 2016–2023 (USD Million)
Table 11 HDMI Market, By Device, 2016–2023 (Million Units)
Table 12 HDMI Wired Interface Market, By Region, 2016–2023 (Million Units)
Table 13 Displayport Wired Interface Market, By Device, 2016–2023 (USD Million)
Table 14 Displayport Market, By Device, 2016–2023 (Million Units)
Table 15 Displayport Wired Interface Market, By Region, 2016–2023 (Million Units)
Table 16 Thunderbolt Wired Interface Market, By Device, 2016–2023 (USD Million)
Table 17 Thunderbolt Market, By Device, 2016–2023 (Million Units)
Table 18 Thunderbolt Market, By Region, 2016–2023 (Million Units)
Table 19 Market, By Device, 2014–2023 (USD Million)
Table 20 Market, By Device, 2014–2023 (Million Units)
Table 21 Market for Smartphone, By Component, 2016–2023 (USD Million)
Table 22 Market for Smartphone, By Component, 2016–2023 (Million Units)
Table 23 Market for Smartphone, By Region, 2016–2023 (Million Units)
Table 24 Market for Tablet, By Component, 2016–2023 (USD Million)
Table 25 Market for Tablet, By Component, 2016–2023 (Million Units)
Table 26 Market for Tablet, By Region, 2016–2023 (Million Units)
Table 27 Market for PC and Laptop, By Component, 2016–2023 (USD Million)
Table 28 Market for PC and Laptop, By Component, 2016–2023 (Million Units)
Table 29 Market for PC and Laptop, By Region, 2016–2023 (Million Units)
Table 30 Market for Television, By Component, 2016–2023 (USD Million)
Table 31 Market for Television, By Component, 2016–2023 (Million Units)
Table 32 Market for Television, By Region, 2016–2023 (Million Units)
Table 33 Market for Virtual Reality, By Component, 2016–2023 (USD Million)
Table 34 Market for Virtual Reality, By Component, 2016–2023 (Million Units)
Table 35 Market for Virtual Reality, By Region, 2016–2023 (Million Units)
Table 36 Market for Drones, By Component, 2016–2023 (USD Million)
Table 37 Market for Drones, By Component, 2016–2023 (Million Units)
Table 38 Market for Drones, By Region, 2016–2023 (Million Units)
Table 39 Market for Gaming Console, By Component, 2016–2023 (USD Million)
Table 40 Market for Gaming Console, By Component, 2016–2023 (Million Units)
Table 41 Market for Gaming Console, By Region, 2016–2023 (Million Units)
Table 42 Market for External Hard Disk, By Component, 2016–2023 (USD Million)
Table 43 Market for External Hard Disk, By Component, 2016–2023 (Million Units)
Table 44 Market for External Hard Disk, By Region, 2016–2023 (Million Units)
Table 45 Market for Camera, By Component, 2016–2023 (USD Million)
Table 46 Market for Camera, By Component, 2016–2023 (Million Units)
Table 47 Market for Camera, By Region, 2016–2023 (Million Units)
Table 48 Wired Interface Market for Projector, By Component, 2016–2023 (USD Million)
Table 49 Market for Projector, By Component, 2016–2023 (Million Units)
Table 50 Market for Projector, By Region, 2016–2023 (Million Units)
Table 51 Market for Wearable, By Component, 2016–2023 (USD Million)
Table 52 Market for Wearable, By Component, 2016–2023 (Million Units)
Table 53 Market for Wearable, By Region, 2016–2023 (Million Units)
Table 54 Market for Home Theatre and Multimedia Device, By Component, 2016–2023 (USD Million)
Table 55 Market for Home Theatre and Multimedia Device, By Component, 2016–2023 (Million Units)
Table 56 Market for Home Theatre and Multimedia Device, By Region, 2016–2023 (Million Units)
Table 57 Market for Power Bank, By Component, 2016–2023 (USD Million)
Table 58 Market for Power Bank, By Component, 2016–2023 (Million Units)
Table 59 Market for Power Bank, By Region, 2016–2023 (Million Units)
Table 60 Market for Automotive, By Component, 2016–2023 (USD Million)
Table 61 Market for Automotive, By Component, 2016–2023 (Million Units)
Table 62 Market for Automotive, By Region, 2016–2023 (Million Units)
Table 63 Market for Display Monitor, By Component, 2016–2023 (USD Million)
Table 64 Market for Display Monitor, By Component, 2016–2023 (Million Units)
Table 65 Market for Display Monitor, By Region, 2016–2023 (Million Units)
Table 66 Market for USB Flash Drive, By Component, 2016–2023 (USD Million)
Table 67 Market for USB Flash Drive, By Component, 2016–2023 (Million Units)
Table 68 Market for USB Flash Drive, By Region, 2016–2023 (Million Units)
Table 69 Market for Set-Top Box, By Component, 2016–2023 (USD Million)
Table 70 Market for Set-Top Box, By Component, 2016–2023 (Million Units)
Table 71 Market for Set-Top Box, By Region, 2016–2023 (Million Units)
Table 72 Market, By Region, 2016–2023 (USD Million)
Table 73 Market, By Region, 2016–2023 (Million Units)
Table 74 North America Wired Interface Market, By Country, 2016–2023 (USD Million)
Table 75 North America Market, By Country, 2016–2023 (Million Units)
Table 76 Europe Market, By Country, 2016–2023 (USD Million)
Table 77 Europe Market, By Country, 2016–2023 (Million Units)
Table 78 Asia Pacific Wired Interface Market, By Country, 2016–2023 (USD Million)
Table 79 Asia Pacific Market, By Country, 2016–2023 (Million Units)
Table 80 Rest of the World Market, By Country, 2016–2023 (USD Million)
Table 81 Rest of the World Market, By Country, 2016–2023 (Million Units)
Table 82 Wired Interface Manufacturers
Table 83 10 Most Recent Product Launches in the Market
Table 84 Partnerships, Contracts, and Agreements in the Market
List of Figures (44 Figures)
Figure 1 Market: Segmentation
Figure 2 Market: Research Design
Figure 3 Bottom-Up Approach
Figure 4 Top-Down Approach to Arrive at the Market Size
Figure 5 Data Triangulation
Figure 6 Assumptions of the Research Study
Figure 7 Market Snapshot 2016–2023 (Million Units)
Figure 8 Market, By Device, 2016–2023 (Million Units)
Figure 9 Market, By Component, 2016–2023 (Million Units)
Figure 10 Market, By Region
Figure 11 USB to Drive Growth of the Market During the Forecast Period
Figure 12 Smartphone Expected to Hold the Largest Share of the Market By 2023
Figure 13 USB Type C Segment is Expected to Hold the Largest Share of the Market During the Forecast Period
Figure 14 Market in North America Expected to Witness the Highest CAGR During 2018–2023
Figure 15 Drivers, Restraints, Opportunities, and Challenges for Market
Figure 16 Value Chain Analysis
Figure 17 USB is Expected to Witness Highest CAGR in Market During Forecast Period
Figure 18 Virtual Reality Expected to Witness Highest CAGR in Market During Forecast Period
Figure 19 Geographic Snapshot of the Market
Figure 20 North America: Snapshot of Market
Figure 21 Europe: Snapshot of Market
Figure 22 APAC: Snapshot of Market
Figure 23 RoW: Snapshot of Market
Figure 24 Companies in the Market Adopted Contract as the Key Growth Strategy Between January 2015 and February 2018
Figure 25 Market Evaluation Framework
Figure 26 Amphenol Corporation : Company Snapshot
Figure 27 Japan Aviation Electronics Industry, Ltd.: Company Snapshot
Figure 28 TE Connectivity Ltd. : Company Snapshot
Figure 29 Stmicroelectronics N.V. : Company Snapshot
Figure 30 NXP Semicondcutors N.V. : Company Snapshot
Figure 31 Microchip Technology Inc : Company Snapshot
Figure 32 Texas Instruments Inc : Company Snapshot
Figure 33 Cypress Semiconductor Corp. : Company Snapshot
Figure 34 Rohm Co., Ltd. : Company Snapshot
Figure 35 Hirose Electric Co., Ltd. : Company Snapshot
Figure 36 on Semiconductor Corporation : Company Snapshot
Figure 37 Analog Devices Inc. : Company Snapshot
Figure 38 Diodes, Inc. : Company Snapshot
Figure 39 Murata Manufacturing Co. Ltd. : Company Snapshot
Figure 40 Vishay Intertechnology, Inc. : Company Snapshot
Figure 41 Silicon Laboratories Inc. : Company Snapshot
Figure 42 Maxim Integrated Products, Inc. : Company Snapshot
Figure 43 CUI Global, Inc. : Company Snapshot
Figure 44 Yamaichi Electronics Co. Ltd. : Company Snapshot


Growth opportunities and latent adjacency in Wired Interface Market