Connected Car Market

Connected Car Market by Service ICE & EV (OTA, Navigation, Multimedia Streaming, Social Media, eCall, Autopilot, Remote Diagnostics, Home Integration), Market (OEM, Aftermarket), Network, Form, Transponder, Hardware and Region - Global Forecast to 2030

Report Code: AT 5974 Jun, 2024, by marketsandmarkets.com

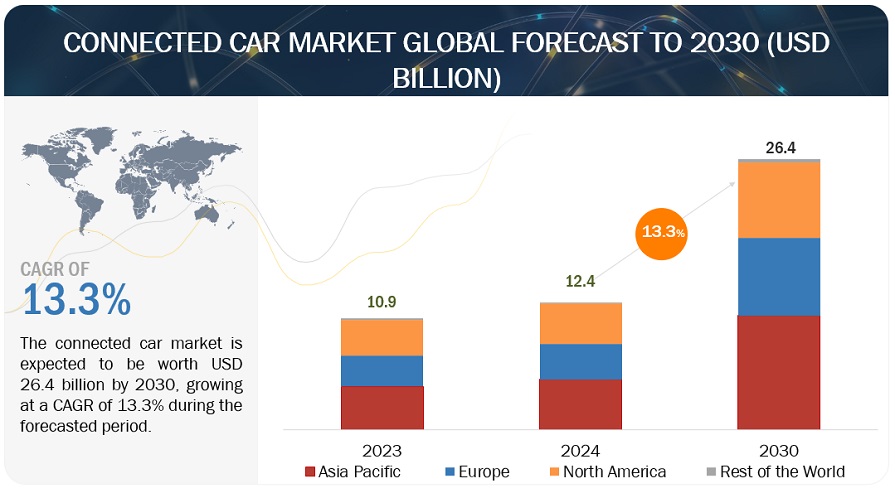
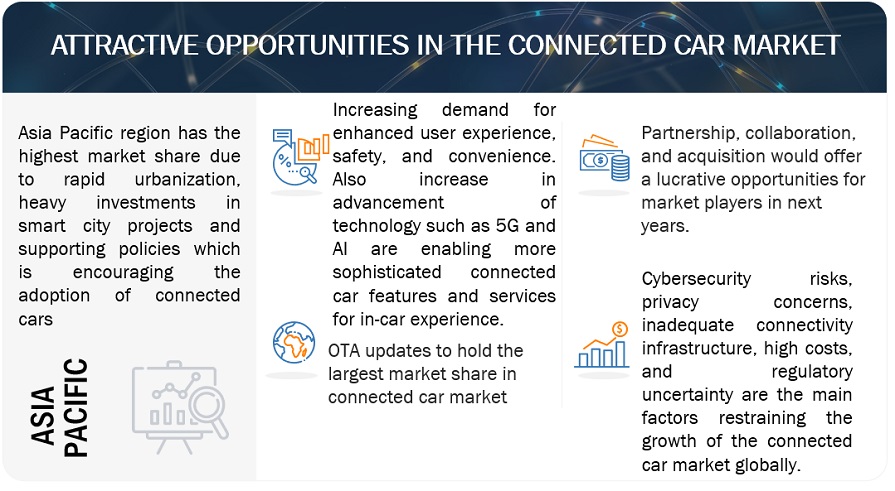
[387 Pages Report] The global connected car market is projected to grow from USD 12.4 Billion in 2024 to USD 26.4 Billion by 2030 at a CAGR of 13.3%. The connected car market is experiencing exponential growth, driven by various factors. Foremost is the surging consumer demand for constant connectivity and reliance on technology, particularly among tech-savvy populations. This insatiable need for connectivity is being met by rapid advancements in automotive technology, such as the rollout of 5G networks and AI-powered features. Governments are also playing a catalyzing role, with regulations like the US Department of Transportation's mandate for vehicle-to-vehicle communication technology in new cars. The popularity of automation, ridesharing, and mobility services is further propelling the connected car market. Finally, the increasing production and sales of vehicles, especially luxury models, supplement this dynamic sector's growth.
Connected Car Market

To know about the assumptions considered for the study, Request for Free Sample Report
Connected Car Market Opportunities

To know about the assumptions considered for the study, download the pdf brochure

Market Dynamics

DRIVER: Increasing Adoption of Telematics and usage-based Insurance

Telematics has merged into the automotive mainstream at a rapid rate. Car telematics help improve driving behavior and road safety and align insurance premiums via usage-based insurance (UBI). According to GSMA (Global System for Mobile Communications), the telematics industry is estimated to reach USD 750 billion by 2030. There are two significant reasons for the growth of the telematics industry. First is governments' increasing willingness to mandate telematics services such as emergency-call capabilities, which is already happening in the European Union and Russia. Second is the increasing demand for excellent connectivity and intelligence in vehicles. Also, the automotive telematics market is projected to grow from USD 9,041.6 million in 2024 to USD 16,111.0 million by 2030, at a CAGR of 10.1% from 2024 to 2030. This growth is driven by the increasing demand for vehicles with telematics services, growing concerns regarding safety in the event of breakdown and accidents, rising demand for advanced technologies, and the high purchasing power of consumers. Stolen vehicle assistance, insurance-based assessment, and other advanced services are aiding manufacturers in enhancing vehicles' overall safety and efficiency.

RESTRAINT: Lack of infrastructure for the proper functioning of connected cars

Vehicles are not connected to the cloud or one other because of the restricted network connectivity on highways. Compared to industrialized economies, the expansion of IT infrastructure on highways is occurring more slowly in developing nations like Mexico, Brazil, and India. The necessary 4G-LTE and 3G communication networks are only available in urban and semi-urban areas. Low connection is a problem even though many third-party logistics companies operate in rural and semi-urban areas. As a result, developing the connected automobile industry in developing nations may need more IT and communication infrastructure in these areas and a delay in governmental regulations. Additionally, industry participants may be subject to national telecom laws, such as those about legal intercept and in-country entity requirements, as telecom service providers. It will be necessary to discuss and regulate the cross-border use cases and the interoperability of the various platforms. Our reliance on data networks also brings up the issue of net neutrality—in which internet service providers give some data transmission priority.

OPPORTUNITY: Development of ridesharing and mobility services

Connected autonomous car technology is quickly evolving, and several companies are focusing on this technology, with Tesla leading the way. Autonomous self-driving vehicles are expected to create ridesharing and mobility services opportunities. For instance, Waymo already has driverless cars picking up passengers, while General Motors plans to roll out its service by the end of 2019. Ford indicates it will have a self-driving fleet ready for ridesharing by 2021. Ridesharing and other mobility services with autonomous cars will require a strong IoT backup, as accessing all the services would require connected vehicles and devices. Wi-Fi, 4G, GPS, Bluetooth, and 5G (upcoming) are vital in ridesharing. With the growing number of connected devices, ridesharing will be accessible to a more extensive user base in the future than it is today. Technological advancements in electric vehicles will increase the demand for autonomous vehicles. Shared mobility is also a key growth driver for autonomous vehicles. As people are comfortable sharing rides, it opens revenue doors for ride-sharing companies and mobility service providers. Currently, semi-autonomous vehicles are used in some of the ride-sharing services. Developing connected autonomous vehicles would drive ride-sharing growth as these vehicles do not require drivers and, hence, can reduce costs for service providers. Ridesharing with connected autonomous vehicles would increase the profits of service providers as there will be no share of drivers in the rides. Tesla plans to launch the first robotaxi as part of a broader vision for an autonomous ride-sharing network by 2020. Tesla estimates that running a robotaxi would cost around USD 0.18 or less per mile. This would challenge the USD 2–3 gasoline-powered ride-sharing vehicles per mile. It is a disruptive technology that can lead to the development of new mobility models and provide vast opportunities for ride-sharing and other mobility services.

CHALLENGE: Cybersecurity

The connected car market faces significant cybersecurity risks that must be addressed to ensure driver safety and data privacy. Poorly designed vehicle architectures can allow hackers to remotely access critical systems like brakes and steering, potentially causing accidents. Connected cars also collect vast amounts of personal data, which could be breached and used for identity theft. For example, in 2015, researchers demonstrated how they could remotely hack a Jeep Cherokee, taking control of the vehicle's functions and turning off the engine on the highway. Overcoming these challenges requires robust security measures from automakers, like solid encryption and regular software updates, and collaboration with suppliers and regulators to establish global cybersecurity standards. Prioritizing cybersecurity is crucial for the connected car market to reach its full potential while maintaining consumer trust.

Connected Car Market Ecosystem.

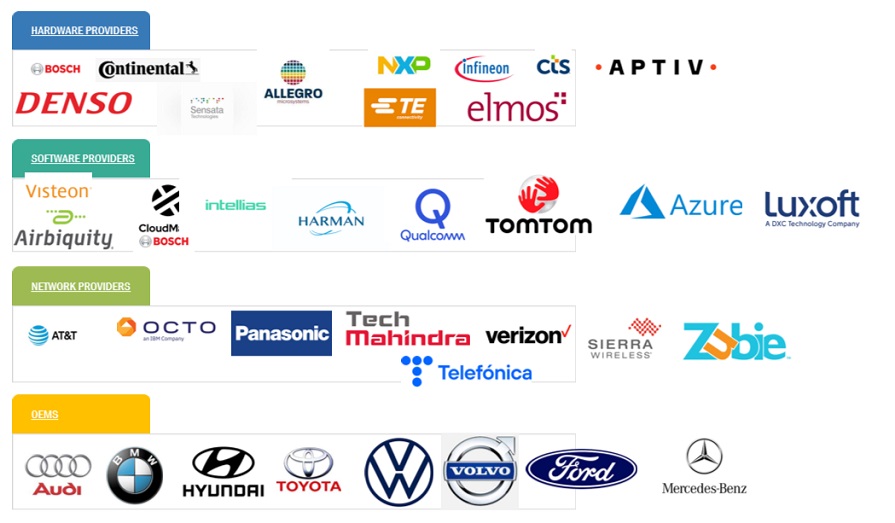
The major connected car market companies have the latest technologies, diversified portfolios, and global distribution networks. The major players in the connected car market include Continental AG (Germany), Robert Bosch GmbH (Germany), Harman International (US), Visteon (US), and Airbiquity Inc (US).
Top Companies in Connected Car Market

The embedded connectivity segment is estimated to be the largest market during the forecast period.

Embedded systems dominate the connected car market globally due to their seamless integration with vehicles, cost optimization benefits, and ability to meet regulatory requirements. Automakers leverage embedded solutions to comply with government mandates like the eCall system in Europe and California's OBD II standards, ensuring vehicles are equipped with essential connectivity features. Embedded systems also enable automakers to offer cloud-based services such as remote diagnostics, over-the-air updates, and real-time traffic information, enhancing the overall driving experience while optimizing consumer costs. For instance, Tesla's (US) vehicles highlighted the power of embedded connectivity by providing features like remote diagnostics and over-the-air updates through a fully integrated system that sends vehicle data to the cloud for immediate assistance.

The demand for safety and security features further drives the preference for embedded systems, as they facilitate critical functionalities like automatic emergency calling (eCall) and remote diagnostics. Embedded solutions offer a reliable and comprehensive approach to connectivity, ensuring an essential level of integration with the vehicle's electrical architecture for enhanced performance and security. As the connected car market continues to evolve, embedded systems are poised to maintain their dominance by providing a robust foundation for advanced features and services that cater to the growing needs of consumers and regulatory standards worldwide.

trong>Aftermarket is the fastest-growing segment in the connected car market.

The aftermarket provides a more affordable and accessible option for consumers to add connectivity features to their existing vehicles. Aftermarket solutions like dongles that plug into the OBD-II port are significantly cheaper than buying a new connected car from the dealer. This makes connected car technology available to more consumers who cannot afford a new connected vehicle. Also, the aftermarket allows consumers to customize their connectivity features based on their specific needs and preferences. Aftermarket providers offer a wide range of products like WiFi hotspots, vehicle tracking devices, and dashcams that can be easily installed in any vehicle. For instance, companies like Pioneer (Japan) and Kenwood (US) offer advanced infotainment systems that include GPS navigation, Bluetooth connectivity, and smartphone integration at a fraction of the cost of new car models equipped with similar features. This makes it easier for a broader range of consumers to enjoy the benefits of connected car technology without purchasing a new vehicle. Also, ERM Advanced Telematics (Israel) launched StarLink Tracker in January 2023, an aftermarket device that integrates advanced vehicle tracking, driver behavior monitoring, theft prevention, Short-Range wireless communication, Wi-Fi, and 4G capabilities in a single device.

Also, the aftermarket is benefiting from the increasing popularity of vehicle sharing and rental services. Companies like Uber (US) and Lyft (US) are equipping their rental fleets with aftermarket connectivity solutions to enable driver monitoring, navigation, and in-vehicle entertainment features. As the sharing economy grows, so will the demand for aftermarket connected car technology in commercial fleets. For instance, Verizon Connect (US) offers a range of aftermarket telematics devices that can be easily installed in any vehicle to provide fleet management capabilities like GPS tracking, driver behavior monitoring, and fuel usage reporting. This allows businesses to optimize fleet operations and reduce costs without purchasing new connected vehicles. Hence, the aftermarket segment is the fastest-growing segment in the connected car market due to its affordability, customizability, and applicability to the sharing economy. As consumer demand for connectivity rises, the aftermarket will play an increasingly vital role in making connected car technology accessible to the masses.

Onboard unit to hold the largest market share in the connected car market

The onboard unit (OBU) segment stands out as a pivotal component in the connected car market, serving as the central nervous system of modern vehicles. This OBU acts as the brain and starts communication among various vital functions. It gathers data from sensors across the vehicle, monitoring engine performance, tire pressure, and GPS location, relaying to a central server or cloud platform. This data fuels essential features like remote diagnostics, emergency assistance, and even stolen vehicle tracking, exemplified by General Motors (US) OnStar system, offering services such as roadside assistance and diagnostic reports to keep drivers informed and safe. Beyond data collection, OBUs are the gateway to a realm of advanced connected car functionalities, providing real-time traffic updates, weather alerts, and in-car Wi-Fi hotspots for continuous connectivity on the go. Moreover, OBUs play a critical role in Advanced Driver-Assistance Systems (ADAS), such as automatic emergency braking and lane departure warnings, leveraging sensor data processed in real-time. For instance, Tesla's (US) Autopilot system utilizes OBUs to interpret camera and radar data, enabling precise control of steering and braking to enhance safety by avoiding collisions and maintaining lane integrity, highlighting the pivotal role OBUs play in driving technological advancements for safer journeys.

The dominance of OBUs is underscored by their market size, with the global On-Board Diagnostics (OBD) market, a subset of the OBU segment, projected a CAGR of 54.6% from 2024–2030. This growth rate highlights the indispensable role OBUs play in the connected car market, ensuring seamless communication, enabling advanced features, and shaping the future landscape of connected vehicles. As the automotive industry continues to evolve, OBUs will remain at the core, facilitating innovation, enhancing safety, and driving the next phase of connected car technology.

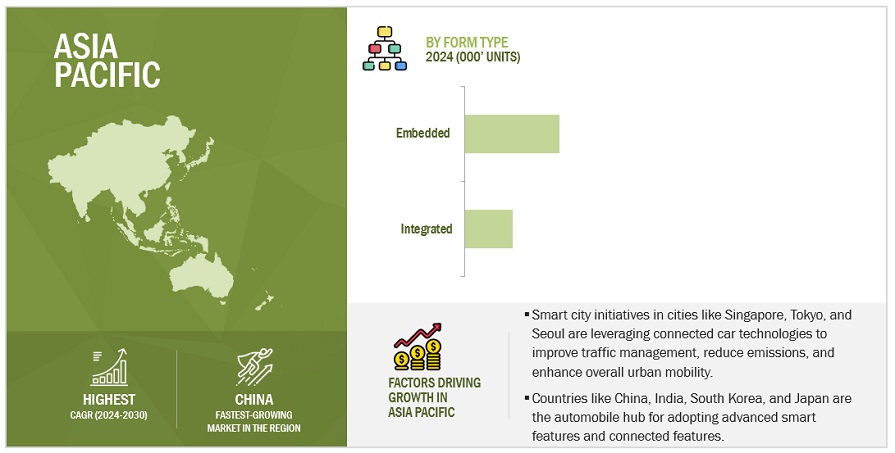
Asia Pacific connected car market is expected to hold the largest market share during the forecast period.

The Asia Pacific region is poised to lead the growth in the connected car market, driven by factors that highlight its potential as a key player in the automotive industry. China is at the forefront of this growth trajectory, fueled by its expanding economies and increasing connectivity infrastructures. For instance, China, the world's largest automotive market, is witnessing a surge in connected car adoption, with companies like Geely (China) and BYD (China) incorporating advanced connectivity features to fulfill consumer demands. Moreover, in September 2022, Changan Automobile (China) launched a new brand 'Zhuge Intelligence' offering various vehicle connectivity services and unveiled the CD701 Prototype, its first vehicle built on the new SDA platform. Also, in a developing country like India, in December 2022, Tata Motors displayed its connected car technology, advanced driver assistance systems (ADAS), and hydrogen as a fuel alternative at the Auto Expo 2023.

Moreover, key players are investing continuously in plant expansion and partnerships with other technology providers to increase their presence. For instance, in March 2022, Hyundai (South Korea) inaugurated its first manufacturing facility in ASEAN, located in Indonesia, with an investment of USD 1.55 billion. With an annual capacity of 250,000 units, the facility produces models equipped with the latest connectivity features for Creta, Santa Fe, Tucson, Stargazer, and IONIQ 5. Also, In June 2022, Qualcomm Technologies Inc. (US) expanded its relationship with PATEO Corporation (China) to develop Next-Generation Qinggan Intelligent Cockpit Platform Solutions, focusing on intelligence, smart car connectivity, service-oriented architecture (SOA), and intelligent cockpits based on central controllers.

Furthermore, innovative city initiatives in the Asia Pacific region are reshaping urban mobility and fostering the growth of connected vehicles. Cities like Singapore and Seoul are investing in smart infrastructure to support connected mobility, with initiatives like intelligent traffic management systems and electric vehicle charging networks gaining traction. In Singapore, the Smart Nation initiative includes projects like autonomous vehicle trials and intelligent traffic management systems, creating a conducive environment for adopting connected cars. These developments highlight the region's initiative-taking approach towards sustainable and efficient transportation solutions, positioning it as a hub for connected car innovation and growth in the coming years.
Asia Pacific Connected Car Market Size, and Share

Key Market Players

Major manufacturers in the connected car market include Continental AG (Germany), Robert Bosch GmbH (Germany), Harman International (US), Visteon (US), Airbiquity Inc. (US), Cloudmade (UK), Intellias (Ukraine), Tesla (US), Ford Motors (US), Audi (Germany), AT&T (US), Qualcomm Technologies Inc. (US), Verizon (US), TomTom International BV. (Netherlands), Sierra Wireless (Canada), APTIV (Ireland), SPA (Italy), Panasonic (South Korea), Microsoft Azure (US), Telefonica (Spain), and Geotab (Canada).

Get online access to the report on the World's First Market Intelligence Cloud

  • Easy to Download Historical Data & Forecast Numbers
  • Company Analysis Dashboard for high growth potential opportunities
  • Research Analyst Access for customization & queries
  • Competitor Analysis with Interactive dashboard
  • Latest News, Updates & Trend analysis
Request Sample

Scope of the Report

Report Attribute

Details

Market size available for years

2019–2030

Base year considered

2023

Market Growth forecast 

USD 26.4 Billion by 2030 from USD 12.4 Billion in 2024 at 13.3% CAGR

Forecast period

2024–2030

Forecast units

Value (USD Million/USD Thousand)

Segments Covered

By service, by end market, by form type, by hardware, EV by vehicle type, by transponder, and by network

Geographies covered

Asia Pacific, North America, Europe, and Rest of the World

Top Players

Continental AG (Germany), Robert Bosch GmbH (Germany), Harman International (US), Airbiquity (US), Visteon (US), Cloudmade (UK), Intellias (Ukraine), Tesla (US), Ford Motor Company (US), Audi (Germany), AT&T (US), Qualcomm Technologies, Inc. (US), Verizon (US), TomTom International BV. (Netherlands), Sierra Wireless (Canada)
A total of 30 other major players covered

With the given market data, MarketsandMarkets offers customizations per the company's specific needs.

The study segments the connected car Market:

Connected Car Market, By Service
  • Navigation
  • Remote diagnostics
  • Multimedia streaming
  • Social media & other apps
  • OTA updates
  • On-road assistance
  • eCall & SOS assistance
  • Remote operation
  • Auto parking/connected parking
  • Autopilot
  • home integration
  • Stolen Vehicle Recovery/Warning
Connected Car Market, By End Market
  • OEM
  • Aftermarket
Connected Car Market By Form Type
  • Embedded
  • Integrated
Connected Car Market, By Hardware
  • Head Unit.
  • Central gateway
  • Intelligent antenna
  • Electronic control unit
  • Telematics control unit
  • Keyless entry system
  • Sensor
Connected Car Market By Transponder
  • Onboard unit
  • Roadside unit
Connected Car Market, By Network
  • DSRC
  • Cellular
Connected Electric Car Market, By Vehicle Type
  • BEV
  • PHEV
  • FCEV

Recent Developments

  • In February 2024, The Continental Introduces a New Digital Tool to Check Truck Tires, known as ContiConnect Lite. It bridges tire sensors and tire management, offering an accessible gateway to selected ContiConnect features via smartphone. This tool allows fleets and truck drivers to access tire data, manage up to five vehicles, and receive alerts for tire conditions, enhancing safety, reducing breakdowns and maintenance costs, and improving fuel efficiency. ContiConnect Lite is particularly beneficial for smaller fleets using intelligent tires or Generation II sensors, requiring no additional hardware and providing convenience through the ContiConnect On-Site app available on IOS and Android versions.
  • In February 2024, Harman International launched the HARMAN Ready Connect 5G Telematics Control Unit (TCU), a significant advancement in automotive connectivity that leverages Qualcomm Technologies, Inc. (US) Snapdragon Digital Chassis. The 5G-enabled TCU is designed to deliver rich in-cabin experiences for consumers while reducing time to market and engineering efforts for automakers. It offers features like enhanced traffic notifications, communication between the car and the environment, and improved connected mobility experiences focused on entertainment, productivity, and situational awareness. The future-proof solution provides modular hardware upgradability and a scalable software architecture to maximize reuse across product variants, highlighting Harman and Qualcomm's collaboration to revolutionize automotive connectivity.
  • In February 2024, Karma Automotive's recent acquisition of Airbiquity's technology assets and software product portfolio marks a significant step towards enhancing its connected vehicle solutions. With Airbiquity's expertise in over-the-air updates, software development tools, data management, and analytics, developed over two Decades ago, Karma aimed to integrate these capabilities into its Karma Cloud Services and embedded vehicle technology. This strategic move expands Karma's technological offerings and positions them to deliver software-defined and continuously connected vehicles, leveraging Airbiquity's established solutions deployed globally across diverse transportation industry customers.
  • In September 2023, Robert Bosch GmbH introduced video perception software as a standalone product that can be used independently of any hardware, providing automakers with maximum flexibility by allowing the software to be used on diverse SoCs (systems on chips). This software-based solution is crucial in transitioning from assisted to automated driving and parking, capturing and processing image data of the vehicle's surroundings to enable various driver assistance and automated driving functions. Bosch's innovative approach in offering video perception software independently highlights its commitment to advancing technology in the automotive industry.
  • In January 2022, Visteon's introduction of the AllGo App Store for the connected car marks a significant advancement in their suite of connected car technologies. This innovative platform offers an "app-as-a-service" solution that benefits content providers, automakers, and consumers by providing a curated selection of automotive-optimized apps. By seamlessly integrating with pre-loaded apps and enabling over-the-air updates, Visteon ensures a tailored, driver-centric experience with the latest infotainment features. Collaborating with early-stage developers globally, Visteon is building a robust pipeline of new automotive-optimized apps, enhancing the in-vehicle experience, and demonstrating their commitment to driving innovation in the connected car ecosystem.

Frequently Asked Questions (FAQ):

To speak to our analyst for a discussion on the above findings, click Speak to Analyst

TABLE OF CONTENTS
 
1 INTRODUCTION (Page No. - 42)
    1.1 STUDY OBJECTIVES 
    1.2 MARKET DEFINITION 
    1.3 INCLUSIONS AND EXCLUSIONS 
           TABLE 1 INCLUSIONS AND EXCLUSIONS
    1.4 STUDY SCOPE 
           1.4.1 MARKETS COVERED
                    FIGURE 1 CONNECTED CAR MARKET SEGMENTATION
           1.4.2 REGIONS COVERED
           1.4.3 YEARS CONSIDERED
    1.5 CURRENCY CONSIDERED 
           TABLE 2 CURRENCY EXCHANGE RATES
    1.6 UNIT CONSIDERED 
    1.7 STAKEHOLDERS 
    1.8 SUMMARY OF CHANGES 
 
2 RESEARCH METHODOLOGY (Page No. - 47)
    2.1 RESEARCH DATA 
           FIGURE 2 RESEARCH DESIGN
           FIGURE 3 RESEARCH PROCESS FLOW
           2.1.1 SECONDARY DATA
                    2.1.1.1 Key secondary sources to estimate vehicle production
                    2.1.1.2 Key secondary sources to estimate market size
                    2.1.1.3 Key data from secondary sources
           2.1.2 PRIMARY DATA
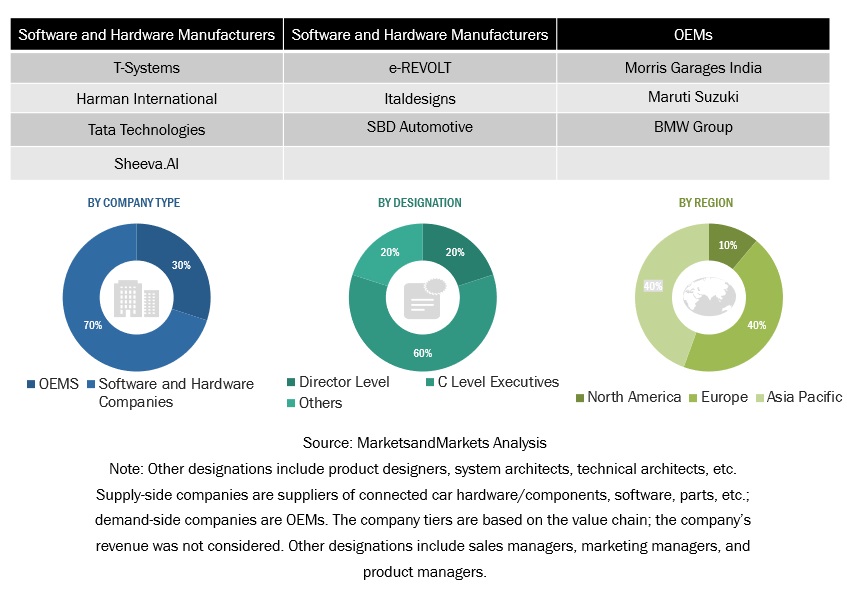
                    FIGURE 4 BREAKDOWN OF PRIMARY INTERVIEWS: BY COMPANY TYPE, DESIGNATION, AND REGION
                    2.1.2.1 Primary participants
    2.2 MARKET SIZE ESTIMATION 
           FIGURE 5 RESEARCH METHODOLOGY: HYPOTHESIS BUILDING
           2.2.1 BOTTOM-UP APPROACH
                    FIGURE 6 BOTTOM-UP APPROACH, BY FORM TYPE
                    FIGURE 7 BOTTOM-UP APPROACH, BY SERVICE
           2.2.2 TOP-DOWN APPROACH
                    FIGURE 8 TOP-DOWN APPROACH
                    FIGURE 9 RESEARCH DESIGN AND METHODOLOGY
           2.2.3 MARKET SIZE ESTIMATION METHODOLOGY: DEMAND AND SUPPLY SIDES
    2.3 DATA TRIANGULATION 
           FIGURE 10 DATA TRIANGULATION
    2.4 FACTOR ANALYSIS 
    2.5 RESEARCH ASSUMPTIONS 
    2.6 RESEARCH LIMITATIONS 
    2.7 RISK ASSESSMENT 
    2.8 RECESSION IMPACT ANALYSIS 
 
3 EXECUTIVE SUMMARY (Page No. - 64)
    FIGURE 11 CONNECTED CAR MARKET OVERVIEW 
    FIGURE 12 EMBEDDED SEGMENT TO REGISTER HIGHEST CAGR DURING FORECAST PERIOD 
 
4 PREMIUM INSIGHTS (Page No. - 67)
    4.1 ATTRACTIVE OPPORTUNITIES FOR PLAYERS IN CONNECTED CAR MARKET 
           FIGURE 13 INCREASING DEMAND FOR ENHANCED USER COMFORT, SAFETY, AND CONVENIENCE TO DRIVE MARKET
    4.2 CONNECTED CAR MARKET, BY FORM TYPE 
           FIGURE 14 EMBEDDED SEGMENT TO LEAD MARKET DURING FORECAST PERIOD
    4.3 CONNECTED CAR MARKET, BY SERVICE 
           FIGURE 15 OTA UPDATE SEGMENT TO BE DOMINANT DURING FORECAST PERIOD
    4.4 CONNECTED CAR MARKET, BY END MARKET 
           FIGURE 16 AFTERMARKET TO HOLD LARGER MARKET SHARE THAN OEM SEGMENT DURING FORECAST PERIOD
    4.5 CONNECTED CAR MARKET, BY HARDWARE 
           FIGURE 17 ELECTRONIC CONTROL UNIT SEGMENT TO ACCOUNT FOR LARGEST MARKET SHARE DURING FORECAST PERIOD
    4.6 CONNECTED CAR MARKET, BY NETWORK 
           FIGURE 18 CELLULAR TO REGISTER HIGHER CAGR THAN DSRC SEGMENT DURING FORECAST PERIOD
    4.7 CONNECTED EV MARKET, BY VEHICLE TYPE 
           FIGURE 19 FCEV SEGMENT TO RECORD HIGHEST CAGR DURING FORECAST PERIOD
    4.8 CONNECTED CAR MARKET, BY REGION 
           FIGURE 20 ASIA PACIFIC TO ACCOUNT FOR LARGEST SHARE IN CONNECTED CAR MARKET IN 2024
 
5 MARKET OVERVIEW (Page No. - 71)
    5.1 INTRODUCTION 
    5.2 MARKET DYNAMICS 
           FIGURE 21 CONNECTED CAR MARKET: DRIVERS, RESTRAINTS, OPPORTUNITIES, AND CHALLENGES
           5.2.1 DRIVERS
                    5.2.1.1 Surge in regulations mandating advanced features
                               FIGURE 22 EVOLUTION OF AUTOMATED SAFETY TECHNOLOGIES
                               TABLE 3 SAFETY REGULATIONS FOR CONNECTED CARS IN US AND EUROPE
                               FIGURE 23 AUTOMOTIVE ADAS MARKET, BY REGION, 2024 VS. 2030 (THOUSAND UNITS)
                    5.2.1.2 Rapid developments in connected car technology
                    5.2.1.3 Growing focus on fuel efficiency
                               FIGURE 24 GLOBAL FUEL ECONOMY AND CO2 EMISSION DATA, 2016–2025
                    5.2.1.4 Rising adoption of telematics and usage-based insurance
                               FIGURE 25 AUTOMOTIVE USAGE-BASED INSURANCE MARKET,  2023 VS. 2028 (USD BILLION)
                               FIGURE 26 AUTOMOTIVE TELEMATICS MARKET, 2024 VS. 2030 (USD MILLION)
                    5.2.1.5 Escalating demand for premium vehicles
                               TABLE 4 LUXURY CAR SALES BY GERMAN BRANDS WORLDWIDE, 2021–2023 (THOUSAND UNITS)
                               TABLE 5 LUXURY CAR SALES BY GERMAN BRANDS IN CHINA, 2021–2023 (THOUSAND UNITS)
                               TABLE 6 LUXURY CAR SALES BY GERMAN BRANDS IN US, 2021–2023 (THOUSAND UNITS)
           5.2.2 RESTRAINTS
                    5.2.2.1 Lack of robust infrastructure
           5.2.3 OPPORTUNITIES
                    5.2.3.1 Emergence of advanced technologies
                               FIGURE 27 5G INFRASTRUCTURE MARKET, 2023 VS. 2027 (USD MILLION)
                               FIGURE 28 AUTOMOTIVE 5G TELEMATICS MARKET, 2024 VS. 2030 (THOUSAND UNITS)
                               FIGURE 29 AUTOMOTIVE ARTIFICIAL INTELLIGENCE MARKET, 2024 VS. 2030 (USD BILLION)
                    5.2.3.2 Ongoing development of autonomous vehicles
                               FIGURE 30 SAE AUTOMATION LEVELS
                               FIGURE 31 L3 AND L4 AUTONOMOUS CAR MARKET,  2023 VS. 2026 VS. 2030 (THOUSAND UNITS)
                    5.2.3.3 Growing shift toward mobility-as-a-service
                               FIGURE 32 RIDE-SHARING MARKET, BY REGION, 2021 VS. 2026 (USD MILLION)
           5.2.4 CHALLENGES
                    5.2.4.1 Cybersecurity issues
                               FIGURE 33 AUTOMOTIVE CYBERSECURITY MARKET, 2023–2028 (USD BILLION)
                               FIGURE 34 SMART MOBILITY ATTACK VENDORS
    5.3 TRENDS AND DISRUPTIONS IMPACTING CUSTOMER BUSINESS 
           FIGURE 35 TRENDS AND DISRUPTIONS IMPACTING CUSTOMER BUSINESS
    5.4 PATENT ANALYSIS 
           FIGURE 36 PATENT PUBLICATION TRENDS, 2019–2023
           5.4.1 LEGAL STATUS OF PATENTS
           FIGURE 37 LEGAL STATUS OF PATENTS, 2014–2023
           5.4.2 TOP PATENT APPLICANTS
           FIGURE 38 TOP PATENT APPLICANTS, 2014–2023
           TABLE 7 INNOVATIONS AND PATENT REGISTRATIONS, 2021–2024
    5.5 ECOSYSTEM ANALYSIS 
           FIGURE 39 ECOSYSTEM ANALYSIS
           5.5.1 HARDWARE PROVIDERS
           5.5.2 SOFTWARE PROVIDERS
           5.5.3 NETWORK PROVIDERS
           5.5.4 OEMS
                    TABLE 8 ROLE OF COMPANIES IN ECOSYSTEM
    5.6 CAR SUBSCRIPTION VS. IN-CAR SUBSCRIPTION 
           FIGURE 40 CAR SUBSCRIPTION VS. IN-CAR SUBSCRIPTION
    5.7 CAR SUBSCRIPTION LANDSCAPE 
           FIGURE 41 CAR SUBSCRIPTION LANDSCAPE
    5.8 CASE STUDY ANALYSIS 
           5.8.1 USE OF TELEMATICS CONTROL UNIT FOR PREDICTIVE MAINTENANCE
           5.8.2 DEVELOPMENT OF LOW-COST AND VERSATILE CAR TELEMATICS PLATFORM
           5.8.3 UTILIZATION OF ZUORA PLATFORM FOR TELEMATICS
           5.8.4 ENHANCED AUTONOMOUS DRIVING CAPABILITIES WITH OPEN AUTONOMY PILOT PLATFORM
           5.8.5 IMPROVED AUTONOMOUS VEHICLE PERFORMANCE WITH DRIVE HYPERION 5
    5.9 SUPPLY CHAIN ANALYSIS 
           FIGURE 42 SUPPLY CHAIN ANALYSIS
    5.10 PRICING ANALYSIS 
           5.10.1 AVERAGE SELLING PRICE TREND, BY REGION
                    FIGURE 43 AVERAGE SELLING PRICE TREND, BY REGION, 2020–2024 (USD)
                    TABLE 9 AVERAGE SELLING PRICE TREND, BY REGION, 2020–2024
           5.10.2 AVERAGE SELLING PRICE TREND, BY HARDWARE
                    FIGURE 44 AVERAGE SELLING PRICE TREND, BY HARDWARE, 2020–2024 (USD)
                    TABLE 10 AVERAGE SELLING PRICE TREND, BY HARDWARE, 2020–2024 (USD)
    5.11 TRADE ANALYSIS 
           5.11.1 IMPORT DATA
                    TABLE 11 US: CONNECTED CAR IMPORT SHARE, BY COUNTRY (%)
                    TABLE 12 UK: CONNECTED CAR IMPORT SHARE, BY COUNTRY (%)
                    TABLE 13 CHINA: CONNECTED CAR IMPORT SHARE, BY COUNTRY (%)
                    TABLE 14 NETHERLANDS: CONNECTED CAR IMPORT SHARE, BY COUNTRY (%)
                    TABLE 15 AUSTRALIA: CONNECTED CAR IMPORT SHARE, BY COUNTRY (%)
                    TABLE 16 INDIA: CONNECTED CAR IMPORT SHARE, BY COUNTRY (%)
                    TABLE 17 GERMANY: CONNECTED CAR IMPORT SHARE, BY COUNTRY (%)
           5.11.2 EXPORT DATA
                    TABLE 18 US: CONNECTED CAR EXPORT SHARE, BY COUNTRY (%)
                    TABLE 19 ITALY: CONNECTED CAR EXPORT SHARE, BY COUNTRY (%)
                    TABLE 20 FRANCE: CONNECTED CAR EXPORT SHARE, BY COUNTRY (%)
                    TABLE 21 NETHERLANDS: CONNECTED CAR EXPORT SHARE, BY COUNTRY (%)
                    TABLE 22 INDIA: CONNECTED CAR EXPORT SHARE, BY COUNTRY (%)
                    TABLE 23 GERMANY: CONNECTED CAR EXPORT SHARE, BY COUNTRY (%)
    5.12 TECHNOLOGY ANALYSIS 
           5.12.1 KEY TECHNOLOGY
                    5.12.1.1 5G
                    5.12.1.2 Artificial Intelligence
           5.12.2 COMPLEMENTARY TECHNOLOGY
                    5.12.2.1 Vehicle-to-everything
                               5.12.2.1.1 Vehicle-to-cloud
                               5.12.2.1.2 Vehicle-to-pedestrian
                               5.12.2.1.3 Vehicle-to-infrastructure
                               5.12.2.1.4 Vehicle-to-vehicle
                    5.12.2.2 Cellular V2X
                               TABLE 24 CUMULATIVE GAIN USING 5G NEW RADIO (NR) C-V2X
                               5.12.2.2.1 LTE-V2X
                               5.12.2.2.2 5G-V2X
           5.12.3 ADJACENT TECHNOLOGY
                    5.12.3.1 Ride-hailing service
                               TABLE 25 LEVEL OF AUTOMATION IN AUTONOMOUS VEHICLES
                               5.12.3.1.1 L2 automation
    5.13 REGIONAL TELEMATICS DATA PLAN, BY OEM 
                    TABLE 26 DATA PLANS AND SERVICES OFFERED BY OEMS IN NORTH AMERICA
                    TABLE 27 DATA PLANS AND SERVICES OFFERED BY OEMS IN EUROPE
    5.14 KEY CONFERENCES AND EVENTS 
                    TABLE 28 KEY CONFERENCES AND EVENTS, 2024–2025
    5.15 REGULATORY LANDSCAPE 
           5.15.1 VEHICLE SAFETY STANDARDS
                    TABLE 29 VEHICLE SAFETY STANDARDS, BY COUNTRY/REGION
                    TABLE 30 ADAS REGULATIONS AND INITIATIVES
           5.15.2 REGULATORY BODIES, GOVERNMENT AGENCIES,  AND OTHER ORGANIZATIONS
                    TABLE 31 NORTH AMERICA: REGULATORY BODIES, GOVERNMENT AGENCIES,  AND OTHER ORGANIZATIONS
                    TABLE 32 EUROPE: REGULATORY BODIES, GOVERNMENT AGENCIES, AND OTHER ORGANIZATIONS
                    TABLE 33 ASIA PACIFIC: REGULATORY BODIES, GOVERNMENT AGENCIES, AND OTHER ORGANIZATIONS
    5.16 KEY STAKEHOLDERS AND BUYING CRITERIA 
           5.16.1 KEY STAKEHOLDERS IN BUYING PROCESS
                    FIGURE 45 INFLUENCE OF STAKEHOLDERS ON BUYING PROCESS OF CONNECTED CARS,  BY FORM TYPE
                    TABLE 34 INFLUENCE OF STAKEHOLDERS ON BUYING PROCESS FOR CONNECTED CARS,  BY FORM TYPE
    5.17 BUYING CRITERIA 
                    FIGURE 46 KEY BUYING CRITERIA FOR CONNECTED CARS, BY FORM TYPE
                    TABLE 35 KEY BUYING CRITERIA FOR CONNECTED CARS, BY FORM TYPE
    5.18 INVESTMENT AND FUNDING SCENARIO 
                    FIGURE 47 INVESTMENT AND FUNDING SCENARIO, 2021–2024
 
6 CONNECTED CAR MARKET, BY SERVICE (Page No. - 120)
    6.1 INTRODUCTION 
           FIGURE 48 CONNECTED CAR MARKET, BY SERVICE, 2024 VS. 2030 (USD MILLION)
           TABLE 36 CONNECTED CAR MARKET, BY SERVICE, 2019–2023 (USD MILLION)
           TABLE 37 CONNECTED CAR MARKET, BY SERVICE, 2024–2030 (USD MILLION)
    6.2 OPERATIONAL DATA 
           TABLE 38 CONNECTED CAR SERVICES OFFERED BY OEMS
    6.3 NAVIGATION 
           6.3.1 NEED FOR PRECISE ROAD GEOMETRY AND 3D REPRESENTATION TO DRIVE MARKET
                    TABLE 39 NAVIGATION: CONNECTED CAR MARKET, BY REGION, 2019–2023 (USD MILLION)
                    TABLE 40 NAVIGATION: CONNECTED CAR MARKET, BY REGION, 2024–2030 (USD MILLION)
    6.4 REMOTE DIAGNOSTICS 
           6.4.1 NEED TO REDUCE VEHICLE COST AND SERVICE TIME TO DRIVE MARKET
                    TABLE 41 REMOTE DIAGNOSTICS: CONNECTED CAR MARKET, BY REGION,  2019–2023 (USD MILLION)
                    TABLE 42 REMOTE DIAGNOSTICS: CONNECTED CAR MARKET, BY REGION,  2024–2030 (USD MILLION)
    6.5 MULTIMEDIA STREAMING 
           6.5.1 RISING DEMAND FOR ADVANCED VEHICULAR FUNCTIONS TO DRIVE MARKET
                    TABLE 43 MULTIMEDIA STREAMING: CONNECTED CAR MARKET, BY REGION,  2019–2023 (USD MILLION)
                    TABLE 44 MULTIMEDIA STREAMING: CONNECTED CAR MARKET, BY REGION,  2024–2030 (USD MILLION)
    6.6 SOCIAL MEDIA & OTHER APPS 
           6.6.1 SURGE IN USE OF INFOTAINMENT, NEWS UPDATES, AND MUSIC STREAMING, TO DRIVE MARKET
                    TABLE 45 SOCIAL MEDIA & OTHER APPS: CONNECTED CAR MARKET, BY REGION,  2019–2023 (USD MILLION)
                    TABLE 46 SOCIAL MEDIA & OTHER APPS: CONNECTED CAR MARKET, BY REGION,  2024–2030 (USD MILLION)
    6.7 OTA UPDATE 
           6.7.1 GROWING FOCUS ON REDUCING MAINTENANCE COST AND COMPLIANCE ISSUES TO DRIVE MARKET
                    TABLE 47 OTA UPDATE: CONNECTED CAR MARKET, BY REGION, 2019–2023 (USD MILLION)
                    TABLE 48 OTA UPDATE: CONNECTED CAR MARKET, BY REGION, 2024–2030 (USD MILLION)
    6.8 ON-ROAD ASSISTANCE 
           6.8.1 RISING INCLINATION TOWARD DRIVING ASSISTANCE TO COMBAT VEHICLE HEALTH ISSUES TO DRIVE MARKET
                    TABLE 49 ON-ROAD ASSISTANCE: CONNECTED CAR MARKET, BY REGION,  2019–2023 (USD MILLION)
                    TABLE 50 ON-ROAD ASSISTANCE: CONNECTED CAR MARKET, BY REGION,  2024–2030 (USD MILLION)
    6.9 E-CALL & SOS ASSISTANCE 
           6.9.1 INCREASING DEMAND FOR EMERGENCY SERVICES AND SAFETY REGULATIONS TO DRIVE MARKET
                    TABLE 51 E-CALL & SOS ASSISTANCE: CONNECTED CAR MARKET, BY REGION,  2019–2023 (USD MILLION)
                    TABLE 52 E-CALL & SOS ASSISTANCE: CONNECTED CAR MARKET, BY REGION, 2024–2030 (USD MILLION)
    6.10 REMOTE OPERATION 
           6.10.1 GROWING DEMAND FOR AUTONOMOUS VEHICLES TO DRIVE MARKET
                    TABLE 53 REMOTE OPERATION: CONNECTED CAR MARKET, BY REGION, 2019–2023 (USD MILLION)
                    TABLE 54 REMOTE OPERATION: CONNECTED CAR MARKET, BY REGION, 2024–2030 (USD MILLION)
    6.11 AUTO PARKING/CONNECTED PARKING 
           6.11.1 INCREASING TREND OF SMART CITIES TO DRIVE MARKET
                    TABLE 55 AUTO PARKING/CONNECTED PARKING: CONNECTED CAR MARKET, BY REGION,  2019–2023 (USD MILLION)
                    TABLE 56 AUTO PARKING/CONNECTED PARKING: CONNECTED CAR MARKET, BY REGION,  2024–2030 (USD MILLION)
    6.12 AUTOPILOT 
           6.12.1 GROWING ADOPTION OF L4 VEHICLES TO DRIVE MARKET
                    TABLE 57 AUTOPILOT: CONNECTED CAR MARKET, BY REGION, 2019–2023 (USD MILLION)
                    TABLE 58 AUTOPILOT: CONNECTED CAR MARKET, BY REGION, 2024–2030 (USD MILLION)
    6.13 HOME INTEGRATION 
           6.13.1 RAPID DIGITALIZATION TO DRIVE MARKET
                    TABLE 59 HOME INTEGRATION: CONNECTED CAR MARKET, BY REGION, 2019–2023 (USD MILLION)
                    TABLE 60 HOME INTEGRATION: CONNECTED CAR MARKET, BY REGION, 2024–2030 (USD MILLION)
    6.14 STOLEN VEHICLE RECOVERY/WARNING 
           6.14.1 RISING DEMAND FOR FLEET TELEMATICS IN TRANSPORTATION AND LOGISTICS INDUSTRIES TO DRIVE MARKET
                    TABLE 61 STOLEN VEHICLE RECOVERY/WARNING: CONNECTED CAR MARKET, BY REGION,  2019–2023 (USD MILLION)
                    TABLE 62 STOLEN VEHICLE RECOVERY/WARNING: CONNECTED CAR MARKET, BY REGION,  2024–2030 (USD MILLION)
           6.14.2 PRIMARY INSIGHTS
 
7 CONNECTED CAR MARKET, BY FORM TYPE (Page No. - 137)
    7.1 INTRODUCTION 
           FIGURE 49 CONNECTED CAR MARKET, BY FORM TYPE, 2024 VS. 2030 (THOUSAND UNITS)
           TABLE 63 CONNECTED CAR MARKET, BY FORM TYPE, 2019–2023 (‘000 UNITS)
           TABLE 64 CONNECTED CAR MARKET, BY FORM TYPE, 2024–2030 (‘000 UNITS)
    7.2 OPERATIONAL DATA 
           TABLE 65 EMBEDDED VS. INTEGRATED FORM TYPE
    7.3 EMBEDDED 
           7.3.1 SURGE IN DEVELOPMENT OF CLOUD-BASED SERVICES TO DRIVE MARKET
                    TABLE 66 EMBEDDED: CONNECTED CAR MARKET, BY REGION, 2019–2023 (‘000 UNITS)
                    TABLE 67 EMBEDDED: CONNECTED CAR MARKET, BY REGION, 2024–2030 (‘000 UNITS)
    7.4 INTEGRATED 
           7.4.1 INCREASING PENETRATION OF SMARTPHONES AND MOBILE TECHNOLOGIES TO DRIVE MARKET
                    TABLE 68 INTEGRATED: CONNECTED CAR MARKET, BY REGION, 2019–2023 (‘000 UNITS)
                    TABLE 69 INTEGRATED: CONNECTED CAR MARKET, BY REGION, 2024–2030 (‘000 UNITS)
           7.4.2 PRIMARY INSIGHTS
 
8 CONNECTED CAR MARKET, BY END MARKET (Page No. - 143)
    8.1 INTRODUCTION 
           FIGURE 50 CONNECTED CAR MARKET, BY END MARKET, 2024 VS. 2030 (USD MILLION)
           TABLE 70 CONNECTED CAR MARKET, BY END MARKET, 2019–2023 (USD MILLION)
           TABLE 71 CONNECTED CAR MARKET, BY END MARKET, 2024–2030 (USD MILLION)
    8.2 OEM 
           8.2.1 RISE IN VEHICLE LEGISLATION AND INDUSTRY COMPLIANCES TO DRIVE MARKET
                    TABLE 72 OEM: CONNECTED CAR MARKET, BY REGION, 2019–2023 (USD MILLION)
                    TABLE 73 OEM: CONNECTED CAR MARKET, BY REGION, 2024–2030 (USD MILLION)
    8.3 AFTERMARKET 
           8.3.1 GROWING DISPOSABLE INCOME AND DEMAND FOR COMFORT AND LUXURY FEATURES TO DRIVE MARKET
                    TABLE 74 AFTERMARKET: CONNECTED CAR MARKET, BY REGION, 2019–2023 (USD MILLION)
                    TABLE 75 AFTERMARKET: CONNECTED CAR MARKET, BY REGION, 2024–2030 (USD MILLION)
           8.3.2 PRIMARY INSIGHTS
 
9 CONNECTED CAR MARKET, BY HARDWARE (Page No. - 148)
    9.1 INTRODUCTION 
           FIGURE 51 CONNECTED CAR MARKET, BY HARDWARE, 2024 VS. 2030 (USD MILLION)
           TABLE 76 CONNECTED CAR MARKET, BY HARDWARE, 2019–2023 (USD MILLION)
           TABLE 77 CONNECTED CAR MARKET, BY HARDWARE, 2024–2030 (USD MILLION)
    9.2 HEAD UNIT 
           9.2.1 GROWING POPULARITY OF INFOTAINMENT SYSTEMS TO DRIVE MARKET
                    TABLE 78 HEAD UNIT: CONNECTED CAR MARKET, BY REGION, 2019–2023 (USD MILLION)
                    TABLE 79 HEAD UNIT: CONNECTED CAR MARKET, BY REGION, 2024–2030 (USD MILLION)
    9.3 CENTRAL GATEWAY 
           9.3.1 INCREASING TREND OF ELECTRIFICATION, AUTOMATED DRIVING, AND CONNECTED VEHICLES TO DRIVE MARKET
                    TABLE 80 CENTRAL GATEWAY: CONNECTED CAR MARKET, BY REGION, 2019–2023 (USD MILLION)
                    TABLE 81 CENTRAL GATEWAY: CONNECTED CAR MARKET, BY REGION, 2024–2030 (USD MILLION)
    9.4 INTELLIGENT ANTENNA 
           9.4.1 GROWING PENETRATION OF SMARTPHONE APPLICATIONS IN CONNECTED VEHICLES TO DRIVE MARKET
           TABLE 82 INTELLIGENT ANTENNA: CONNECTED CAR MARKET, BY REGION,  2019–2023 (USD MILLION)
           TABLE 83 INTELLIGENT ANTENNA: CONNECTED CAR MARKET, BY REGION,  2024–2030 (USD MILLION)
    9.5 ELECTRONIC CONTROL UNIT 
           9.5.1 RISING GOVERNMENT MANDATES FOR IN-VEHICLE SAFETY FEATURES TO DRIVE MARKET
                    TABLE 84 ELECTRONIC CONTROL UNIT: CONNECTED CAR MARKET, BY REGION,  2019–2023 (USD MILLION)
                    TABLE 85 ELECTRONIC CONTROL UNIT: CONNECTED CAR MARKET, BY REGION,  2024–2030 (USD MILLION)
    9.6 TELEMATICS CONTROL UNIT 
           9.6.1 INCREASING DEVELOPMENT OF OE-FITTED TELEMATICS TO DRIVE MARKET
                    TABLE 86 TELEMATICS CONTROL UNIT: CONNECTED CAR MARKET, BY REGION,  2019–2023 (USD MILLION)
                    TABLE 87 TELEMATICS CONTROL UNIT: CONNECTED CAR MARKET, BY REGION,  2024–2030 (USD MILLION)
    9.7 KEYLESS ENTRY SYSTEM 
           9.7.1 GROWING IMPLEMENTATION OF VEHICLE SECURITY SYSTEMS TO DRIVE MARKET
                    TABLE 88 KEYLESS ENTRY SYSTEM: CONNECTED CAR MARKET, BY REGION,  2019–2023 (USD MILLION)
                    TABLE 89 KEYLESS ENTRY SYSTEM: CONNECTED CAR MARKET, BY REGION,  2024–2030 (USD MILLION)
    9.8 SENSOR 
           9.8.1 INCREASING PREFERENCE FOR SEMI-AUTONOMOUS AND AUTONOMOUS VEHICLES TO DRIVE MARKET
                    TABLE 90 SENSOR: CONNECTED CAR MARKET, BY REGION, 2019–2023 (USD MILLION)
                    TABLE 91 SENSOR: CONNECTED CAR MARKET, BY REGION, 2024–2030 (USD MILLION)
           9.8.2 PRIMARY INSIGHTS
 
10 CONNECTED CAR MARKET, BY TRANSPONDER (Page No. - 159)
     10.1 INTRODUCTION 
               TABLE 92 COMPANIES OFFERING ROADSIDE UNITS AND ONBOARD UNITS
     10.2 ONBOARD UNIT 
     10.3 ROADSIDE UNIT 
             10.3.1 PRIMARY INSIGHTS
 
11 CONNECTED CAR MARKET, BY NETWORK (Page No. - 163)
     11.1 INTRODUCTION 
               FIGURE 52 CONNECTED CAR MARKET, BY NETWORK, 2024 VS. 2030 (‘000 UNITS)
               TABLE 93 CONNECTED CAR MARKET, BY NETWORK, 2019–2023 (‘000 UNITS)
               TABLE 94 CONNECTED CAR MARKET, BY NETWORK, 2024–2030 (‘000 UNITS)
     11.2 OPERATIONAL DATA 
               TABLE 95 DSRC VS. CELLULAR NETWORK FOR V2X COMMUNICATION
               TABLE 96 PARAMETERS OF PHYSICAL LAYERS
     11.3 DEDICATED SHORT RANGE COMMUNICATION 
             11.3.1 NEED FOR BETTER CONNECTIVITY, 3D MAPPING, AND PRECISE POSITIONING TO DRIVE MARKET
                       TABLE 97 DSRC: CONNECTED CAR MARKET, BY REGION, 2019–2023 (‘000 UNITS)
                       TABLE 98 DSRC: CONNECTED CAR MARKET, BY REGION, 2024–2030 (‘000 UNITS)
     11.4 CELLULAR 
               TABLE 99 DSRC VS. C-V2X PERFORMANCE
               TABLE 100 V2X STANDARDS FOR VARIOUS COMMUNICATION RANGES
             11.4.1 4G
                       11.4.1.1 Growing integration of 5G LTE standard features to drive market
             11.4.2 5G
                       11.4.2.1 Rising demand for faster and seamless connections to drive market
                                   TABLE 101 CELLULAR: CONNECTED CAR MARKET, BY REGION, 2019–2023 (‘000 UNITS)
                                   TABLE 102 CELLULAR: CONNECTED CAR MARKET, BY REGION, 2024–2030 (‘000 UNITS)
             11.4.3 PRIMARY INSIGHTS
 
12 CONNECTED EV MARKET, BY VEHICLE TYPE (Page No. - 171)
     12.1 INTRODUCTION 
               FIGURE 53 CONNECTED EV MARKET, BY VEHICLE TYPE, 2024 VS. 2030 (USD MILLION)
               TABLE 103 CONNECTED EV MARKET, BY VEHICLE TYPE, 2019–2023 (USD MILLION)
               TABLE 104 CONNECTED EV MARKET, BY VEHICLE TYPE, 2024–2030 (USD MILLION)
     12.2 BEV 
             12.2.1 BOOMING SALES OF PREMIUM AND LUXURY ELECTRIC VEHICLES TO DRIVE MARKET
                       TABLE 105 BEV: CONNECTED EV MARKET, BY SERVICE, 2019–2023 (USD MILLION)
                       TABLE 106 BEV: CONNECTED EV MARKET, BY SERVICE, 2024–2030 (USD MILLION)
     12.3 PHEV 
             12.3.1 GROWING FOCUS ON ADVANCED SAFETY AND ADAS FEATURES TO DRIVE MARKET
                       TABLE 107 PHEV: CONNECTED EV MARKET, BY SERVICE, 2019–2023 (USD MILLION)
                       TABLE 108 PHEV: CONNECTED EV MARKET, BY SERVICE, 2024–2030 (USD MILLION)
     12.4 FCEV 
             12.4.1 INCREASING DEMAND FOR MEDIUM AND LONG-RANGE VEHICLES TO DRIVE MARKET
                       TABLE 109 FCEV: CONNECTED EV MARKET, BY SERVICE, 2019–2023 (USD MILLION)
                       TABLE 110 FCEV: CONNECTED EV MARKET, BY SERVICE, 2024–2030 (USD MILLION)
             12.4.2 PRIMARY INSIGHTS
 
13 CONNECTED CAR TECHNOLOGY, BY APPLICATION (Page No. - 179)
     13.1 DATA CAPTURE AND MANAGEMENT 
     13.2 DYNAMIC MOBILITY 
     13.3 ROAD WEATHER MANAGEMENT 
     13.4 REAL-TIME INFORMATION SYNTHESIS 
     13.5 VEHICLE HEALTH MONITORING 
 
14 CONNECTED CAR MARKET, BY REGION (Page No. - 182)
     14.1 INTRODUCTION 
               FIGURE 54 CONNECTED CAR MARKET, BY REGION, 2024 VS. 2030 (USD MILLION)
               TABLE 111 CONNECTED CAR MARKET, BY REGION, 2019–2023 (USD MILLION)
               TABLE 112 CONNECTED CAR MARKET, BY REGION, 2024–2030 (USD MILLION)
     14.2 ASIA PACIFIC 
             14.2.1 RECESSION IMPACT ANALYSIS
                       FIGURE 55 ASIA PACIFIC: CONNECTED CAR MARKET SNAPSHOT
                       TABLE 113 ASIA PACIFIC: CONNECTED CAR MARKET, BY COUNTRY, 2019–2023 (USD MILLION)
                       TABLE 114 ASIA PACIFIC: CONNECTED CAR MARKET, BY COUNTRY, 2024–2030 (USD MILLION)
             14.2.2 CHINA
                       14.2.2.1 Surge in use of 5G-based telematic cars to drive market
                                   TABLE 115 CHINA: CONNECTED CAR MARKET, BY SERVICE, 2019–2023 (USD MILLION)
                                   TABLE 116 CHINA: CONNECTED CAR MARKET, BY SERVICE, 2024–2030 (USD MILLION)
             14.2.3 INDIA
                       14.2.3.1 Increasing demand for infotainment and navigation systems to drive market
                                   TABLE 117 INDIA: CONNECTED CAR MARKET, BY SERVICE, 2019–2023 (USD MILLION)
                                   TABLE 118 INDIA: CONNECTED CAR MARKET, BY SERVICE, 2024–2030 (USD MILLION)
             14.2.4 JAPAN
                       14.2.4.1 Growing collaborations between manufacturers and telecom providers to drive market
                                   TABLE 119 JAPAN: CONNECTED CAR MARKET, BY SERVICE, 2019–2023 (USD MILLION)
                                   TABLE 120 JAPAN: CONNECTED CAR MARKET, BY SERVICE, 2024–2030 (USD MILLION)
             14.2.5 SOUTH KOREA
                       14.2.5.1 Rising adoption of advanced connectivity solutions to drive market
                                   TABLE 121 SOUTH KOREA: CONNECTED CAR MARKET, BY SERVICE, 2019–2023 (USD MILLION)
                                   TABLE 122 SOUTH KOREA: CONNECTED CAR MARKET, BY SERVICE, 2024–2030 (USD MILLION)
             14.2.6 THAILAND
                       14.2.6.1 Increasing demand for efficient fleet management to drive market
                                   TABLE 123 THAILAND: CONNECTED CAR MARKET, BY SERVICE, 2019–2023 (USD MILLION)
                                   TABLE 124 THAILAND: CONNECTED CAR MARKET, BY SERVICE, 2024–2030 (USD MILLION)
             14.2.7 REST OF ASIA PACIFIC
                       TABLE 125 REST OF ASIA PACIFIC: CONNECTED CAR MARKET, BY SERVICE,  2019–2023 (USD MILLION)
                       TABLE 126 REST OF ASIA PACIFIC: CONNECTED CAR MARKET, BY SERVICE,  2024–2030 (USD MILLION)
     14.3 EUROPE 
             14.3.1 RECESSION IMPACT ANALYSIS
                       FIGURE 56 EUROPE: CONNECTED CAR MARKET, BY COUNTRY, 2024 VS. 2030 (USD MILLION)
                       TABLE 127 EUROPE: CONNECTED CAR MARKET, BY COUNTRY, 2019–2023 (USD MILLION)
                       TABLE 128 EUROPE: CONNECTED CAR MARKET, BY COUNTRY, 2024–2030 (USD MILLION)
             14.3.2 GERMANY
                       14.3.2.1 Growing inclination toward self-driving vehicles to drive market
                                   TABLE 129 GERMANY: CONNECTED CAR MARKET, BY SERVICE, 2019–2023 (USD MILLION)
                                   TABLE 130 GERMANY: CONNECTED CAR MARKET, BY SERVICE, 2024–2030 (USD MILLION)
             14.3.3 FRANCE
                       14.3.3.1 Increasing adoption of multiple advanced driver assistance systems features to drive market
                                   TABLE 131 FRANCE: CONNECTED CAR MARKET, BY SERVICE, 2019–2023 (USD MILLION)
                                   TABLE 132 FRANCE: CONNECTED CAR MARKET, BY SERVICE, 2024–2030 (USD MILLION)
             14.3.4 UK
                       14.3.4.1 Rising demand for premium vehicles to drive market
                                   TABLE 133 UK: CONNECTED CAR MARKET, BY SERVICE, 2019–2023 (USD MILLION)
                                   TABLE 134 UK: CONNECTED CAR MARKET, BY SERVICE, 2024–2030 (USD MILLION)
             14.3.5 SPAIN
                       14.3.5.1 Growing focus on road safety regulations to drive market
                                   TABLE 135 SPAIN: CONNECTED CAR MARKET, BY SERVICE, 2019–2023 (USD MILLION)
                                   TABLE 136 SPAIN: CONNECTED CAR MARKET, BY SERVICE, 2024–2030 (USD MILLION)
             14.3.6 ITALY
                       14.3.6.1 Increasing development of smart road infrastructure to drive market
                                   TABLE 137 ITALY: CONNECTED CAR MARKET, BY SERVICE, 2019–2023 (USD MILLION)
                                   TABLE 138 ITALY: CONNECTED CAR MARKET, BY SERVICE, 2024–2030 (USD MILLION)
             14.3.7 RUSSIA
                       14.3.7.1 Growing integration of connectivity features in premium cars to drive market
                                   TABLE 139 RUSSIA: CONNECTED CAR MARKET, BY SERVICE, 2019–2023 (USD MILLION)
                                   TABLE 140 RUSSIA: CONNECTED CAR MARKET, BY SERVICE, 2024–2030 (USD MILLION)
             14.3.8 REST OF EUROPE
                       TABLE 141 REST OF EUROPE: CONNECTED CAR MARKET, BY SERVICE, 2019–2023 (USD MILLION)
                       TABLE 142 REST OF EUROPE: CONNECTED CAR MARKET, BY SERVICE, 2024–2030 (USD MILLION)
     14.4 NORTH AMERICA 
             14.4.1 RECESSION IMPACT ANALYSIS
                       FIGURE 57 NORTH AMERICA: CONNECTED CAR MARKET SNAPSHOT
                       TABLE 143 NORTH AMERICA: CONNECTED CAR MARKET, BY COUNTRY, 2019–2023 (USD MILLION)
                       TABLE 144 NORTH AMERICA: CONNECTED CAR MARKET, BY COUNTRY, 2024–2030 (USD MILLION)
             14.4.2 US
                       14.4.2.1 Rapid development of autonomous driving systems to drive market
                                   TABLE 145 US: CONNECTED CAR MARKET, BY SERVICE, 2019–2023 (USD MILLION)
                                   TABLE 146 US: CONNECTED CAR MARKET, BY SERVICE, 2024–2030 (USD MILLION)
             14.4.3 CANADA
                       14.4.3.1 Increasing launches of connected car models to drive market
                                   TABLE 147 CANADA: CONNECTED CAR MARKET, BY SERVICE, 2019–2023 (USD MILLION)
                                   TABLE 148 CANADA: CONNECTED CAR MARKET, BY SERVICE, 2024–2030 (USD MILLION)
             14.4.4 MEXICO
                       14.4.4.1 Increasing partnerships between aftermarket service providers and OEMs to drive market
                                   TABLE 149 MEXICO: CONNECTED CAR MARKET, BY SERVICE, 2019–2023 (USD MILLION)
                                   TABLE 150 MEXICO: CONNECTED CAR MARKET, BY SERVICE, 2024–2030 (USD MILLION)
     14.5 REST OF THE WORLD 
             14.5.1 RECESSION IMPACT ANALYSIS
                       FIGURE 58 REST OF THE WORLD: CONNECTED CAR MARKET, BY COUNTRY,  2024 VS. 2030 (USD MILLION)
                       TABLE 151 REST OF THE WORLD: CONNECTED CAR MARKET, BY COUNTRY,  2019–2023 (USD MILLION)
                       TABLE 152 REST OF THE WORLD: CONNECTED CAR MARKET, BY COUNTRY,  2024–2030 (USD MILLION)
             14.5.2 BRAZIL
                       14.5.2.1 Growing popularity of data-driven internet services to drive market
                                   TABLE 153 BRAZIL: CONNECTED CAR MARKET, BY SERVICE, 2019–2023 (USD MILLION)
                                   TABLE 154 BRAZIL: CONNECTED CAR MARKET, BY SERVICE, 2024–2030 (USD MILLION)
             14.5.3 ARGENTINA
                       14.5.3.1 Expanding internet infrastructure to drive market
                                   TABLE 155 ARGENTINA: CONNECTED CAR MARKET, BY SERVICE, 2019–2023 (USD MILLION)
                                   TABLE 156 ARGENTINA: CONNECTED CAR MARKET, BY SERVICE, 2024–2030 (USD MILLION)
             14.5.4 IRAN
                       14.5.4.1 Rising incorporation of telematics features with enhanced connectivity and convenience to drive market
                                   TABLE 157 IRAN: CONNECTED CAR MARKET, BY SERVICE, 2019–2023 (USD MILLION)
                                   TABLE 158 IRAN: CONNECTED CAR MARKET, BY SERVICE, 2024–2030 (USD MILLION)
             14.5.5 OTHER COUNTRIES
                       TABLE 159 OTHER COUNTRIES: CONNECTED CAR MARKET, BY SERVICE, 2019–2023 (USD MILLION)
                       TABLE 160 OTHER COUNTRIES: CONNECTED CAR MARKET, BY SERVICE, 2024–2030 (USD MILLION)
             14.5.6 PRIMARY INSIGHTS
 
15 CONNECTED CAR MARKET, BY FORM TYPE & REGION (Page No. - 227)
     15.1 INTRODUCTION 
               FIGURE 59 CONNECTED CAR MARKET, BY FORM TYPE & REGION,  2024 VS. 2030 (‘000 UNITS)
               TABLE 161 CONNECTED CAR MARKET, BY FORM TYPE & REGION, 2019–2023 (‘000 UNITS)
               TABLE 162 CONNECTED CAR MARKET, BY FORM TYPE & REGION, 2024–2030 (‘000 UNITS)
     15.2 ASIA PACIFIC 
               FIGURE 60 ASIA PACIFIC: CONNECTED CAR MARKET SNAPSHOT
               TABLE 163 ASIA PACIFIC: CONNECTED CAR MARKET, BY COUNTRY,  2019–2023 (‘000 UNITS)
               TABLE 164 ASIA PACIFIC: CONNECTED CAR MARKET, BY COUNTRY,  2024–2030 (‘000 UNITS)
             15.2.1 CHINA
                       15.2.1.1 Growing efforts by local players for higher adoption of advanced connected car technologies to drive market
                                   TABLE 165 CHINA: CONNECTED CAR MARKET, BY FORM TYPE, 2019–2023 (‘000 UNITS)
                                   TABLE 166 CHINA: CONNECTED CAR MARKET, BY FORM TYPE, 2024–2030 (‘000 UNITS)
             15.2.2 INDIA
                       15.2.2.1 Increasing focus on stringent safety norms to drive market
                                   TABLE 167 INDIA: CONNECTED CAR MARKET, BY FORM TYPE, 2019–2023 (‘000 UNITS)
                                   TABLE 168 INDIA: CONNECTED CAR MARKET, BY FORM TYPE, 2024–2030 (‘000 UNITS)
             15.2.3 JAPAN
                       15.2.3.1 Surge in 5G network deployment to drive market
                                   TABLE 169 JAPAN: CONNECTED CAR MARKET, BY FORM TYPE, 2019–2023 (‘000 UNITS)
                                   TABLE 170 JAPAN: CONNECTED CAR MARKET, BY FORM TYPE, 2024–2030 (‘000 UNITS)
             15.2.4 SOUTH KOREA
                       15.2.4.1 Rising infrastructure development and government support to drive market
                                   TABLE 171 SOUTH KOREA: CONNECTED CAR MARKET, BY FORM TYPE, 2019–2023 (‘000 UNITS)
                                   TABLE 172 SOUTH KOREA: CONNECTED CAR MARKET, BY FORM TYPE, 2024–2030 (‘000 UNITS)
             15.2.5 THAILAND
                       15.2.5.1 Increasing trend toward used cars to drive market
                                   TABLE 173 THAILAND: CONNECTED CAR MARKET, BY FORM TYPE, 2019–2023 (‘000 UNITS)
                                   TABLE 174 THAILAND: CONNECTED CAR MARKET, BY FORM TYPE, 2024–2030 (‘000 UNITS)
             15.2.6 REST OF ASIA PACIFIC
                       TABLE 175 REST OF ASIA PACIFIC: CONNECTED CAR MARKET, BY FORM TYPE,  2019–2023 (‘000 UNITS)
                       TABLE 176 REST OF ASIA PACIFIC: CONNECTED CAR MARKET, BY FORM TYPE,  2024–2030 (‘000 UNITS)
     15.3 EUROPE 
               FIGURE 61 EUROPE: CONNECTED CAR MARKET, 2024 VS. 2030 (‘000 UNITS)
               TABLE 177 EUROPE: CONNECTED CAR MARKET, BY COUNTRY, 2019–2023 (‘000 UNITS)
               TABLE 178 EUROPE: CONNECTED CAR MARKET, BY COUNTRY,  2024–2030 (‘000 UNITS)
             15.3.1 GERMANY
                       15.3.1.1 Growing integration of artificial intelligence, machine learning, and Internet of Things in cars to drive market
                                   TABLE 179 GERMANY: CONNECTED CAR MARKET, BY FORM TYPE, 2019–2023 (‘000 UNITS)
                                   TABLE 180 GERMANY: CONNECTED CAR MARKET, BY FORM TYPE, 2024–2030 (‘000 UNITS)
             15.3.2 FRANCE
                       15.3.2.1 Increasing consumer demand for connected and autonomous features to drive market
                                   TABLE 181 FRANCE: CONNECTED CAR MARKET, BY FORM TYPE, 2019–2023 (‘000 UNITS)
                                   TABLE 182 FRANCE: CONNECTED CAR MARKET, BY FORM TYPE, 2024–2030 (‘000 UNITS)
             15.3.3 UK
                       15.3.3.1 Rising focus on safety and sustainability to drive market
                                   TABLE 183 UK: CONNECTED CAR MARKET, BY FORM TYPE, 2019–2023 (‘000 UNITS)
                                   TABLE 184 UK: CONNECTED CAR MARKET, BY FORM TYPE, 2024–2030 (‘000 UNITS)
             15.3.4 SPAIN
                       15.3.4.1 Growing innovations and technological developments in automotive sector to drive market
                                   TABLE 185 SPAIN: CONNECTED CAR MARKET, BY FORM TYPE, 2019–2023 (‘000 UNITS)
                                   TABLE 186 SPAIN: CONNECTED CAR MARKET, BY FORM TYPE, 2024–2030 (‘000 UNITS)
             15.3.5 ITALY
                       15.3.5.1 Increasing focus on safety features and emission-reduction technologies in vehicles to drive market
                                   TABLE 187 ITALY: CONNECTED CAR MARKET, BY FORM TYPE, 2019–2023 (‘000 UNITS)
                                   TABLE 188 ITALY: CONNECTED CAR MARKET, BY FORM TYPE, 2024–2030 (‘000 UNITS)
             15.3.6 RUSSIA
                       15.3.6.1 Rising demand for SUVs to drive market
                                   TABLE 189 RUSSIA: CONNECTED CAR MARKET, BY FORM TYPE, 2019–2023 (‘000 UNITS)
                                   TABLE 190 RUSSIA: CONNECTED CAR MARKET, BY FORM TYPE, 2024–2030 (‘000 UNITS)
             15.3.7 REST OF EUROPE
                       TABLE 191 REST OF EUROPE: CONNECTED CAR MARKET, BY FORM TYPE, 2019–2023 (‘000 UNITS)
                       TABLE 192 REST OF EUROPE: CONNECTED CAR MARKET, BY FORM TYPE, 2024–2030 (‘000 UNITS)
     15.4 NORTH AMERICA 
               FIGURE 62 NORTH AMERICA: CONNECTED CAR MARKET SNAPSHOT
               TABLE 193 NORTH AMERICA: CONNECTED CAR MARKET, BY COUNTRY, 2019–2023 (‘000 UNITS)
               TABLE 194 NORTH AMERICA: CONNECTED CAR MARKET, BY COUNTRY, 2024–2030 (‘000 UNITS)
             15.4.1 US
                       15.4.1.1 Growing consumer preference for in-car connectivity and entertainment systems to drive market
                                   TABLE 195 US: CONNECTED CAR MARKET, BY FORM TYPE, 2019–2023 (‘000 UNITS)
                                   TABLE 196 US: CONNECTED CAR MARKET, BY FORM TYPE, 2024–2030 (‘000 UNITS)
             15.4.2 CANADA
                       15.4.2.1 Rising focus on seamless smartphone integration and access to digital services to drive market
                                   TABLE 197 CANADA: CONNECTED CAR MARKET, BY FORM TYPE, 2019–2023 (‘000 UNITS)
                                   TABLE 198 CANADA: CONNECTED CAR MARKET, BY FORM TYPE, 2024–2030 (‘000 UNITS)
             15.4.3 MEXICO
                       15.4.3.1 Evolving consumer preferences toward incorporating advanced features to drive market
                                   TABLE 199 MEXICO: CONNECTED CAR MARKET, BY FORM TYPE, 2019–2023 (‘000 UNITS)
                                   TABLE 200 MEXICO: CONNECTED CAR MARKET, BY FORM TYPE, 2024–2030 (‘000 UNITS)
     15.5 REST OF THE WORLD 
               FIGURE 63 REST OF THE WORLD: CONNECTED CAR MARKET, 2024 VS. 2030 (‘000 UNITS)
               TABLE 201 REST OF THE WORLD: CONNECTED CAR MARKET, BY COUNTRY,  2019–2023 (‘000 UNITS)
               TABLE 202 REST OF THE WORLD: CONNECTED CAR MARKET, BY COUNTRY,  2024–2030 (‘000 UNITS)
             15.5.1 BRAZIL
                       15.5.1.1 High investments in research & development to drive market
                                   TABLE 203 BRAZIL: CONNECTED CAR MARKET, BY FORM TYPE, 2019–2023 (‘000 UNITS)
                                   TABLE 204 BRAZIL: CONNECTED CAR MARKET, BY FORM TYPE, 2024–2030 (‘000 UNITS)
             15.5.2 ARGENTINA
                       15.5.2.1 Increasing focus on sustainable mobility to drive market
                                   TABLE 205 ARGENTINA: CONNECTED CAR MARKET, BY FORM TYPE, 2019–2023 (‘000 UNITS)
                                   TABLE 206 ARGENTINA: CONNECTED CAR MARKET, BY FORM TYPE, 2024–2030 (‘000 UNITS)
             15.5.3 IRAN
                       15.5.3.1 Rising government support for cleaner and more efficient transportation solutions to drive market
                                   TABLE 207 IRAN: CONNECTED CAR MARKET, BY FORM TYPE, 2019–2023 (‘000 UNITS)
                                   TABLE 208 IRAN: CONNECTED CAR MARKET, BY FORM TYPE, 2024–2030 (‘000 UNITS)
             15.5.4 OTHER COUNTRIES
                       TABLE 209 OTHER COUNTRIES: CONNECTED CAR MARKET, BY FORM TYPE, 2019–2023 (‘000 UNITS)
                       TABLE 210 OTHER COUNTRIES: CONNECTED CAR MARKET, BY FORM TYPE, 2024–2030 (‘000 UNITS)
 
16 COMPETITIVE LANDSCAPE (Page No. - 254)
     16.1 OVERVIEW 
     16.2 KEY PLAYER STRATEGIES 
               TABLE 211 KEY PLAYERS STRATEGIES
     16.3 MARKET SHARE ANALYSIS 
               FIGURE 64 MARKET SHARE ANALYSIS OF KEY PLAYERS, 2023
               TABLE 212 CONNECTED CAR MARKET: DEGREE OF COMPETITION, 2023
     16.4 REVENUE ANALYSIS 
               FIGURE 65 REVENUE ANALYSIS OF KEY PLAYERS, 2021–2023
     16.5 COMPANY EVALUATION MATRIX: KEY PLAYERS 
             16.5.1 STARS
             16.5.2 EMERGING LEADERS
             16.5.3 PERVASIVE PLAYERS
             16.5.4 PARTICIPANTS
             16.5.5 COMPANY FOOTPRINT
                       FIGURE 66 CONNECTED CAR MARKET: COMPANY FOOTPRINT, 2023
                       TABLE 213 CONNECTED CAR MARKET: END MARKET FOOTPRINT, 2023
                       TABLE 214 CONNECTED CAR MARKET: HARDWARE FOOTPRINT, 2023
                       TABLE 215 CONNECTED CAR MARKET: REGION FOOTPRINT, 2023
                       FIGURE 67 CONNECTED CAR MARKET: COMPANY EVALUATION MATRIX, 2023
     16.6 COMPANY EVALUATION MATRIX: STARTUPS/SMES 
             16.6.1 PROGRESSIVE COMPANIES
             16.6.2 RESPONSIVE COMPANIES
             16.6.3 STARTING BLOCKS
             16.6.4 DYNAMIC COMPANIES
                       FIGURE 68 COMPANY EVALUATION MATRIX: STARTUPS/SMES, 2023
     16.7 COMPANY EVALUATION MATRIX: KEY MANUFACTURERS 
             16.7.1 STARS
             16.7.2 EMERGING LEADERS
             16.7.3 PERVASIVE PLAYERS
             16.7.4 PARTICIPANTS
             16.7.5 COMPANY FOOTPRINT
                       FIGURE 69 CONNECTED CAR MANUFACTURERS: COMPANY FOOTPRINT, 2023
                       TABLE 216 CONNECTED CAR MANUFACTURERS: SERVICE FOOTPRINT, 2023
                       TABLE 217 CONNECTED CAR MANUFACTURERS: REGION FOOTPRINT, 2023
                       TABLE 218 CONNECTED CAR MANUFACTURERS: FORM TYPE FOOTPRINT, 2023
                       FIGURE 70 CONNECTED CAR MANUFACTURERS: COMPANY EVALUATION MATRIX, 2023
             16.7.6 COMPETITIVE BENCHMARKING
                       TABLE 219 CONNECTED CAR MARKET: KEY STARTUPS/SMES
                       TABLE 220 CONNECTED CAR MARKET: COMPETITIVE BENCHMARKING OF KEY PLAYERS [STARTUPS/SMES]
     16.8 COMPANY VALUATION 
               FIGURE 71 COMPANY VALUATION, 2023 (USD BILLION)
     16.9 FINANCIAL METRICS 
               FIGURE 72 FINANCIAL METRICS, 2023 (USD BILLION)
     16.10 BRAND/PRODUCT COMPARISON 
               FIGURE 73 BRAND/PRODUCT COMPARISON
     16.11 COMPETITIVE SCENARIO AND TRENDS 
               16.11.1 PRODUCT LAUNCHES/DEVELOPMENTS/ENHANCEMENTS
                                   TABLE 221 CONNECTED CAR MARKET: PRODUCT LAUNCHES/DEVELOPMENTS/ENHANCEMENTS, JANUARY 2021–APRIL 2024
               16.11.2 DEALS
                                   TABLE 222 CONNECTED CAR MARKET: DEALS, JANUARY 2021–APRIL 2024
               16.11.3 EXPANSIONS
                                   TABLE 223 CONNECTED CAR MARKET: EXPANSIONS, JANUARY 2021–APRIL 2024
               16.11.4 OTHER DEVELOPMENTS
                                   TABLE 224 CONNECTED CAR MARKET: OTHER DEVELOPMENTS, JANUARY 2021–MARCH 2024
 
17 COMPANY PROFILES (Page No. - 288)
     17.1 KEY PLAYERS 
(Business overview, Products/Services offered, Recent developments, MnM view, Key strengths, Strategic choices, and Weaknesses and Competitive threats)*
             17.1.1 CONTINENTAL AG
                       TABLE 225 CONTINENTAL AG: COMPANY OVERVIEW
                       FIGURE 74 CONTINENTAL AG: COMPANY SNAPSHOT
                       TABLE 226 CONTINENTAL AG: PRODUCTS/SERVICES OFFERED
                       TABLE 227 CONTINENTAL AG: PRODUCT LAUNCHES/DEVELOPMENTS/ENHANCEMENTS
                       TABLE 228 CONTINENTAL AG: DEALS
                       TABLE 229 CONTINENTAL AG: EXPANSIONS
                       TABLE 230 CONTINENTAL AG: OTHER DEVELOPMENTS
             17.1.2 ROBERT BOSCH GMBH
                       TABLE 231 ROBERT BOSCH GMBH: COMPANY OVERVIEW
                       FIGURE 75 ROBERT BOSCH GMBH: COMPANY SNAPSHOT
                       TABLE 232 ROBERT BOSCH GMBH: PRODUCTS/SERVICES OFFERED
                       TABLE 233 ROBERT BOSCH GMBH: PRODUCT LAUNCHES/DEVELOPMENTS/ENHANCEMENTS
                       TABLE 234 ROBERT BOSCH GMBH: DEALS
                       TABLE 235 ROBERT BOSCH GMBH: OTHER DEVELOPMENTS
             17.1.3 HARMAN INTERNATIONAL
                       TABLE 236 HARMAN INTERNATIONAL: COMPANY OVERVIEW
                       FIGURE 76 HARMAN INTERNATIONAL: COMPANY SNAPSHOT
                       TABLE 237 HARMAN INTERNATIONAL: PRODUCTS/SERVICES OFFERED
                       TABLE 238 HARMAN INTERNATIONAL: PRODUCT LAUNCHES/DEVELOPMENTS/ENHANCEMENTS
                       TABLE 239 HARMAN INTERNATIONAL: DEALS
                       TABLE 240 HARMAN INTERNATIONAL: OTHER DEVELOPMENTS
             17.1.4 VISTEON
                       TABLE 241 VISTEON: COMPANY OVERVIEW
                       FIGURE 77 VISTEON: COMPANY SNAPSHOT
                       TABLE 242 VISTEON: PRODUCTS/SERVICES OFFERED
                       TABLE 243 VISTEON: PRODUCT LAUNCHES/DEVELOPMENTS/ENHANCEMENTS
                       TABLE 244 VISTEON: DEALS
                       TABLE 245 VISTEON: OTHER DEVELOPMENTS
             17.1.5 AIRBIQUITY INC.
                       TABLE 246 AIRBIQUITY INC.: COMPANY OVERVIEW
                       TABLE 247 AIRBIQUITY INC.: PRODUCTS/SERVICES OFFERED
                       TABLE 248 AIRBIQUITY INC.: DEALS
                       TABLE 249 AIRBIQUITY INC.: OTHER DEVELOPMENTS
             17.1.6 CLOUDMADE
                       TABLE 250 CLOUDMADE: COMPANY OVERVIEW
                       FIGURE 78 CLOUDMADE: COMPANY SNAPSHOT
                       TABLE 251 CLOUDMADE: PRODUCTS/SERVICES OFFERED
                       TABLE 252 CLOUDMADE: PRODUCT LAUNCHES/DEVELOPMENTS/ENHANCEMENTS
                       TABLE 253 CLOUDMADE: DEALS
                       TABLE 254 CLOUDMADE: EXPANSIONS
                       TABLE 255 CLOUDMADE: OTHER DEVELOPMENTS
             17.1.7 INTELLIAS
                       TABLE 256 INTELLIAS: COMPANY OVERVIEW
                       TABLE 257 INTELLIAS: PRODUCTS/SERVICES OFFERED
                       TABLE 258 INTELLIAS: PRODUCT LAUNCHES/DEVELOPMENTS/ENHANCEMENTS
                       TABLE 259 INTELLIAS: DEALS
                       TABLE 260 INTELLIAS: OTHER DEVELOPMENTS
             17.1.8 TESLA
                       TABLE 261 TESLA: COMPANY OVERVIEW
                       FIGURE 79 TESLA: COMPANY SNAPSHOT
                       TABLE 262 TESLA: PRODUCTS/SERVICES OFFERED
                       TABLE 263 TESLA: DEALS
             17.1.9 FORD MOTOR COMPANY
                       TABLE 264 FORD MOTOR COMPANY: COMPANY OVERVIEW
                       FIGURE 80 FORD MOTOR COMPANY: COMPANY SNAPSHOT
                       TABLE 265 FORD MOTOR COMPANY: PRODUCTS/SERVICES OFFERED
                       TABLE 266 FORD MOTOR COMPANY: DEALS
                       TABLE 267 FORD MOTOR COMPANY: OTHER DEVELOPMENTS
               17.1.10 AUDI
                                   TABLE 268 AUDI: COMPANY OVERVIEW
                                   FIGURE 81 AUDI: COMPANY SNAPSHOT
                                   TABLE 269 AUDI: PRODUCTS/SERVICES OFFERED
                                   TABLE 270 AUDI: PRODUCT LAUNCHES/DEVELOPMENTS/ENHANCEMENTS
                                   TABLE 271 AUDI: DEALS
                                   TABLE 272 AUDI: EXPANSIONS
               17.1.11 AT&T
                                   TABLE 273 AT&T: COMPANY OVERVIEW
                                   FIGURE 82 AT&T: COMPANY SNAPSHOT
                                   TABLE 274 AT&T: PRODUCTS/SERVICES OFFERED
                                   TABLE 275 AT&T: PRODUCT LAUNCHES/DEVELOPMENTS/ENHANCEMENTS
                                   TABLE 276 AT&T: DEALS
                                   TABLE 277 AT&T: OTHER DEVELOPMENTS
               17.1.12 QUALCOMM TECHNOLOGIES, INC.
                                   TABLE 278 QUALCOMM TECHNOLOGIES, INC.: COMPANY OVERVIEW
                                   FIGURE 83 QUALCOMM TECHNOLOGIES, INC.: COMPANY SNAPSHOT
                                   TABLE 279 QUALCOMM TECHNOLOGIES, INC.: PRODUCTS/SERVICES OFFERED
                                   TABLE 280 QUALCOMM TECHNOLOGIES, INC.:  PRODUCT LAUNCHES/DEVELOPMENTS /ENHANCEMENTS
                                   TABLE 281 QUALCOMM TECHNOLOGIES, INC.: DEALS
                                   TABLE 282 QUALCOMM TECHNOLOGIES, INC.: OTHER DEVELOPMENTS
               17.1.13 VERIZON
                                   TABLE 283 VERIZON: COMPANY OVERVIEW
                                   FIGURE 84 VERIZON COMMUNICATIONS: COMPANY SNAPSHOT
                                   TABLE 284 VERIZON: PRODUCTS/SERVICES OFFERED
                                   TABLE 285 VERIZON: DEALS
               17.1.14 TOMTOM INTERNATIONAL BV
                                   TABLE 286 TOMTOM INTERNATIONAL BV: COMPANY OVERVIEW
                                   FIGURE 85 TOMTOM INTERNATIONAL BV: COMPANY SNAPSHOT
                                   TABLE 287 TOMTOM INTERNATIONAL BV: PRODUCTS/SERVICES OFFERED
                                   TABLE 288 TOMTOM INTERNATIONAL BV:  PRODUCT LAUNCHES/DEVELOPMENTS/ENHANCEMENTS
                                   TABLE 289 TOMTOM INTERNATIONAL BV: DEALS
                                   TABLE 290 TOMTOM INTERNATIONAL BV: OTHER DEVELOPMENTS
               17.1.15 SIERRA WIRELESS
                                   TABLE 291 SIERRA WIRELESS: COMPANY OVERVIEW
                                   FIGURE 86 SIERRA WIRELESS: COMPANY SNAPSHOT
                                   TABLE 292 SIERRA WIRELESS: PRODUCTS/SERVICES OFFERED
                                   TABLE 293 SIERRA WIRELESS:  PRODUCT LAUNCHES/DEVELOPMENTS/ENHANCEMENTS
                                   TABLE 294 SIERRA WIRELESS: DEALS
                                   TABLE 295 SIERRA WIRELESS: OTHER DEVELOPMENTS
               17.1.16 APTIV
                                   TABLE 296 APTIV: COMPANY OVERVIEW
                                   FIGURE 87 APTIV: COMPANY SNAPSHOT
                                   TABLE 297 APTIV: PRODUCTS/SERVICES OFFERED
                                   TABLE 298 APTIV: PRODUCT LAUNCHES/DEVELOPMENTS/ENHANCEMENTS
                                   TABLE 299 APTIV: DEALS
                                   TABLE 300 APTIV: EXPANSIONS
               17.1.17 OCTO GROUP S.P.A.
                                   TABLE 301 OCTO GROUP S.P.A.: COMPANY OVERVIEW
                                   TABLE 302 OCTO GROUP S.P.A.: PRODUCTS/SERVICES OFFERED
                                   TABLE 303 OCTO GROUP S.P.A.: PRODUCT LAUNCHES/DEVELOPMENTS/ENHANCEMENTS
                                   TABLE 304 OCTO GROUP S.P.A.: DEALS
     17.2 OTHER PLAYERS 
             17.2.1 PANASONIC
                       TABLE 305 PANASONIC: COMPANY OVERVIEW
             17.2.2 TECH MAHINDRA
                       TABLE 306 TECH MAHINDRA: COMPANY OVERVIEW
             17.2.3 MICROSOFT AZURE
                       TABLE 307 MICROSOFT AZURE: COMPANY OVERVIEW
             17.2.4 ZUBIE
                       TABLE 308 ZUBIE: COMPANY OVERVIEW
             17.2.5 BMW
                       TABLE 309 BMW: COMPANY OVERVIEW
             17.2.6 DAIMLER AG
                       TABLE 310 DAIMLER AG: COMPANY OVERVIEW
             17.2.7 TELEFONICA
                       TABLE 311 TELEFONICA: COMPANY OVERVIEW
             17.2.8 LUXOFT
                       TABLE 312 LUXOFT: COMPANY OVERVIEW
             17.2.9 UBER TECHNOLOGIES
                       TABLE 313 UBER TECHNOLOGIES: COMPANY OVERVIEW
             17.2.10 NXP SEMICONDUCTORS
                                  TABLE 314 NXP SEMICONDUCTORS: COMPANY OVERVIEW
             17.2.11 GEOTAB
                                   TABLE 315 GEOTAB: COMPANY OVERVIEW
             17.2.12 RED HAT INC.
                                   TABLE 316 RED HAT INC.: COMPANY OVERVIEW
             17.2.13 ARGO AI
                                   TABLE 317 ARGO AI: COMPANY OVERVIEW
*Details on Business overview, Products/Services offered, Recent developments, MnM view, Key strengths, Strategic choices, and Weaknesses and Competitive threats might not be captured in case of unlisted companies
 
18 RECOMMENDATIONS BY MARKETSANDMARKETS (Page No. - 377)
     18.1 ASIA PACIFIC AND EUROPE TO BE SIGNIFICANT MARKETS FOR CONNECTED CARS 
     18.2 AFTERMARKET TO OFFER LUCRATIVE OPPORTUNITIES TO AUTOMAKERS 
     18.3 ON-ROAD ASSISTANCE SERVICE TO EXHIBIT SIGNIFICANT GROWTH 
     18.4 CONCLUSION 
 
19 APPENDIX (Page No. - 379)
     19.1 INSIGHTS FROM INDUSTRY EXPERTS 
     19.2 DISCUSSION GUIDE 
     19.3 KNOWLEDGESTORE: MARKETSANDMARKETS’  SUBSCRIPTION PORTAL 
     19.4 CUSTOMIZATION OPTIONS 
             19.4.1 CONNECTED CAR SERVICE MARKET, BY VEHICLE TYPE
                       19.4.1.1 BEV
                       19.4.1.2 PHEV
                       19.4.1.3 FCEV
             19.4.2 CONNECTED CAR MARKET, BY CELLULAR NETWORK
                       19.4.2.1 4G/LTE
                       19.4.2.2 5G
             19.4.3 CONNECTED CAR HARDWARE MARKET, BY AFTERMARKET
                       19.4.3.1 Head unit
                       19.4.3.2 Central gateway
                       19.4.3.3 Intelligent antenna
                       19.4.3.4 Electronic control unit (ECU)
                       19.4.3.5 Telematic control unit (TCU)
                       19.4.3.6 Keyless entry system
                       19.4.3.7 Sensor
     19.5 RELATED REPORTS 
     19.6 AUTHOR DETAILS 

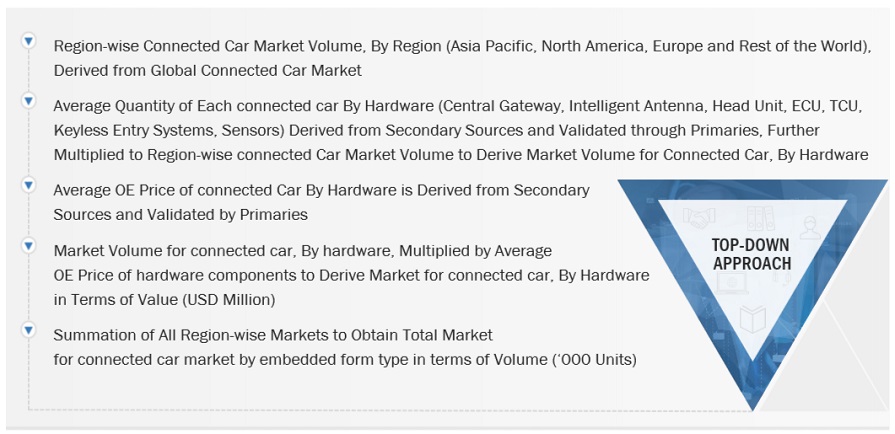
Various secondary sources, directories, and databases have been used to identify and collect information for an extensive connected car market study. The study involved four main activities in estimating the current size of the connected car market: secondary research, validation through primary research, assumptions, and market analysis. Exhaustive secondary research was carried out to collect information on the market, such as the number of hardware used in cars, the number of on-board units installed in the vehicles, subscription cost from different service providers, annual renewal percentage of connected car service in bundles/subscriptions and upcoming technologies and trends. The next step was to validate these findings, assumptions, and market analysis with industry experts across the value chain through primary research. The top-down approach was employed to estimate the complete market size for different segments considered in this study.

Secondary Research

In the secondary research process, various secondary sources, such as company annual reports, presentations, and press releases; associations, such as Organisation Internationale des Constructeurs d'Automobiles (OICA), the International Energy Agency (IEA), European Automobile Manufacturers’ Association, Canadian Automobile Association (CAA), country-level automotive associations and trade organizations, and the US Department of Transportation (DOT); industry association publications, such as publications of OEMs’ vehicle sales; connected car magazine articles, directories, and technical handbooks; World Economic Outlook; trade websites, and technical articles, were used to identify and collect information useful for an extensive commercial study of the global connected car market.

Primary Research

In the primary research process, various primary sources from both the supply and demand sides were interviewed to obtain qualitative and quantitative information on the market. The primary sources from the supply side included industry experts such as CXOs, vice presidents, directors from business development, marketing, product development/innovation teams, and related key executives from various key companies. Various system integrators, industry associations, independent consultants/industry veterans, and key opinion leaders were also interviewed.

Various sources from both the supply and demand sides were interviewed in the primary research process to obtain qualitative and quantitative information for this report. The primary sources from the supply side include industry experts such as research and development experts, CEOs, CTOs, COOS, vice presidents, marketing directors, technology and innovation directors, and related key executives from different vital companies operating in the connected car market.

After the complete market engineering, which includes calculations for market statistics, market breakdown, market size estimations, market forecasting, and data triangulation, extensive primary research has been conducted to gather information and verify and validate the critical numbers arrived at. Primary research has also been undertaken to identify and validate the segmentation, industry trends, key players, competitive landscape, and market dynamics, such as drivers, restraints, opportunities, challenges, industry trends, and key strategies. Extensive qualitative and quantitative analysis has been performed on the complete market engineering process to list key information/insights throughout the report.

After interacting with industry experts, we have also conducted brief sessions with highly experienced independent consultants to reinforce the findings from our primaries. This and the in-house subject matter expert's opinions have led us to the conclusions described in this report's remainder.
Connected Car Market Size, and Share

To know about the assumptions considered for the study, download the pdf brochure

Market Size Estimation

A detailed market estimation approach was followed to estimate and validate the value and volume of the connected car market and other dependent submarkets, as mentioned below:

  • The market size, by volume, of the connected car market has been derived by studying various vehicle models equipped with connected car services at the country level.
  • In terms of volume, the regional-level connected car market by vehicle type has been multiplied by the regional-level average selling price (ASP) for each service type to get the connected car market for each service in terms of value.
  • All vehicle level penetration rates, percentage shares, splits, and breakdowns for the connected car market were determined using secondary sources and verified through primary sources.
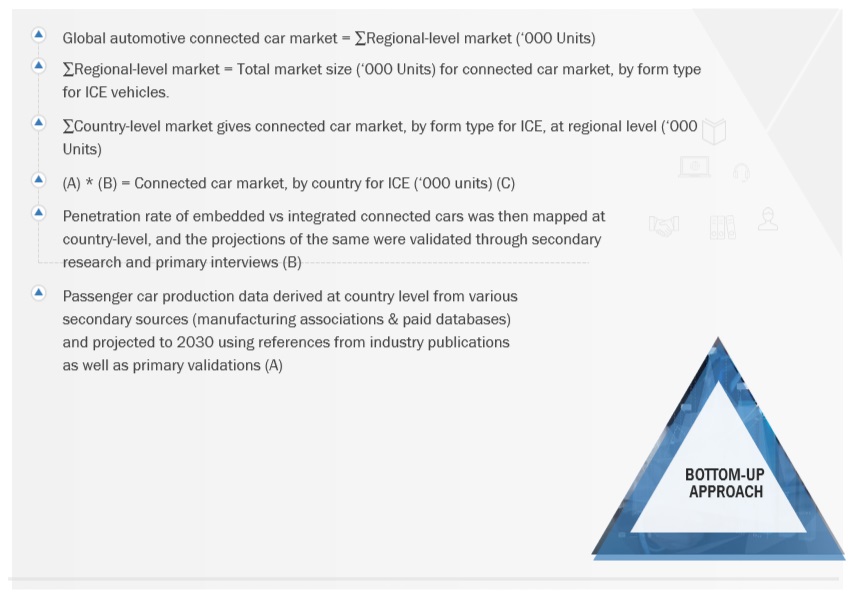
  • The summation of the regional-level market would give the global connected car market by vehicle type. The total value of each region was then summed up to derive the total value of the connected car market by service type.
  • All key macro indicators affecting the revenue growth of the market segments and subsegments have been accounted for, viewed in extensive detail, verified through primary research, and analyzed to get the validated and verified quantitative and qualitative data.
  • The gathered market data has been consolidated and added with detailed inputs, analyzed, and presented in this report.
  • The bottom-up approach has been used to estimate and validate the size of the global market. The market size, by volume, of the connected car market has been derived by studying various vehicles.

Connected Car Market Size: Bottom-Up Approach (Form Type And Region)
Connected Car Market Bottom Up Approach

To know about the assumptions considered for the study, Request for Free Sample Report
Connected Car Market Top Down Approach

Data Triangulation

All percentage shares, splits, and breakdowns have been determined using secondary sources and verified by primary sources. All parameters that affect the markets covered in this research study have been accounted for, viewed in extensive detail, and analyzed to obtain the final quantitative and qualitative data. This data has been consolidated and enhanced with detailed input and analysis and presented in the report. The following figure illustrates this study's overall market size estimation process.

Market Definition

Definition: According to Geotab, a connected car is a vehicle that is equipped with mobile technology and, therefore, “connected” via the internet. Telematics is also used to connect cars using a small device that plugs into the vehicle or through embedded technology. The telematics device acts as an Internet of Things (IoT) hub that sends vehicle data to a cloud service, which can be processed and accessed by the vehicle owner or fleet manager.

According to Bosch, a connected vehicle is defined as one that has devices that use sensors and wireless connectivity to connect with other components within the vehicle and with networks outside it to provide an enhanced driving experience. It also supports vehicle-to-vehicle and vehicle-to-infrastructure communication.

Stakeholders

  • Connected car manufacturers.
  • Automotive electronic component and software suppliers
  • Automotive original equipment manufacturers (OEMs)
  • Government regulatory bodies
  • Telecommunication companies
  • Automotive testing and certification services
  • Automotive aftermarket suppliers
  • Fleet management companies.
  • Satellite communication providers
  • Insurance companies
  • Cybersecurity firms

Report Objectives

  • To define, describe, segment, and forecast the connected car market in terms of volume (thousand units) and value (USD million)
  • To segment and forecast the market in terms of value and volume based on
    • By service (navigation, remote diagnostics, multimedia streaming, social media & other apps, OTA updates, on-road assistance, eCall & SOS assistance, remote operation, auto parking/connected parking, autopilot, home integration, and stolen vehicle recovery/warning) at the regional level, in terms of value at the regional level
    • By end market (OEM and aftermarket), in terms of value at the regional level
    • By form type (embedded and integrated), in terms of volume at the regional level
    • By hardware (head unit, central gateway, intelligent antenna, electronic control unit, telematics control unit, keyless entry system, and sensor), in terms of value at the regional level
    • By transponder (onboard unit and roadside unit), in terms of volume at the regional level
    • By network (DSRC and cellular) at the regional level, in terms of volume
    • By connecting the electric car market based on vehicle type (BEV, PHEV, and FCEV) in terms of value at the regional level
    • Region ((Asia Pacific, Europe, North America, and Rest of the World (RoW))
  • To understand the market dynamics (Drivers, Restraints, Opportunities, and Challenges) and conduct Patent Analysis, Pricing Analysis, Recession Impact, Key Buying Criteria, Trade Analysis, Technology Analysis, ASP Analysis, Trades and Conferences, Case Study Analysis, Supply Chain Analysis, Regulatory Analysis, critical conference and events, and Ecosystem Mapping
  • To understand the dynamics of the market players and distinguish them into stars, emerging leaders, pervasive players, and participants according to their product portfolio strength and business strategies.
  • To strategically analyze markets concerning individual growth trends, prospects, and contributions to the total market
  • To analyze recent developments, such as partnerships, supply agreements, joint ventures/mergers and acquisitions, geographic expansions, and product developments of key players in the market

Available Customizations

Connected Car Service Market By Vehicle Type

  • BEV
  • PHEV
  • FCEV

Connected Car Market, By Cellular Network

  • 2.14G/LTE
  • 5G

Connected Car Hardware Market, By Aftermarket

  • Head unit
  • Central gateway
  • Intelligent Antenna
  • Electronic Control Unit (ECU)
  • Telematic control unit (TCU)
  • Keyless entry system
  • Sensor

Detailed Analysis And Profiling Of Additional Market Players (Up To 3)

Custom Market Research Services

We will customize the research for you, in case the report listed above does not meet with your exact requirements. Our custom research will comprehensively cover the business information you require to help you arrive at strategic and profitable business decisions.

Request Customization

Instant Answers with GPT - Ask Now!

Ask real questions. Get complete answers !
Report Code
AT 5974
Published ON
Jun, 2024
Choose License Type
BUY NOW
  • SHARE
X
Request Customization
Speak to Analyst
Speak to Analyst
OR FACE-TO-FACE MEETING
PERSONALIZE THIS RESEARCH
  • Triangulate with your Own Data
  • Get Data as per your Format and Definition
  • Gain a Deeper Dive on a Specific Application, Geography, Customer or Competitor
  • Any level of Personalization
REQUEST A FREE CUSTOMIZATION
LET US HELP YOU!
  • What are the Known and Unknown Adjacencies Impacting the Connected Car Market
  • What will your New Revenue Sources be?
  • Who will be your Top Customer; what will make them switch?
  • Defend your Market Share or Win Competitors
  • Get a Scorecard for Target Partners
CUSTOMIZED WORKSHOP REQUEST
  • Call Us
  • +1-888-600-6441 (Corporate office hours)
  • +1-888-600-6441 (US/Can toll free)
  • +44-800-368-9399 (UK office hours)
CONNECT WITH US
ABOUT TRUST ONLINE
©2024 MarketsandMarkets Research Private Ltd. All rights reserved
DMCA.com Protection Status Website Feedback