Asset Integrity Management Market

Asset Integrity Management Market Size, Share & Industry Growth Analysis Report by Service Type (NDT, Risk-based Inspection, Corrosion Management, Pipeline Integrity, Hazard Identification, Structural Integrity Management, Reliability Availability and Maintainability) - Global Forecast to 2029

Report Code: SE 5529 Apr, 2024, by marketsandmarkets.com

[259 Pages Report] The global asset integrity management market size is expected to be valued at USD 23.9 billion in 2024 and is projected to reach USD 31.5 billion by 2029; growing at a CAGR of 5.7% from 2024 to 2029.  

The asset integrity management market is witnessing steady growth globally, driven by increasing emphasis on regulatory compliance, safety, and operational efficiency across industries. Factors such as aging infrastructure, stringent regulatory requirements, and technological advancements contribute to market expansion. Industries such as oil and gas, power generation, manufacturing, and aerospace are primary drivers of demand for asset integrity management solutions. Adopting digitalization and IoT technologies is also reshaping the market landscape, enabling real-time monitoring and predictive maintenance strategies. However, challenges such as high installation costs and the complexity of integration hinder widespread adoption.
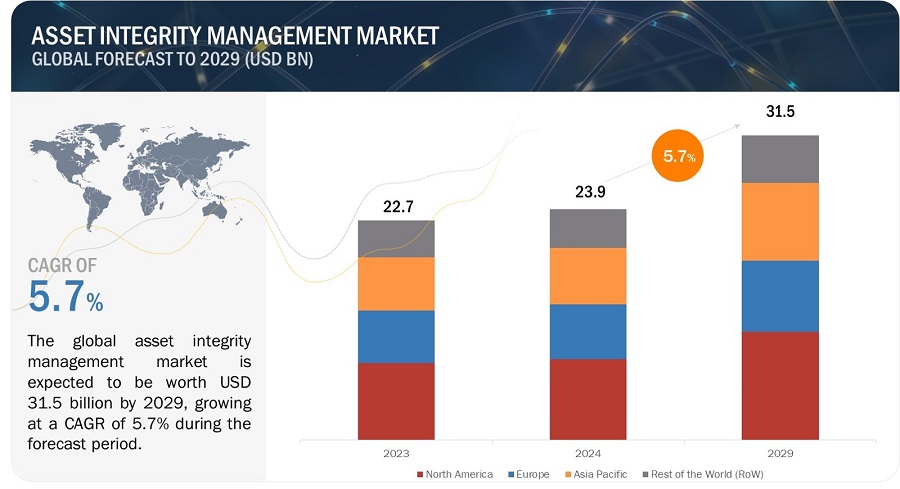
Asset Integrity Management Market

Asset Integrity Management Market

Asset Integrity Management Market Forecast to 2029

To know about the assumptions considered for the study, Request for Free Sample Report

Asset Integrity Management Market Dynamics

Driver: Increasing need to maintain aging assets in risk-based industries

The increasing need to maintain aging assets in risk-based industries is a critical driver for asset integrity management. As infrastructure and equipment age, they become more susceptible to deterioration, posing heightened risks to operational reliability and safety. Effective asset integrity management is essential to mitigate risks and ensure regulatory compliance in industries such as oil and gas, petrochemicals, and power generation, where assets are subject to harsh operating conditions. The imperative to prolong asset lifespan and optimize performance necessitates proactive maintenance strategies, leveraging risk-based approaches to prioritize resources and interventions based on asset criticality and potential failure modes. As organizations strive to minimize downtime, enhance safety, and maximize asset value, the increasing focus on maintaining aging assets underscores the significance of asset integrity management solutions in risk-based industries.

Restraint: Complexity and high cost of system installation

The complexity and high installation cost are significant restraints in the asset integrity management market. Implementing asset integrity management systems often involves intricate integration processes, requiring expertise and resources, which can be time-consuming and costly for organizations. Additionally, the initial investment required for installation, including software, hardware, and training, presents financial barriers for some companies and significantly smaller enterprises with limited budgets. As a result, the complexity and expense associated with installation hinder the widespread adoption of asset integrity management solutions, particularly among organizations facing budget constraints or resource limitations.

Opportunity: Expansion of the power sector in emerging economies

Expanding the power sector in emerging nations presents a significant asset integrity management market opportunity. As developing countries undergo rapid industrialization and urbanization, there is a growing demand for reliable and efficient power generation and distribution infrastructure. This expansion necessitates robust asset integrity management practices to ensure the reliability, safety, and regulatory compliance of critical assets such as power plants, transmission lines, and substations. Additionally, emerging economies often lack established asset management frameworks, creating opportunities for asset integrity management providers to offer tailored solutions and expertise to support the development and optimization of power infrastructure in these regions. Asset integrity management companies can leverage growth opportunities and expand their market presence by capitalizing on expanding the power sector in emerging nations.

Challenge: Harsh weather conditions to challenge inspection and monitoring of assets

The challenge of harsh weather conditions poses significant obstacles to inspecting and monitoring assets in the asset integrity management market. In industries such as oil and gas, offshore wind, and maritime, assets are often located in environments characterized by extreme temperatures, high winds, corrosive saltwater, and other adverse weather conditions. These conditions increase the risk of asset degradation and pose challenges for inspection and monitoring activities, as they can impede access to assets and compromise the effectiveness of monitoring equipment. As a result, asset integrity management providers must develop robust strategies and technologies capable of withstanding harsh weather conditions while ensuring accurate and reliable asset assessment to mitigate risks and ensure operational reliability and safety.

Asset Integrity Management Market Ecosystem

The asset integrity management market is dominated by established and financially sound manufacturers with extensive experience in the industry. These companies have diversified product portfolios, cutting-edge technologies, and strong global sales and marketing networks. Leading players in the market include SGS Société Générale de Surveillance SA. (Switzerland), Bureau Veritas (France), TechnipFMC plc (UK), John Wood Group PLC (UK), Fluor Corporation (US) and Baker Hughes Company (US) among others.
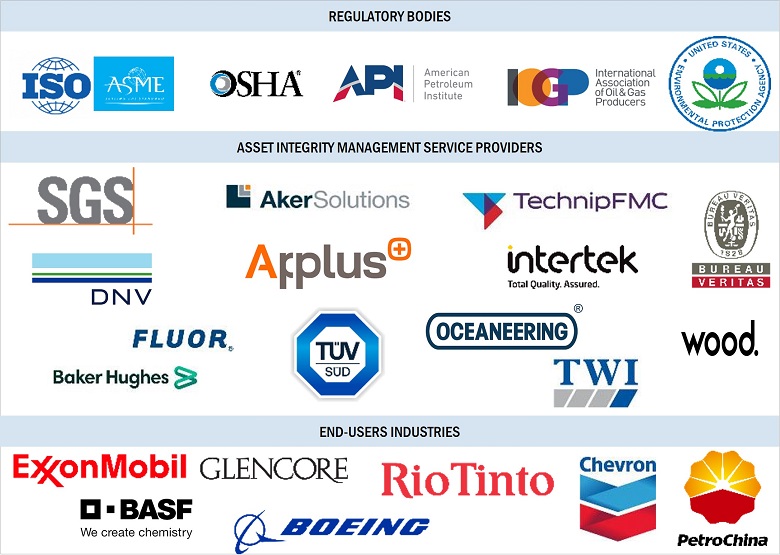
Asset Integrity Management Market by Ecosystem

The Non-destructive testing (NDT) inspection segment by service type is expected to account for the largest asset integrity management market share during the forecast period.

Non-destructive testing (NDT) inspection is expected to dominate the market share during the forecast period due to its critical role in ensuring industrial assets' safety, reliability, and compliance across various sectors. Unlike traditional testing methods that require dismantling or damaging the material being inspected, NDT techniques allow for thorough examination without causing harm, making it a preferred choice for asset evaluation. Its versatility enables the detection of flaws, defects, or weaknesses in materials, welds, and components, providing valuable insights into asset condition without disrupting operations. As industries increasingly prioritize safety, regulatory compliance, and operational efficiency, the demand for NDT inspection services continues to surge, solidifying its position as the leading service type in the asset integrity management market.

The power industry in asset inetegrity management is to hold the largest market share during the forecast period.

The power industry is expected to have the highest market share in the upcoming years due to several reasons. As renewable energy sources are becoming more popular, there's a need for strong asset management to ensure reliability and efficiency. Also, since power infrastructure is aging globally, there's a growing demand for monitoring and maintenance solutions to comply with regulations and reduce risks. Additionally, the increasing need for electricity, especially in emerging economies, leads to investments in power infrastructure, further boosting demand for asset management services. Moreover, the industry's adoption of digitalization and smart grid technologies requires advanced monitoring and maintenance solutions, solidifying its position in the asset management market.

Based on plant location offshore oil & gas segment to hold the highest growth rate in the asset integrity management market.

The offshore sub-segment within the oil and gas industry is projected to witness the highest CAGR in the market due to various factors. Offshore facilities, including platforms and subsea infrastructure, face unique challenges such as corrosion and extreme environmental conditions, necessitating robust asset integrity management practices. With increasing global energy demand, there's a growing focus on exploring offshore reserves in deeper waters, driving the demand for advanced asset integrity management solutions. Stringent regulatory requirements governing offshore operations further emphasize the need for effective asset management practices. Additionally, the industry's commitment to risk mitigation and operational efficiency reinforces the importance of asset integrity management in the offshore sector, contributing to its anticipated high CAGR in the market.

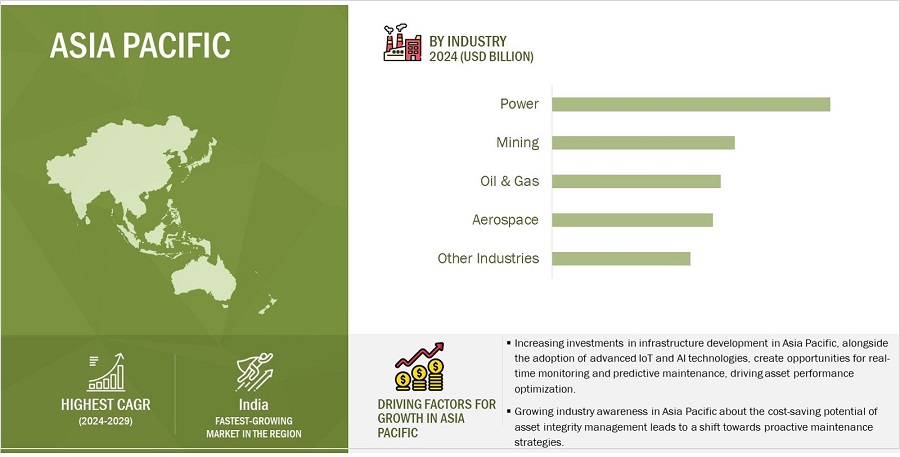
The asset integrity management market in the Asia Pacific region will exhibit the highest CAGR during the forecast period.

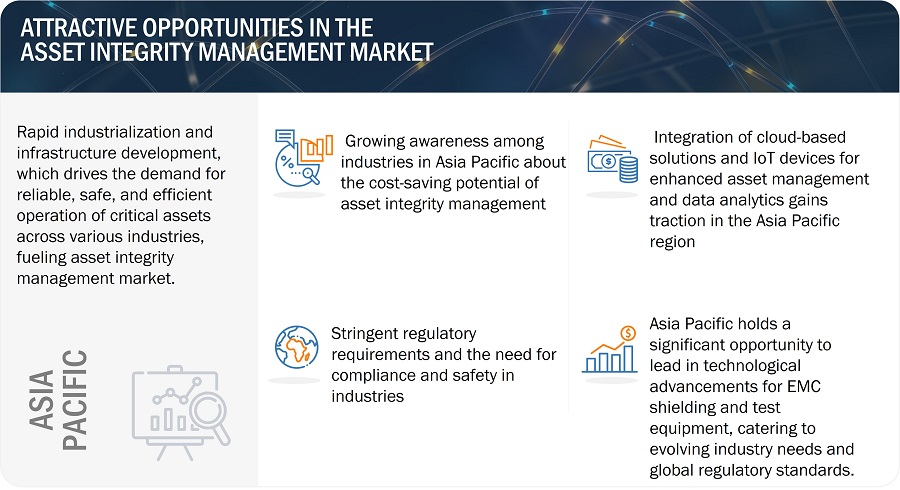
Asia Pacific is anticipated to demonstrate the highest CAGR in the market due to several key factors. The region's rapid industrialization and infrastructure development are fueling demand for reliable asset integrity management solutions to ensure operational safety and reliability across diverse sectors. Furthermore, the rising adoption of advanced technologies like IoT and AI in industries such as oil and gas, manufacturing, and power generation presents opportunities for real-time monitoring and predictive maintenance, driving further growth in the market. Moreover, the expanding energy demand in emerging economies within Asia Pacific and investments in renewable energy sources stimulate the need for comprehensive asset integrity management services. Lastly, stringent regulatory requirements and a growing awareness of the importance of asset optimization and safety contribute to the region's expected high CAGR in the asset integrity management market.
Asset Integrity Management Market
 by Region

Asset Integrity Management Market by Region

To know about the assumptions considered for the study, download the pdf brochure

Key Market Players

The asset integrity management companies is dominated by players such as SGS Société Générale de Surveillance SA. (Switzerland), Bureau Veritas (France), TechnipFMC plc (UK), John Wood Group PLC (UK), Fluor Corporation (US) and Baker Hughes Company (US) and others.

Get online access to the report on the World's First Market Intelligence Cloud

  • Easy to Download Historical Data & Forecast Numbers
  • Company Analysis Dashboard for high growth potential opportunities
  • Research Analyst Access for customization & queries
  • Competitor Analysis with Interactive dashboard
  • Latest News, Updates & Trend analysis
Request Sample

Scope of the Report

Report Metric

Details

Estimated Market Size USD 23.9 billion in 2024
Projected Market Size USD 31.5 billion by 2029
Asset Integrity Management Market Growth Rate CAGR of 5.7%

Market size available for years

2020-2029

Base year considered

2023

Forecast period

2024-2029

Forecast units

Value (USD Thousand/Million/Billion)

Segments Covered

By Service Type, By Industry

Geographies covered

North America, Europe, Asia Pacific, and Rest of the world (RoW)

Companies covered

The major market players include SGS Société Générale de Surveillance SA. (Switzerland), Bureau Veritas (France), TechnipFMC plc (UK), John Wood Group PLC (UK), Fluor Corporation (US), Baker Hughes Company (US), (Total of 25 players are profiled)

Asset Integrity Management Highlights

The study categorizes the asset integrity management market based on the following segments:

Segment

Subsegment

By Service Type

  • Risk-based Inspection (RBI)
  • Non-Destructive Testing (NDT) Inspection
  • Corrosion Management
  • Pipeline Integrity Management
  • Hazard Identification (HAZID) Study
  • Structural Integrity Management
  • Reliability, Availability and Maintainability (RAM) Study
  • Others

By Industry

  • Oil & Gas
  • Power
  • Mining
  • Aerospace
  • Others

By Region

  • North America
  • Europe
  • Asia Pacific
  • RoW

Recent Developments

  • In October 2023, Applus+ in Italy secures a 3-year Master Agreement for inspection and expediting services with a key Oil & Gas industry player, covering global operations. The agreement involves Applus+ professionals supporting the client, specializing in oil and gas drilling and production solutions. Additionally, Applus+ will provide asset integrity services to ensure compliance with regulatory and voluntary standards for enhanced safety and performance.
  • In May 2023, Fluor Corporation's subsidiary, Stork, secures a five-year contract with Harbour Energy, extending asset integrity services in the North Sea for the AELE hub (Armada, Everest, Lomond, and Erskine) and expanding services to Solan, the J-Area, and the Great Britannia Area. This partnership reinforces Stork's commitment to providing comprehensive asset integrity services in the offshore oil and gas industry.
  • In March 2023, Baker Hughes and BP p.l.c. are collaborating to refine further and develop CordantTM, an integrated suite of solutions for asset performance management and process optimization, emphasizing asset integrity management. This collaboration aims to leverage technology and expertise to enhance the reliability and efficiency of energy infrastructure while minimizing risks associated with asset integrity.
  • In January 2023, Bureau Veritas officially opened its new regional headquarters in Riyadh, solidifying its 30-year presence in Saudi Arabia and emphasizing its dedication to the Middle East's growth, especially in Saudi Arabia and the UAE. The new regional headquarters in Riyadh positions Bureau Veritas to enhance its asset integrity portfolio, facilitating further expansion and development opportunities in the Middle East.
  • In March 2022, Baker Hughes collaborated with C3.ai, Inc., Accenture, and Microsoft, aiming to develop industrial asset management (IAM) solutions leveraging digital technologies to enhance safety, efficiency, and emissions profiles of physical assets in the energy and industrial sectors. This collaboration focuses on optimizing plant equipment, operational processes, and business operations, ultimately contributing to improved uptime, flexibility, capital planning, and energy efficiency management, thereby enhancing asset integrity management practices.

Frequently Asked Questions(FAQs):

To speak to our analyst for a discussion on the above findings, click Speak to Analyst

TABLE OF CONTENTS
 
1 INTRODUCTION (Page No. - 32)
    1.1 STUDY OBJECTIVES 
    1.2 MARKET DEFINITION 
    1.3 STUDY SCOPE 
           1.3.1 INCLUSIONS AND EXCLUSIONS
           1.3.2 MARKETS COVERED
                    FIGURE 1 ASSET INTEGRITY MANAGEMENT MARKET SEGMENTATION
           1.3.3 REGIONAL SCOPE
           1.3.4 YEARS CONSIDERED
    1.4 CURRENCY CONSIDERED 
    1.5 UNIT CONSIDERED 
    1.6 LIMITATIONS 
    1.7 STAKEHOLDERS 
    1.8 SUMMARY OF CHANGES 
    1.9 RECESSION IMPACT 
 
2 RESEARCH METHODOLOGY (Page No. - 37)
    2.1 RESEARCH DATA 
           FIGURE 2 ASSET INTEGRITY MANAGEMENT MARKET: RESEARCH DESIGN
           2.1.1 SECONDARY AND PRIMARY RESEARCH
           2.1.2 SECONDARY DATA
                    2.1.2.1 Major secondary sources
                    2.1.2.2 Key data from secondary sources
           2.1.3 PRIMARY DATA
                    2.1.3.1 Breakdown of primaries
                    2.1.3.2 Key data from primary sources
                    2.1.3.3 Key industry insights
                    2.1.3.4 List of primary interview participants
    2.2 MARKET SIZE ESTIMATION METHODOLOGY 
           FIGURE 3 ASSET INTEGRITY MANAGEMENT MARKET SIZE ESTIMATION METHODOLOGY
           2.2.1 BOTTOM-UP APPROACH
                    2.2.1.1 Approach to estimate market size using bottom-up analysis (demand side)
                               FIGURE 4 ASSET INTEGRITY MANAGEMENT MARKET SIZE ESTIMATION: BOTTOM-UP APPROACH
           2.2.2 TOP-DOWN APPROACH
                    2.2.2.1 Approach to estimate market size using top-down analysis (supply side)
                               FIGURE 5 ASSET INTEGRITY MANAGEMENT MARKET: TOP-DOWN APPROACH
                               FIGURE 6 ASSET INTEGRITY MANAGEMENT MARKET: SUPPLY-SIDE ANALYSIS
    2.3 MARKET BREAKDOWN AND DATA TRIANGULATION 
           FIGURE 7 ASSET INTEGRITY MANAGEMENT MARKET: DATA TRIANGULATION
    2.4 RESEARCH ASSUMPTIONS 
           FIGURE 8 ASSET INTEGRITY MANAGEMENT MARKET: RESEARCH ASSUMPTIONS
    2.5 RESEARCH LIMITATIONS 
           FIGURE 9 ASSET INTEGRITY MANAGEMENT MARKET: RESEARCH LIMITATIONS
    2.6 RISK ASSESSMENT 
           TABLE 1 ASSET INTEGRITY MANAGEMENT MARKET: RISK ASSESSMENT
    2.7 PARAMETERS CONSIDERED TO ANALYZE RECESSION IMPACT ON ASSET INTEGRITY MANAGEMENT MARKET 
           TABLE 2 PARAMETERS CONSIDERED TO ANALYZE RECESSION IMPACT ON ASSET INTEGRITY MANAGEMENT MARKET
 
3 EXECUTIVE SUMMARY (Page No. - 49)
    FIGURE 10 NON-DESTRUCTIVE TESTING INSPECTION TO ACCOUNT FOR LARGER SHARE THROUGHOUT FORECAST PERIOD
    FIGURE 11 OFFSHORE PLANTS WITHIN OIL & GAS INDUSTRY TO CAPTURE DOMINANT SHARE BY 2029
    FIGURE 12 POWER INDUSTRY TO COMMAND ASSET INTEGRITY MANAGEMENT MARKET BY 2029
    FIGURE 13 NORTH AMERICA HELD LARGEST SHARE OF ASSET INTEGRITY MANAGEMENT MARKET IN 2023
 
4 PREMIUM INSIGHTS (Page No. - 53)
    4.1 ATTRACTIVE OPPORTUNITIES FOR PLAYERS IN ASSET INTEGRITY MANAGEMENT MARKET 
           FIGURE 14 ROBUST INDUSTRIAL ENVIRONMENT TO CREATE SIGNIFICANT GROWTH OPPORTUNITIES FOR MARKET PLAYERS
    4.2 ASSET INTEGRITY MANAGEMENT MARKET IN NORTH AMERICA BY COUNTRY AND INDUSTRY 
           FIGURE 15 US AND OIL & GAS TO HOLD LARGEST SHARE OF NORTH AMERICAN ASSET INTEGRITY MANAGEMENT MARKET IN 2024
    4.3 ASSET INTEGRITY MANAGEMENT MARKET, BY SERVICE TYPE 
           FIGURE 16 NON-DESTRUCTIVE TESTING INSPECTION TO ACCOUNT FOR LARGEST MARKET SHARE BY 2029
    4.4 ASSET INTEGRITY MANAGEMENT MARKET, BY REGION 
           FIGURE 17 INDIA TO RECORD HIGHEST CAGR IN ASSET INTEGRITY MANAGEMENT MARKET DURING FORECAST PERIOD
 
5 MARKET OVERVIEW (Page No. - 56)
    5.1 INTRODUCTION 
    5.2 MARKET DYNAMICS 
           FIGURE 18 ASSET INTEGRITY MANAGEMENT MARKET: DRIVERS, RESTRAINTS, OPPORTUNITIES, AND CHALLENGES
           5.2.1 DRIVERS
                    FIGURE 19 ASSET INTEGRITY MANAGEMENT MARKET: IMPACT ANALYSIS OF DRIVERS
                    5.2.1.1 Increasing need to maintain aging assets in risk-based industries
                    5.2.1.2 Discovery of new resources through deep water exploration
                    5.2.1.3 Environmental disturbances affecting plant operations
                               FIGURE 20 POTENTIAL RISKS POSED BY CLIMATIC CHANGES TO OIL & GAS INDUSTRY
                    5.2.1.4 Stringent safety regulations and quality control requirements
           5.2.2 RESTRAINTS
                    FIGURE 21 ASSET INTEGRITY MANAGEMENT MARKET: IMPACT ANALYSIS OF RESTRAINTS
                    5.2.2.1 Complexity and high cost of system installation in some sectors
           5.2.3 OPPORTUNITIES
                    FIGURE 22 ASSET INTEGRITY MANAGEMENT MARKET: IMPACT ANALYSIS OF OPPORTUNITIES
                    5.2.3.1 Rising demand for renewable energy
                    5.2.3.2 Expansion of power sector in emerging economies
                    5.2.3.3 Increasing integration of automation in oil & gas industry
                    5.2.3.4 Increasing capacities of oil- and gas-fired power plants
           5.2.4 CHALLENGES
                    FIGURE 23 ASSET INTEGRITY MANAGEMENT MARKET: IMPACT ANALYSIS OF CHALLENGES
                    5.2.4.1 Limited availability of skilled workforce
                    5.2.4.2 Harsh operating environment
    5.3 VALUE CHAIN ANALYSIS 
           FIGURE 24 ASSET INTEGRITY MANAGEMENT MARKET: VALUE CHAIN ANALYSIS
    5.4 MARKET ECOSYSTEM 
           FIGURE 25 ASSET INTEGRITY MANAGEMENT ECOSYSTEM
           TABLE 3 COMPANIES AND THEIR ROLE IN ASSET INTEGRITY MANAGEMENT ECOSYSTEM
    5.5 INVESTMENT AND FUNDING SCENARIO 
           5.5.1 NUMBER OF DEALS IN ASSET INTEGRITY MANAGEMENT MARKET
           5.5.2 FUNDING SCENARIO IN ASSET INTEGRITY MANAGEMENT MARKET
    5.6 TRENDS/DISRUPTIONS IMPACTING CUSTOMER BUSINESS 
           FIGURE 26 ASSET INTEGRITY MANAGEMENT MARKET: TRENDS/DISRUPTIONS IMPACTING CUSTOMER BUSINESS
    5.7 PRICING ANALYSIS 
           5.7.1 AVERAGE SELLING PRICE TREND
                    FIGURE 27 AVERAGE SELLING PRICE OF INSPECTION AND TESTING SERVICES IN ASSET INTEGRITY MANAGEMENT PROVIDED BY TWO KEY PLAYERS (USD/HR)
                    TABLE 4 AVERAGE SELLING PRICE OF INSPECTION AND TESTING SERVICES IN ASSET INTEGRITY MANAGEMENT PROVIDED BY TWO KEY PLAYERS (USD/HR)
                    FIGURE 28 AVERAGE SELLING PRICE TREND, BY REGION (USD)
    5.8 TECHNOLOGY ANALYSIS 
           5.8.1 KEY TECHNOLOGIES
                    5.8.1.1 Data Analytics and Machine Learning
                    5.8.1.2 Remote Monitoring and IoT
                    5.8.1.3 3D Laser Scanning and Phased Array Ultrasonic Testing (PAUT)
           5.8.2 COMPLEMENTARY TECHNOLOGIES
                    5.8.2.1 Cloud Computing
                    5.8.2.2 Blockchain
                    5.8.2.3 Augmented Reality and Virtual Reality
           5.8.3 ADJACENT TECHNOLOGIES
                    5.8.3.1 Environmental Monitoring
                    5.8.3.2 Energy Harvesting
    5.9 PORTER'S FIVE FORCES ANALYSIS 
           TABLE 5 ASSET INTEGRITY MANAGEMENT MARKET: PORTER'S FIVE FORCES ANALYSIS
           FIGURE 29 ASSET INTEGRITY MANAGEMENT MARKET: PORTER'S FIVE FORCES ANALYSIS
           5.9.1 INTENSITY OF COMPETITIVE RIVALRY
           5.9.2 BARGAINING POWER OF SUPPLIERS
           5.9.3 BARGAINING POWER OF BUYERS
           5.9.4 THREAT OF NEW ENTRANTS
           5.9.5 THREAT OF SUBSTITUTES
    5.10 KEY STAKEHOLDERS AND BUYING CRITERIA 
           5.10.1 KEY STAKEHOLDERS IN BUYING PROCESS
                    FIGURE 30 INFLUENCE OF STAKEHOLDERS ON BUYING PROCESS FOR TOP THREE INDUSTRIES
                    TABLE 6 INFLUENCE OF STAKEHOLDERS ON BUYING PROCESS FOR TOP THREE INDUSTRIES
           5.10.2 BUYING CRITERIA
                    FIGURE 31 KEY BUYING CRITERIA FOR TOP THREE INDUSTRIES
                    TABLE 7 KEY BUYING CRITERIA FOR TOP THREE INDUSTRIES
    5.11 CASE STUDY ANALYSIS 
           5.11.1 SGS SA CONDUCTS SUITABILITY FOR SERVICE ANALYSIS OF AFFECTED FACILITY IN ENGLAND
           5.11.2 ASSET INTEGRITY ENGINEERING PROVIDES SOLUTION FOR OFFSHORE OIL & GAS FACILITY
           5.11.3 DNV CONDUCTS CORROSION INSPECTION FOR REMAINING LIFE ASSESSMENT OF TRANSMISSION PIPELINES
           5.11.4 DNV EXECUTES ASSESSMENT TO IDENTIFY MAINTENANCE BACKLOG ISSUES
    5.12 TRADE ANALYSIS 
           5.12.1 IMPORT SCENARIO
                    FIGURE 32 IMPORT DATA FOR HS CODE 9026-COMPLIANT PRODUCTS, BY KEY COUNTRY, 2018–2022 (USD MILLION)
           5.12.2 EXPORT SCENARIO
                    FIGURE 33 EXPORT DATA FOR HS CODE 9026-COMPLIANT PRODUCTS, BY KEY COUNTRY, 2018–2022 (USD MILLION)
    5.13 TARIFF AND REGULATORY LANDSCAPE 
           5.13.1 TARIFF ANALYSIS
                    TABLE 8 MFN TARIFF FOR HS CODE 9026-COMPLIANT PRODUCTS EXPORTED BY MEXICO
                    TABLE 9 MFN TARIFF FOR HS CODE 9026-COMPLIANT PRODUCTS EXPORTED BY BRAZIL
           5.13.2 REGULATORY BODIES, GOVERNMENT AGENCIES, AND OTHER ORGANIZATIONS
                    TABLE 10 NORTH AMERICA: REGULATORY BODIES, GOVERNMENT AGENCIES, AND OTHER ORGANIZATIONS
                    TABLE 11 EUROPE: REGULATORY BODIES, GOVERNMENT AGENCIES, AND OTHER ORGANIZATIONS
                    TABLE 12 ASIA PACIFIC: REGULATORY BODIES, GOVERNMENT AGENCIES, AND OTHER ORGANIZATIONS
                    TABLE 13 ROW: REGULATORY BODIES, GOVERNMENT AGENCIES, AND OTHER ORGANIZATIONS
           5.13.3 STANDARDS/REGULATIONS
                    TABLE 14 NORTH AMERICA: STANDARDS/REGULATIONS
                    TABLE 15 EUROPE: STANDARDS/REGULATIONS
                    TABLE 16 ASIA PACIFIC: STANDARDS/REGULATIONS
                    TABLE 17 ROW: STANDARDS/REGULATIONS
    5.14 PATENT ANALYSIS 
           FIGURE 34 ASSET INTEGRITY MANAGEMENT MARKET: PATENTS APPLIED AND GRANTED, 2014–2023
           TABLE 18 ASSET INTEGRITY MANAGEMENT MARKET: KEY PATENTS, 2020–2023
    5.15 KEY CONFERENCES AND EVENTS, 2024–2025 
           TABLE 19 ASSET INTEGRITY MANAGEMENT MARKET: KEY CONFERENCES AND EVENTS, 2024–2025
 
6 OFFERINGS IN ASSET INTEGRITY MANAGEMENT MARKET (Page No. - 90)
    6.1 INTRODUCTION 
           FIGURE 35 OFFERINGS IN ASSET INTEGRITY MANAGEMENT MARKET
    6.2 HARDWARE 
    6.3 SOFTWARE 
    6.4 SERVICES 
 
7 USE CASES IN ASSET INTEGRITY MANAGEMENT MARKET (Page No. - 93)
    7.1 INTRODUCTION 
    7.2 VESSELS, PIPING, AND PRESSURE PLANTS 
    7.3 FIRE AND SAFETY SYSTEMS 
    7.4 ELECTRICAL SYSTEMS 
    7.5 ROTATING EQUIPMENT 
    7.6 RELIEF AND VENT SYSTEMS 
    7.7 INSTRUMENTATION AND CONTROL SYSTEMS 
 
8 ASSET INTEGRITY MANAGEMENT MARKET METHODOLOGIES (Page No. - 97)
    8.1 INTRODUCTION
    8.2 RELIABILITY-CENTERED MAINTENANCE 
    8.3 ROOT CAUSE ANALYSIS 
    8.4 RELIABILITY ANALYTICS 
    8.5 LIFE CYCLE ASSESSMENT/EXTENSION 
    8.6 FITNESS FOR SERVICE 
    8.7 FAILURE MODES, EFFECTS, AND CRITICALITY ANALYSIS 
    8.8 FINITE ELEMENT ANALYSIS 
    8.9 SAFETY INTEGRITY LEVEL STUDY 
 
9 ASSET INTEGRITY MANAGEMENT MARKET, BY SERVICE TYPE (Page No. - 101)
    9.1 INTRODUCTION 
           FIGURE 36 NON-DESTRUCTIVE TESTING INSPECTION TO LEAD ASSET INTEGRITY MANAGEMENT MARKET DURING FORECAST PERIOD
           TABLE 20 ASSET INTEGRITY MANAGEMENT MARKET, BY SERVICE TYPE, 2020–2023 (USD BILLION)
           TABLE 21 ASSET INTEGRITY MANAGEMENT MARKET, BY SERVICE TYPE, 2024–2029 (USD BILLION)
    9.2 RISK-BASED INSPECTION 
           9.2.1 HIGHER NEED FOR RISK ASSESSMENTS IN OIL & GAS INDUSTRY TO FUEL SEGMENT GROWTH
                    FIGURE 37 INTERNATIONAL STANDARDS AND RECOMMENDED PRACTICES FOR IMPLEMENTATION OF RBI
                    TABLE 22 RISK-BASED INSPECTION: ASSET INTEGRITY MANAGEMENT MARKET, BY INDUSTRY, 2020–2023 (USD BILLION)
                    TABLE 23 RISK-BASED INSPECTION: ASSET INTEGRITY MANAGEMENT MARKET, BY INDUSTRY, 2024–2029 (USD BILLION)
                    TABLE 24 RISK-BASED INSPECTION: ASSET INTEGRITY MANAGEMENT MARKET, BY REGION, 2020–2023 (USD BILLION)
                    TABLE 25 RISK-BASED INSPECTION: ASSET INTEGRITY MANAGEMENT MARKET, BY REGION, 2024–2029 (USD BILLION)
    9.3 NON-DESTRUCTIVE TESTING INSPECTION 
           9.3.1 INCREASING ADOPTION OF ADVANCED TECHNOLOGIES TO BOOST MARKET GROWTH
                    FIGURE 38 METHODS OF NON-DESTRUCTIVE TESTING
                    TABLE 26 NON-DESTRUCTIVE TESTING INSPECTION: ASSET INTEGRITY MANAGEMENT MARKET, BY INDUSTRY, 2020–2023 (USD BILLION)
                    TABLE 27 NON-DESTRUCTIVE TESTING INSPECTION: ASSET INTEGRITY MANAGEMENT MARKET, BY INDUSTRY, 2024–2029 (USD BILLION)
                    TABLE 28 NON-DESTRUCTIVE TESTING INSPECTION: ASSET INTEGRITY MANAGEMENT MARKET, BY REGION, 2020–2023 (USD BILLION)
                    TABLE 29 NON-DESTRUCTIVE TESTING INSPECTION: ASSET INTEGRITY MANAGEMENT MARKET, BY REGION, 2024–2029 (USD BILLION)
    9.4 CORROSION MANAGEMENT 
           9.4.1 NEED TO MAINTAIN AGING INFRASTRUCTURE AND MITIGATE LOSSES TO DRIVE MARKET
                    FIGURE 39 TYPES OF CORROSION
                    FIGURE 40 ELEMENTS OF CORROSION MANAGEMENT
                    TABLE 30 CORROSION MANAGEMENT: ASSET INTEGRITY MANAGEMENT MARKET, BY INDUSTRY, 2020–2023 (USD BILLION)
                    TABLE 31 CORROSION MANAGEMENT: ASSET INTEGRITY MANAGEMENT MARKET, BY INDUSTRY, 2024–2029 (USD BILLION)
                    TABLE 32 CORROSION MANAGEMENT: ASSET INTEGRITY MANAGEMENT MARKET, BY REGION, 2020–2023 (USD BILLION)
                    TABLE 33 CORROSION MANAGEMENT: ASSET INTEGRITY MANAGEMENT MARKET, BY REGION, 2024–2029 (USD BILLION)
    9.5 PIPELINE INTEGRITY MANAGEMENT 
           9.5.1 RISING IMPORTANCE OF EFFECTIVE MANAGEMENT FOR FAILURE PREVENTION TO BOOST SEGMENT
                    TABLE 34 PIPELINE INTEGRITY MANAGEMENT: ASSET INTEGRITY MANAGEMENT MARKET, BY INDUSTRY, 2020–2023 (USD BILLION)
                    TABLE 35 PIPELINE INTEGRITY MANAGEMENT: ASSET INTEGRITY MANAGEMENT MARKET, BY INDUSTRY, 2024–2029 (USD BILLION)
                    TABLE 36 PIPELINE INTEGRITY MANAGEMENT: ASSET INTEGRITY MANAGEMENT MARKET, BY REGION, 2020–2023 (USD BILLION)
                    TABLE 37 PIPELINE INTEGRITY MANAGEMENT: ASSET INTEGRITY MANAGEMENT MARKET, BY REGION, 2024–2029 (USD BILLION)
    9.6 HAZARD IDENTIFICATION STUDY 
           9.6.1 AWARENESS ABOUT CRITICALITY OF PROACTIVE HAZARD IDENTIFICATION AND RISK MANAGEMENT TO FUEL DEMAND
                    TABLE 38 HAZARD IDENTIFICATION STUDY: ASSET INTEGRITY MANAGEMENT MARKET, BY INDUSTRY, 2020–2023 (USD MILLION)
                    TABLE 39 HAZARD IDENTIFICATION STUDY: ASSET INTEGRITY MANAGEMENT MARKET, BY INDUSTRY, 2024–2029 (USD MILLION)
                    TABLE 40 HAZARD IDENTIFICATION STUDY: ASSET INTEGRITY MANAGEMENT MARKET, BY REGION, 2020–2023 (USD BILLION)
                    TABLE 41 HAZARD IDENTIFICATION STUDY: ASSET INTEGRITY MANAGEMENT MARKET, BY REGION, 2024–2029 (USD BILLION)
    9.7 STRUCTURAL INTEGRITY MANAGEMENT 
           9.7.1 SEGMENT GROWTH DRIVEN BY COMPLIANCE REQUIREMENTS
                    TABLE 42 STRUCTURAL INTEGRITY MANAGEMENT: ASSET INTEGRITY MANAGEMENT MARKET, BY INDUSTRY, 2020–2023 (USD MILLION)
                    TABLE 43 STRUCTURAL INTEGRITY MANAGEMENT: ASSET INTEGRITY MANAGEMENT MARKET, BY INDUSTRY, 2024–2029 (USD MILLION)
                    TABLE 44 STRUCTURAL INTEGRITY MANAGEMENT: ASSET INTEGRITY MANAGEMENT MARKET, BY REGION, 2020–2023 (USD MILLION)
                    TABLE 45 STRUCTURAL INTEGRITY MANAGEMENT: ASSET INTEGRITY MANAGEMENT MARKET, BY REGION, 2024–2029 (USD MILLION)
    9.8 RELIABILITY, AVAILABILITY, AND MAINTAINABILITY (RAM) STUDY 
           9.8.1 TECHNOLOGICAL ADVANCEMENTS BOOST SEGMENT GROWTH
                    FIGURE 41 PROCESS OF STRUCTURAL INTEGRITY MANAGEMENT
                    TABLE 46 RELIABILITY, AVAILABILITY, AND MAINTAINABILITY STUDY: ASSET INTEGRITY MANAGEMENT MARKET, BY INDUSTRY, 2020–2023 (USD MILLION)
                    TABLE 47 RELIABILITY, AVAILABILITY, AND MAINTAINABILITY STUDY: ASSET INTEGRITY MANAGEMENT MARKET, BY INDUSTRY, 2024–2029 (USD MILLION)
                    TABLE 48 RELIABILITY, AVAILABILITY, AND MAINTAINABILITY STUDY: ASSET INTEGRITY MANAGEMENT MARKET, BY REGION, 2020–2023 (USD MILLION)
                    TABLE 49 RELIABILITY, AVAILABILITY, AND MAINTAINABILITY STUDY: ASSET INTEGRITY MANAGEMENT MARKET, BY REGION, 2024–2029 (USD MILLION)
    9.9 OTHER SERVICE TYPES 
           TABLE 50 OTHER SERVICE TYPES: ASSET INTEGRITY MANAGEMENT MARKET, BY INDUSTRY, 2020–2023 (USD MILLION)
           TABLE 51 OTHER SERVICE TYPES: ASSET INTEGRITY MANAGEMENT MARKET, BY INDUSTRY, 2024–2029 (USD MILLION)
           TABLE 52 OTHER SERVICE TYPES: ASSET INTEGRITY MANAGEMENT MARKET, BY REGION, 2020–2023 (USD MILLION)
           TABLE 53 OTHER SERVICE TYPES: ASSET INTEGRITY MANAGEMENT MARKET, BY REGION, 2024–2029 (USD MILLION)
 
10 ASSET INTEGRITY MANAGEMENT MARKET, BY INDUSTRY (Page No. - 123)
     10.1 INTRODUCTION 
             FIGURE 42 POWER INDUSTRY TO REGISTER HIGHEST CAGR IN ASSET INTEGRITY MANAGEMENT MARKET DURING FORECAST PERIOD
             TABLE 54 ASSET INTEGRITY MANAGEMENT MARKET, BY INDUSTRY, 2020–2023 (USD BILLION)
             TABLE 55 ASSET INTEGRITY MANAGEMENT MARKET, BY INDUSTRY, 2024–2029 (USD BILLION)
     10.2 OIL & GAS 
             FIGURE 43 TYPES OF ASSETS IN OIL & GAS PLANTS
             TABLE 56 OIL & GAS: ASSET INTEGRITY MANAGEMENT MARKET, BY SERVICE TYPE, 2020–2023 (USD MILLION)
             TABLE 57 OIL & GAS: ASSET INTEGRITY MANAGEMENT MARKET, BY SERVICE TYPE, 2024–2029 (USD MILLION)
             TABLE 58 OIL & GAS: ASSET INTEGRITY MANAGEMENT MARKET, BY REGION, 2020–2023 (USD BILLION)
             TABLE 59 OIL & GAS: ASSET INTEGRITY MANAGEMENT MARKET, BY REGION, 2024–2029 (USD BILLION)
             10.2.1 OIL & GAS INDUSTRY, BY PLANT LOCATION
                       FIGURE 44 ASSET INTEGRITY MANAGEMENT MARKET, BY PLANT LOCATION
                        TABLE 60 OIL & GAS: ASSET INTEGRITY MANAGEMENT MARKET, BY PLANT LOCATION, 2020–2023 (USD BILLION)
                        TABLE 61 OIL & GAS: ASSET INTEGRITY MANAGEMENT MARKET, BY PLANT LOCATION, 2024–2029 (USD BILLION)
                        10.2.1.1 Onshore
                                     10.2.1.1.1 Segment driven by large share of oil extraction across the globe
                        10.2.1.2 Offshore
                                     10.2.1.2.1 Need to maintain operational continuity and asset protection to propel segment growth
                        10.2.1.3 Subsea
                                     10.2.1.3.1 Rising adoption of digital twin technologies to boost market growth
             10.2.2 OIL & GAS INDUSTRY, BY OPERATING SECTOR
                        10.2.2.1 Upstream
                        10.2.2.2 Midstream
                        10.2.2.3 Downstream
     10.3 POWER 
             10.3.1 INCREASING NEED TO MITIGATE RISKS ASSOCIATED WITH EQUIPMENT FAILURES IN POWER PLANTS TO FUEL MARKET GROWTH
                        TABLE 62 POWER: ASSET INTEGRITY MANAGEMENT MARKET, BY SERVICE TYPE, 2020–2023 (USD MILLION)
                        TABLE 63 POWER: ASSET INTEGRITY MANAGEMENT MARKET, BY SERVICE TYPE, 2024–2029 (USD MILLION)
                        TABLE 64 POWER: ASSET INTEGRITY MANAGEMENT MARKET, BY REGION, 2020–2023 (USD BILLION)
                        TABLE 65 POWER: ASSET INTEGRITY MANAGEMENT MARKET, BY REGION, 2024–2029 (USD BILLION)
             10.3.2 RENEWABLE ENERGY POWER PLANTS
                        10.3.2.1 Geothermal Energy
                        10.3.2.2 Wind Energy
                        10.3.2.3 Hydropower Energy
                        10.3.2.4 Solar Energy
                        10.3.2.5 Biomass Energy
                        10.3.2.6 Tidal Energy
             10.3.3 CONVENTIONAL ENERGY POWER PLANTS
                        10.3.3.1 Nuclear
                        10.3.3.2 Coal
                        10.3.3.3 Fuel Oil
                        10.3.3.4 Natural Gas
                        10.3.3.5 Waste-fired Thermal Power Plants
     10.4 MINING 
             10.4.1 RISING ADOPTION OF PREVENTIVE MAINTENANCE IN MINING TO FUEL REVENUE GROWTH
                        TABLE 66 MINING: ASSET INTEGRITY MANAGEMENT MARKET, BY SERVICE TYPE, 2020–2023 (USD MILLION)
                        TABLE 67 MINING: ASSET INTEGRITY MANAGEMENT MARKET, BY SERVICE TYPE, 2024–2029 (USD MILLION)
                        TABLE 68 MINING: ASSET INTEGRITY MANAGEMENT MARKET, BY REGION, 2020–2023 (USD BILLION)
                        TABLE 69 MINING: ASSET INTEGRITY MANAGEMENT MARKET, BY REGION, 2024–2029 (USD BILLION)
     10.5 AEROSPACE 
             10.5.1 INCREASING COMPLIANCE AND SAFETY REQUIREMENTS TO COMPLEMENT SEGMENT GROWTH
                        TABLE 70 AEROSPACE: ASSET INTEGRITY MANAGEMENT MARKET, BY SERVICE TYPE, 2020–2023 (USD MILLION)
                        TABLE 71 AEROSPACE: ASSET INTEGRITY MANAGEMENT MARKET, BY SERVICE TYPE, 2024–2029 (USD MILLION)
                        TABLE 72 AEROSPACE: ASSET INTEGRITY MANAGEMENT MARKET, BY REGION, 2020–2023 (USD BILLION)
                        TABLE 73 AEROSPACE: ASSET INTEGRITY MANAGEMENT MARKET, BY REGION, 2024–2029 (USD BILLION)
     10.6 OTHERS 
             TABLE 74 OTHER INDUSTRIES: ASSET INTEGRITY MANAGEMENT MARKET, BY SERVICE TYPE, 2020–2023 (USD MILLION)
             TABLE 75 OTHER INDUSTRIES: ASSET INTEGRITY MANAGEMENT MARKET, BY SERVICE TYPE, 2024–2029 (USD MILLION)
             TABLE 76 OTHER INDUSTRIES: ASSET INTEGRITY MANAGEMENT MARKET, BY REGION, 2020–2023 (USD MILLION)
             TABLE 77 OTHER INDUSTRIES: ASSET INTEGRITY MANAGEMENT MARKET, BY REGION, 2024–2029 (USD MILLION)
 
11 ASSET INTEGRITY MANAGEMENT MARKET, BY REGION (Page No. - 141)
     11.1 INTRODUCTION 
             FIGURE 45 ASIA PACIFIC TO REGISTER HIGHEST CAGR IN ASSET INTEGRITY MANAGEMENT MARKET DURING FORECAST PERIOD
             TABLE 78 ASSET INTEGRITY MANAGEMENT MARKET, 2020–2023 (USD BILLION)
             TABLE 79 ASSET INTEGRITY MANAGEMENT MARKET, 2024–2029 (USD BILLION)
             TABLE 80 ASSET INTEGRITY MANAGEMENT MARKET, BY REGION, 2020–2023 (USD BILLION)
             TABLE 81 ASSET INTEGRITY MANAGEMENT MARKET, BY REGION, 2024–2029 (USD BILLION)
     11.2 NORTH AMERICA 
             FIGURE 46 NORTH AMERICA: ASSET INTEGRITY MANAGEMENT MARKET SNAPSHOT
             TABLE 82 NORTH AMERICA: ASSET INTEGRITY MANAGEMENT MARKET, BY COUNTRY, 2020–2023 (USD BILLION)
             TABLE 83 NORTH AMERICA: ASSET INTEGRITY MANAGEMENT MARKET, BY COUNTRY, 2024–2029 (USD BILLION)
             TABLE 84 NORTH AMERICA: ASSET INTEGRITY MANAGEMENT MARKET, BY SERVICE TYPE, 2020–2023 (USD MILLION)
             TABLE 85 NORTH AMERICA: ASSET INTEGRITY MANAGEMENT MARKET, BY SERVICE TYPE, 2024–2029 (USD MILLION)
             TABLE 86 NORTH AMERICA: ASSET INTEGRITY MANAGEMENT MARKET, BY INDUSTRY, 2020–2023 (USD BILLION)
             TABLE 87 NORTH AMERICA: ASSET INTEGRITY MANAGEMENT MARKET, BY INDUSTRY, 2024–2029 (USD BILLION)
             11.2.1 US
                        11.2.1.1 Stringent industry regulations to boost market growth
             11.2.2 CANADA
                        11.2.2.1 Surging demand for AIM services from oil & gas industry to drive market in Canada
             11.2.3 MEXICO
                        11.2.3.1 Potential investments in oil & gas sector to foster market growth
             11.2.4 NORTH AMERICA: RECESSION IMPACT
     11.3 EUROPE 
             FIGURE 47 EUROPE: ASSET INTEGRITY MANAGEMENT MARKET SNAPSHOT
             TABLE 88 EUROPE: ASSET INTEGRITY MANAGEMENT MARKET, BY COUNTRY, 2020–2023 (USD BILLION)
             TABLE 89 EUROPE: ASSET INTEGRITY MANAGEMENT MARKET, BY COUNTRY, 2024–2029 (USD BILLION)
             TABLE 90 EUROPE: ASSET INTEGRITY MANAGEMENT MARKET, BY SERVICE TYPE, 2020–2023 (USD MILLION)
             TABLE 91 EUROPE: ASSET INTEGRITY MANAGEMENT MARKET, BY SERVICE TYPE, 2024–2029 (USD MILLION)
             TABLE 92 EUROPE: ASSET INTEGRITY MANAGEMENT MARKET, BY INDUSTRY, 2020–2023 (USD BILLION)
             TABLE 93 EUROPE: ASSET INTEGRITY MANAGEMENT MARKET, BY INDUSTRY, 2024–2029 (USD BILLION)
             11.3.1 UK
                        11.3.1.1 Increasing focus on development of renewable energy sources to drive market growth
             11.3.2 GERMANY
                        11.3.2.1 Rising need to manage existing infrastructure and plant assets to fuel growth
             11.3.3 FRANCE
                        11.3.3.1 Robust infrastructural growth in renewable energy to fuel growth
             11.3.4 NORWAY
                        11.3.4.1 Need for asset integrity from established oil & gas industry and growing process industries to fuel market expansion
             11.3.5 REST OF EUROPE
             11.3.6 EUROPE: RECESSION IMPACT
     11.4 ASIA PACIFIC 
             FIGURE 48 ASIA PACIFIC: ASSET INTEGRITY MANAGEMENT MARKET SNAPSHOT
             TABLE 94 ASIA PACIFIC: ASSET INTEGRITY MANAGEMENT MARKET, BY COUNTRY, 2020–2023 (USD BILLION)
             TABLE 95 ASIA PACIFIC: ASSET INTEGRITY MANAGEMENT MARKET, BY COUNTRY, 2024–2029 (USD BILLION)
             TABLE 96 ASIA PACIFIC: ASSET INTEGRITY MANAGEMENT MARKET, BY SERVICE TYPE, 2020–2023 (USD MILLION)
             TABLE 97 ASIA PACIFIC: ASSET INTEGRITY MANAGEMENT MARKET, BY SERVICE TYPE, 2024–2029 (USD MILLION)
             TABLE 98 ASIA PACIFIC: ASSET INTEGRITY MANAGEMENT MARKET, BY INDUSTRY, 2020–2023 (USD BILLION)
             TABLE 99 ASIA PACIFIC: ASSET INTEGRITY MANAGEMENT MARKET, BY INDUSTRY, 2024–2029 (USD BILLION)
             11.4.1 CHINA
                        11.4.1.1 Large mining industry and growing power generation projects to boost market
             11.4.2 JAPAN
                        11.4.2.1 Essentiality of oil & gas to mitigate energy demand complements market growth
             11.4.3 INDIA
                        11.4.3.1 Higher energy demand and introduction of new oil extraction projects boost market growth
             11.4.4 REST OF ASIA PACIFIC
             11.4.5 ASIA PACIFIC: RECESSION IMPACT
     11.5 ROW 
             TABLE 100 ROW: ASSET INTEGRITY MANAGEMENT MARKET, BY REGION, 2020–2023 (USD BILLION)
             TABLE 101 ROW: ASSET INTEGRITY MANAGEMENT MARKET, BY REGION, 2024–2029 (USD BILLION)
             TABLE 102 ROW: ASSET INTEGRITY MANAGEMENT MARKET, BY SERVICE TYPE, 2020–2023 (USD MILLION)
             TABLE 103 ROW: ASSET INTEGRITY MANAGEMENT MARKET, BY SERVICE TYPE, 2024–2029 (USD MILLION)
             TABLE 104 ROW: ASSET INTEGRITY MANAGEMENT MARKET, BY INDUSTRY, 2020–2023 (USD MILLION)
             TABLE 105 ROW: ASSET INTEGRITY MANAGEMENT MARKET, BY INDUSTRY, 2024–2029 (USD MILLION)
             11.5.1 MIDDLE EAST
                        TABLE 106 MIDDLE EAST: ASSET INTEGRITY MANAGEMENT MARKET, BY REGION, 2020–2023 (USD MILLION)
                        TABLE 107 MIDDLE EAST: ASSET INTEGRITY MANAGEMENT MARKET, BY REGION, 2024–2029 (USD MILLION)
                        11.5.1.1 GCC Countries
                                     TABLE 108 GCC: ASSET INTEGRITY MANAGEMENT MARKET, BY COUNTRY, 2020–2023 (USD MILLION)
                                     TABLE 109 GCC: ASSET INTEGRITY MANAGEMENT MARKET, BY COUNTRY, 2024–2029 (USD MILLION)
                                     11.5.1.1.1 Bahrain
                                                    11.5.1.1.1.1 Significant investments in oil & gas sector to propel market growth
                                     11.5.1.1.2 Kuwait
                                                    11.5.1.1.2.1 Rising focus on increasing oil extraction capacity to foster market growth in Kuwait
                                     11.5.1.1.3 Oman
                                                    11.5.1.1.3.1 Focus on bringing diversification in energy sector to proliferate market growth
                                     11.5.1.1.4 Qatar
                                                    11.5.1.1.4.1 Infrastructural expansion in oil & gas sector to boost market growth
                                     11.5.1.1.5 Saudi Arabia
                                                    11.5.1.1.5.1 Large oil reserves provide potential opportunities for market growth
                                     11.5.1.1.6 UAE
                                                    11.5.1.1.6.1 Stringent standards in oil & gas industry to complement revenue growth
                        11.5.1.2 Rest of Middle East
             11.5.2 AFRICA
                        11.5.2.1 Significant growth in mining industry to fuel adoption
             11.5.3 SOUTH AMERICA
                        11.5.3.1 Need for efficient operation of oil & gas infrastructure to drive market growth
             11.5.4 ROW: RECESSION IMPACT
 
12 COMPETITIVE LANDSCAPE (Page No. - 169)
     12.1 OVERVIEW 
     12.2 OVERVIEW OF STRATEGIES ADOPTED BY KEY PLAYERS, 2020–2024 
             TABLE 110 ASSET INTEGRITY MANAGEMENT MARKET: STRATEGIES ADOPTED BY KEY PLAYERS, 2020–2024
     12.3 MARKET SHARE ANALYSIS, 2023 
             FIGURE 49 ASSET INTEGRITY MANAGEMENT MARKET SHARE ANALYSIS, 2023
             TABLE 111 ASSET INTEGRITY MANAGEMENT MARKET: DEGREE OF COMPETITION, 2023
     12.4 COMPANY REVENUE ANALYSIS, 2018–2022 
             FIGURE 50 REVENUE ANALYSIS OF TOP FIVE PLAYERS, 2018–2022
     12.5 COMPANY VALUATION AND FINANCIAL METRICS 
             FIGURE 51 COMPANY VALUATION, 2022 (USD MILLION)
             FIGURE 52 FINANCIAL METRICS (EV/EBITDA), 2022
     12.6 PRODUCT/BRAND COMPARISON 
             FIGURE 53 PRODUCT/BRAND COMPARISON
     12.7 COMPANY EVALUATION MATRIX: KEY PLAYERS, 2023 
             12.7.1 STARS
             12.7.2 EMERGING LEADERS
             12.7.3 PERVASIVE PLAYERS
             12.7.4 PARTICIPANTS
                        FIGURE 54 ASSET INTEGRITY MANAGEMENT MARKET: COMPANY EVALUATION MATRIX (KEY PLAYERS), 2023
             12.7.5 COMPANY FOOTPRINT: KEY PLAYERS, 2023
                        12.7.5.1 Company footprint
                                     FIGURE 55 ASSET INTEGRITY MANAGEMENT MARKET: COMPANY FOOTPRINT
                        12.7.5.2 Region footprint
                                     TABLE 112 ASSET INTEGRITY MANAGEMENT MARKET: REGION FOOTPRINT
                        12.7.5.3 Service type footprint
                                     TABLE 113 ASSET INTEGRITY MANAGEMENT MARKET: SERVICE TYPE FOOTPRINT
                        12.7.5.4 Industry footprint
                                     TABLE 114 ASSET INTEGRITY MANAGEMENT MARKET: INDUSTRY FOOTPRINT
     12.8 COMPANY EVALUATION MATRIX: STARTUPS/SMES, 2023 
             12.8.1 PROGRESSIVE COMPANIES
             12.8.2 RESPONSIVE COMPANIES
             12.8.3 DYNAMIC COMPANIES
             12.8.4 STARTING BLOCKS
                        FIGURE 56 ASSET INTEGRITY MANAGEMENT MARKET: COMPANY EVALUATION MATRIX (STARTUPS/SMES), 2023
             12.8.5 COMPETITIVE BENCHMARKING, STARTUPS/SMES, 2023
                        12.8.5.1 Key startups/SMEs
                                     TABLE 115 ASSET INTEGRITY MANAGEMENT MARKET: KEY STARTUPS/SMES
                        12.8.5.2 Competitive benchmarking of startups/SMEs
                                     TABLE 116 ASSET INTEGRITY MANAGEMENT MARKET: COMPETITIVE BENCHMARKING OF STARTUPS/SMES
     12.9 COMPETITIVE SCENARIOS AND TRENDS 
             12.9.1 PRODUCT LAUNCHES
                        TABLE 117 ASSET INTEGRITY MANAGEMENT MARKET: PRODUCT LAUNCHES, MARCH 2020–FEBRUARY 2024
             12.9.2 DEALS
                        TABLE 118 ASSET INTEGRITY MANAGEMENT MARKET: DEALS, MARCH 2020–FEBRUARY 2024
             12.9.3 EXPANSIONS
                        TABLE 119 ASSET INTEGRITY MANAGEMENT MARKET: EXPANSIONS, MARCH 2020–FEBRUARY 2024
             12.9.4 OTHERS
                        TABLE 120 ASSET INTEGRITY MANAGEMENT MARKET: OTHERS, MARCH 2020–FEBRUARY 2024
 
13 COMPANY PROFILES (Page No. - 194)
(Business Overview, Products/Solutions/Services Offered, Recent Developments, MnM view (Key strengths/Right to win, Strategic choices made, Weakness/competitive threats)*  
     13.1 KEY PLAYERS 
             13.1.1 SGS SOCIÉTÉ GÉNÉRALE DE SURVEILLANCE SA
                        TABLE 121 SGS SOCIÉTÉ GÉNÉRALE DE SURVEILLANCE SA: COMPANY OVERVIEW
                        FIGURE 57 SGS SOCIÉTÉ GÉNÉRALE DE SURVEILLANCE SA: COMPANY SNAPSHOT
                        TABLE 122 SGS SOCIÉTÉ GÉNÉRALE DE SURVEILLANCE SA: PRODUCTS/SOLUTIONS/SERVICES OFFERED
                        TABLE 123 SGS SOCIÉTÉ GÉNÉRALE DE SURVEILLANCE SA: DEALS
             13.1.2 BUREAU VERITAS
                        TABLE 124 BUREAU VERITAS: COMPANY OVERVIEW
                        FIGURE 58 BUREAU VERITAS: COMPANY SNAPSHOT
                        TABLE 125 BUREAU VERITAS: PRODUCTS/SOLUTIONS/SERVICES OFFERED
                        TABLE 126 BUREAU VERITAS: EXPANSIONS
                        TABLE 127 BUREAU VERITAS: OTHERS
             13.1.3 TECHNIPFMC PLC
                        TABLE 128 TECHNIPFMC PLC: COMPANY OVERVIEW
                        FIGURE 59 TECHNIPFMC PLC: COMPANY SNAPSHOT
                        TABLE 129 TECHNIPFMC PLC: PRODUCTS/SOLUTIONS/SERVICES OFFERED
                        TABLE 130 TECHNIPFMC PLC: PRODUCT LAUNCHES
             13.1.4 JOHN WOOD GROUP PLC
                        TABLE 131 JOHN WOOD GROUP PLC: COMPANY OVERVIEW
                        FIGURE 60 JOHN WOOD GROUP PLC: COMPANY SNAPSHOT
                        TABLE 132 JOHN WOOD GROUP PLC: PRODUCTS/SOLUTIONS/SERVICES OFFERED
                        TABLE 133 JOHN WOOD GROUP PLC: DEALS
                        TABLE 134 JOHN WOOD GROUP PLC: OTHERS
             13.1.5 FLUOR CORPORATION
                        TABLE 135 FLUOR CORPORATION: COMPANY OVERVIEW
                        FIGURE 61 FLUOR CORPORATION: COMPANY SNAPSHOT
                        TABLE 136 FLUOR CORPORATION: PRODUCTS/SOLUTIONS/SERVICES OFFERED
                        TABLE 137 FLUOR CORPORATION: EXPANSIONS
                        TABLE 138 FLUOR CORPORATION: OTHERS
             13.1.6 BAKER HUGHES COMPANY
                        TABLE 139 BAKER HUGHES COMPANY: COMPANY OVERVIEW
                        FIGURE 62 BAKER HUGHES COMPANY: COMPANY SNAPSHOT
                        TABLE 140 BAKER HUGHES COMPANY: PRODUCTS/SOLUTIONS/SERVICES OFFERED
                        TABLE 141 BAKER HUGHES COMPANY: DEALS
             13.1.7 INTERTEK GROUP PLC
                        TABLE 142 INTERTEK GROUP PLC: COMPANY OVERVIEW
                        FIGURE 63 INTERTEK GROUP PLC: COMPANY SNAPSHOT
                        TABLE 143 INTERTEK GROUP PLC: PRODUCTS/SOLUTIONS/SERVICES OFFERED
                        TABLE 144 INTERTEK GROUP PLC: PRODUCT LAUNCHES
                        TABLE 145 INTERTEK GROUP PLC: DEALS
                        TABLE 146 INTERTEK GROUP PLC: EXPANSIONS
                        TABLE 147 INTERTEK GROUP PLC: OTHERS
             13.1.8 AKER SOLUTIONS
                        TABLE 148 AKER SOLUTIONS: COMPANY OVERVIEW
                        FIGURE 64 AKER SOLUTIONS: COMPANY SNAPSHOT
                        TABLE 149 AKER SOLUTIONS: PRODUCTS/SOLUTIONS/SERVICES OFFERED
                        TABLE 150 AKER SOLUTIONS: OTHERS
             13.1.9 APPLUS+
                        TABLE 151 APPLUS+: COMPANY OVERVIEW
                        FIGURE 65 APPLUS+: COMPANY SNAPSHOT
                        TABLE 152 APPLUS+: PRODUCTS/SOLUTIONS/SERVICES OFFERED
                        TABLE 153 APPLUS+: DEALS
                        TABLE 154 APPLUS+: EXPANSIONS
                        TABLE 155 APPLUS+: OTHERS
             13.1.10 DNV AS
                        TABLE 156 DNV AS: COMPANY OVERVIEW
                        FIGURE 66 DNV AS: COMPANY SNAPSHOT
                        TABLE 157 DNV AS: PRODUCTS/SOLUTIONS/SERVICES OFFERED
                        TABLE 158 DNV AS: DEALS
                        TABLE 159 DNV AS: EXPANSIONS
             13.1.11 OCEANEERING INTERNATIONAL, INC.
                        TABLE 160 OCEANEERING INTERNATIONAL, INC.: COMPANY OVERVIEW
                        FIGURE 67 OCEANEERING INTERNATIONAL, INC.: COMPANY SNAPSHOT
                        TABLE 161 OCEANEERING INTERNATIONAL, INC.: PRODUCTS/SOLUTIONS/SERVICES OFFERED
                        TABLE 162 OCEANEERING INTERNATIONAL, INC.: DEALS
                        TABLE 163 OCEANEERING INTERNATIONAL, INC.: OTHERS
     13.2 OTHER PLAYERS 
             13.2.1 TÜV SÜD
             13.2.2 ROSEN SWISS AG
             13.2.3 LIFETECH ENGINEERING LTD
             13.2.4 EM&I
             13.2.5 METEGRITY INC.
             13.2.6 FORCE TECHNOLOGY
             13.2.7 TWI LTD.
             13.2.8 OES
             13.2.9 BELL ENERGY
             13.2.10 ABS GROUP OF COMPANIES, INC.
             13.2.11 VELOSI ASSET INTEGRITY LTD
             13.2.12 AXESS GROUP
             13.2.13 ELEMENT MATERIALS TECHNOLOGY
             13.2.14 RINA
             13.2.15 ASSET INTEGRITY ENGINEERING
*Details on Business Overview, Products/Solutions/Services Offered, Recent Developments, MnM view (Key strengths/Right to win, Strategic choices made, Weakness/competitive threats)* might not be captured in case of unlisted companies.  
 
14 APPENDIX (Page No. - 253)
     14.1 INSIGHTS FROM INDUSTRY EXPERTS 
     14.2 DISCUSSION GUIDE 
     14.3 KNOWLEDGESTORE: MARKETSANDMARKETS’ SUBSCRIPTION PORTAL 
     14.4 CUSTOMIZATION OPTIONS 
     14.5 RELATED REPORTS 
     14.6 AUTHOR DETAILS 


The study involved four major activities in estimating the current size of the asset integrity management market. Exhaustive secondary research collected information on the market, peer, and parent markets. The next step was to validate these findings, assumptions, and sizing with industry experts across the value chain through primary research. Both top-down and bottom-up approaches were employed to estimate the complete market size. After that, market breakdown and data triangulation were used to estimate the market size of segments and subsegments.

Secondary Research

Various secondary sources have been referred to in the secondary research process to identify and collect information important for this study. The secondary sources include annual reports, press releases, and investor presentations of companies; white papers; journals and certified publications; and articles from recognized authors, websites, directories, and databases. Secondary research has been conducted to obtain critical information about the industry’s supply chain, the market’s value chain, the total pool of key players, market segmentation according to the industry trends (to the bottom-most level), regional markets, and key developments from market- and technology-oriented perspectives. The secondary data has been collected and analyzed to determine the overall market size, further validated by primary research.

List of major secondary sources

Source

Web Link

American Society of Mechanical Engineers (ASME)

https://www.asme.org/

Occupational Safety and Health Administration (OSHA)

https://www.osha.gov/

International Energy Agency (IEA)

https://www.iea.org/

Primary Research

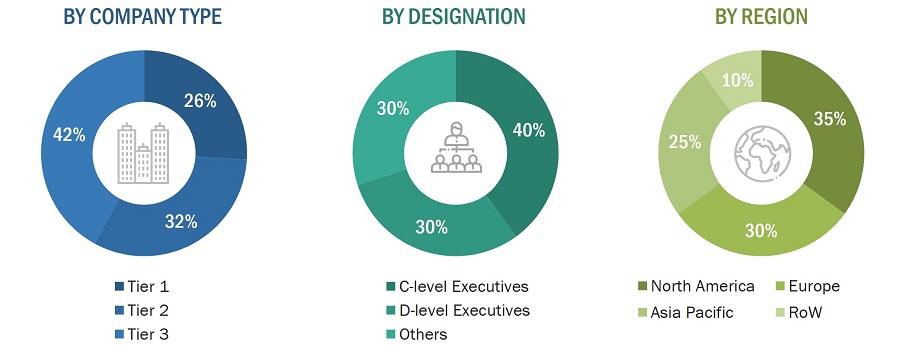
Extensive primary research was conducted after gaining knowledge about the current scenario of the asset integrity management market through secondary research. Several primary interviews were conducted with experts from both the demand and supply sides across four major regions—North America, Europe, Asia Pacific, and RoW. This primary data was collected through questionnaires, emails, and telephonic interviews.
Asset Integrity Management Market
 Size, and Share

To know about the assumptions considered for the study, download the pdf brochure

Market Size Estimation

In the complete market engineering process, top-down and bottom-up approaches and several data triangulation methods have been used to perform market estimation and forecasting for the overall market segments and subsegments listed in this report. Key players in the market have been identified through secondary research, and their market shares in the respective regions have been determined through primary and secondary research. This entire procedure includes the study of annual and financial reports of the top market players and extensive interviews for key insights (quantitative and qualitative) with industry experts (CEOs, VPs, directors, and marketing executives).

All percentage shares, splits, and breakdowns have been determined using secondary sources and verified through primary sources. All the parameters affecting the markets covered in this research study have been accounted for, viewed in detail, verified through primary research, and analyzed to obtain the final quantitative and qualitative data. This data has been consolidated and supplemented with detailed inputs and analysis from MarketsandMarkets and presented in this report. The following figure represents this study’s overall market size estimation process.

Bottom-Up Approach

The bottom-up approach was used to determine the overall size of the asset integrity management market from the revenues of the key players and their shares in the market. The overall market size was calculated based on the revenues of the key players identified in the market.

  • Identifying entities in the asset integrity value chain influencing the entire asset integrity management industry
  • Analyzing each entity, along with related major companies
  • Identifying technology providers for the implementation of products
  • Estimating the market for asset integrity management end users
  • Tracking ongoing and upcoming implementation of asset integrity management service developments by various companies and forecasting the market based on these developments and other critical parameters
  • Arriving at the market size by analyzing asset integrity management companies based on their countries and then combining it to get the market estimate by region
  • Verifying estimates and crosschecking them through a discussion with key opinion leaders, including chief experience officers (CXOs), directors, and operation managers

Asset Integrity Management Market
 Size, and Bottom-Up Approach

Top-Down Approach

In the top-down approach, the overall market size has been used to estimate the size of individual markets (mentioned in the market segmentation) through percentage splits from secondary and primary research.

The most appropriate immediate parent market size has been used to implement the top-down approach to calculate the market size of specific segments. The top-down approach has been implemented for the data extracted from the secondary research to validate the market size obtained.

Each company’s market share has been estimated to verify the revenue shares used earlier in the top-down approach. This study has determined and confirmed the overall parent market and individual market sizes by the data triangulation method and data validation through primaries. The data triangulation method in this study is explained in the next section.

  • Focusing initially on topline investments by market players in the asset integrity management ecosystem
  • Calculating the market size based on the revenue generated by market players through the sales of asset integrity management
  • Mapping the use of asset integrity management in different applications
  • Building and developing the information related to the revenue generated by market players through key products
  • Estimating the geographic split using secondary sources considering factors such as the number of players in a specific country and region, the role of major players in developing innovative products, and adoption and penetration rates for various methods and end-user industries in a particular country

Asset Integrity Management Market
 Size, and Top-Down Approach

Data Triangulation

After arriving at the overall market size from the estimation process explained above, the overall market has been split into several segments and subsegments. The data triangulation procedure has been employed wherever applicable to complete the overall market engineering process and arrive at the exact statistics for all segments and subsegments. The data has been triangulated by studying various factors and trends from both the demand and supply sides. Additionally, the market size has been validated using top-down and bottom-up approaches.

Market Definition

Asset Integrity Management (AIM) refers to a systematic approach that ensures the reliability, safety, and performance of critical assets throughout their operational lifecycle. It involves comprehensive strategies and practices aimed at assessing, monitoring, and maintaining the integrity of assets such as infrastructure, equipment, and facilities. By implementing risk-based inspection, non-destructive testing, corrosion management, and other techniques, AIM aims to mitigate operational risks, enhance asset lifespan, comply with regulatory requirements, and optimize asset performance and reliability, ultimately contributing to the overall operational efficiency and sustainability of industries such as oil and gas, power generation, and manufacturing.

Key Stakeholders

  • Oil and Gas Refinery Companies
  • Asset Integrity Management Service Providers
  • Asset Integrity Software Developers
  • Asset Integrity Management Consultants
  • Research Organizations and Consulting Companies
  • Technology Investors
  • Technology Standard Organizations, Forums, Alliances, and Associations

Report Objectives

  • To describe and forecast the asset integrity management market in terms of value by service type, industry, and region
  • To forecast the market, in terms of value, for various segments concerning four main regions: North America, Europe, Asia Pacific, and Rest of the World (RoW)
  • To provide detailed information regarding the major factors, such as drivers, restraints, opportunities, and industry-specific challenges, influencing the growth of the asset integrity management market
  • To analyze the micromarkets1 concerning individual growth trends, prospects, and contributions to the total market
  • To study the complete value chain and allied industry segments and perform a value chain analysis of the asset integrity management landscape
  • To strategically analyze the regulatory landscape, tariff, standards, patents, Porter’s five forces, import and export scenarios, trade values, and case studies pertaining to the market under study
  • To analyze the opportunities in the market for various stakeholders by identifying the high-growth segments of the asset integrity management market
  • To profile the key players and comprehensively analyze their market position in terms of ranking and core competencies2, along with detailing the competitive landscape for the market leaders
  • To analyze competitive developments, such as partnerships and joint ventures, mergers and acquisitions, product/service developments, expansions, and research and development, in the asset integrity management market

Available Customizations

With the given market data, MarketsandMarkets offers customizations according to the specific requirements of companies. The following customization options are available for the report:

  • Detailed analysis and profiling of additional market players (up to 5)
  • Additional country-level analysis of the asset integrity management market

Product Analysis

  • Product matrix, which provides a detailed comparison of the product portfolio of each company in the asset integrity management market.
Custom Market Research Services

We will customize the research for you, in case the report listed above does not meet with your exact requirements. Our custom research will comprehensively cover the business information you require to help you arrive at strategic and profitable business decisions.

Request Customization

Instant Answers with GPT - Ask Now!

Ask real questions. Get complete answers !
Report Code
SE 5529
Published ON
Apr, 2024
Choose License Type
BUY NOW
  • SHARE
X
Request Customization
Speak to Analyst
Speak to Analyst
OR FACE-TO-FACE MEETING
PERSONALIZE THIS RESEARCH
  • Triangulate with your Own Data
  • Get Data as per your Format and Definition
  • Gain a Deeper Dive on a Specific Application, Geography, Customer or Competitor
  • Any level of Personalization
REQUEST A FREE CUSTOMIZATION
LET US HELP YOU!
  • What are the Known and Unknown Adjacencies Impacting the Asset Integrity Management Market
  • What will your New Revenue Sources be?
  • Who will be your Top Customer; what will make them switch?
  • Defend your Market Share or Win Competitors
  • Get a Scorecard for Target Partners
CUSTOMIZED WORKSHOP REQUEST
+1-888-600-6441
  • Call Us
  • +1-888-600-6441 (Corporate office hours)
  • +1-888-600-6441 (US/Can toll free)
  • +44-800-368-9399 (UK office hours)
CONNECT WITH US
ABOUT TRUST ONLINE
©2024 MarketsandMarkets Research Private Ltd. All rights reserved
DMCA.com Protection Status Website Feedback