
Non-Destructive Testing (NDT) and Inspection Market Size, Share and Trends

NDT and Inspection Market Size, Share & Trends by Technique (Ultrasonic Testing, Visual, Magnetic Particle, Liquid Penetration, Eddy-Current, Radiographic, Acoustic Emission), Service, Method, Vertical, Application and Region - Global Forecast to 2030


NDT AND INSPECTION MARKET SIZE, SHARE & TRENDS
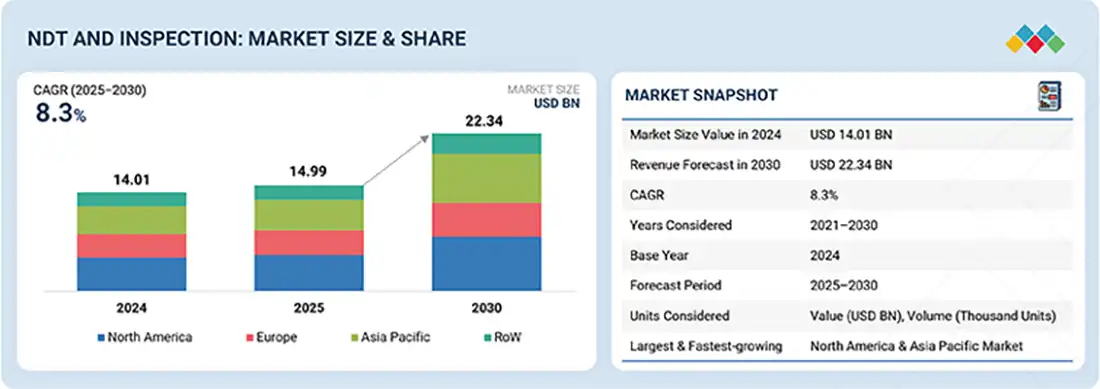
The According to Marketsandmarkets, The global NDT and Inspection market size was valued at USD 14.99 billion in 2025 and is projected to reach USD 22.34 billion by 2030, growing at a CAGR of 8.3% from 2025 to 2030. Non-destructive testing (NDT) and inspection involve evaluating materials, components, or systems for defects or integrity without causing damage. The market growth is driven by the rising demand for advanced testing technologies, stringent safety regulations, and the need for predictive maintenance, with industries increasingly adopting digital inspection solutions to enhance reliability, efficiency, and compliance.
MARKET SNAPSHOT TABLE
| REPORT METRIC | Scope |
|---|---|
|
Market Size in 2025 (Value)
|
USD 14.99 Billion |
| Market Forecast in 2030 (Value) | USD 22.34 Billion |
| Growth Rate | CAGR of 8.3% from 2025-2030 |
| Market size available for years | 2021–2030 |
| Base year considered | 2024 |
| Forecast period | 2025–2030 |
| Forecast units | Value (USD Million) |
| Report Coverage | Revenue forecast, company ranking, competitive landscape, growth factors, and trends |
| Segments covered |
|
| Geographies covered |
|
| Companies covered |
|
| Growth Drivers |
|
Market Size & Forecast
The NDT and Inspection market is experiencing robust growth as industries increasingly adopt advanced inspection technologies to ensure safety, quality, and reliability without damaging assets. NDT techniques, including ultrasonic testing, radiography, magnetic particle testing, and eddy current testing, are widely used across sectors such as aerospace, automotive, oil & gas, power generation, and manufacturing. The market is driven by rising safety regulations, aging infrastructure, and the demand for predictive maintenance solutions that reduce downtime and operational costs. Technological advancements, such as automated inspection systems, digital imaging, and AI-enabled analytics, are enhancing accuracy, efficiency, and real-time decision-making, positioning the NDT market for strong growth globally.
The NDT and Inspection market is witnessing significant growth as industries increasingly rely on advanced tools to inspect materials, components, and structures without causing damage. NDT equipment, including ultrasonic testers, radiography systems, magnetic particle devices, and eddy current instruments, is essential for ensuring product quality, safety, and compliance across sectors such as aerospace, automotive, oil & gas, and manufacturing. Market growth is driven by stringent safety regulations, the need for predictive maintenance, and technological innovations like portable devices, digital imaging, and AI-integrated analysis systems, which enhance accuracy, efficiency, and real-time decision-making. With increasing industrial automation and infrastructure modernization, the global NDT equipment market is poised for sustained expansion.
NDT AND INSPECTION MARKET KEY TAKEAWAYS
-
BY TECHNIQUEUltrasonic testing (UT) leads the market, while the acoustic emission testing (AET) segment is projected to register the highest growth. Emerging techniques like terahertz imaging and NIRS are adopted for specialized inspection needs.
-
BY SERVICEInspection services dominate, while training, certification, consultancy, and maintenance services are growing at a high rate. Equipment rental services and calibration services are steadily expanding to support industrial requirements.
-
BY VERTICALOil & gas holds the largest market share. However, the aerospace segment is projected to register the highest CAGR. The manufacturing, automotive, power, and public infrastructure sectors also contribute to the expanding NDT market.
-
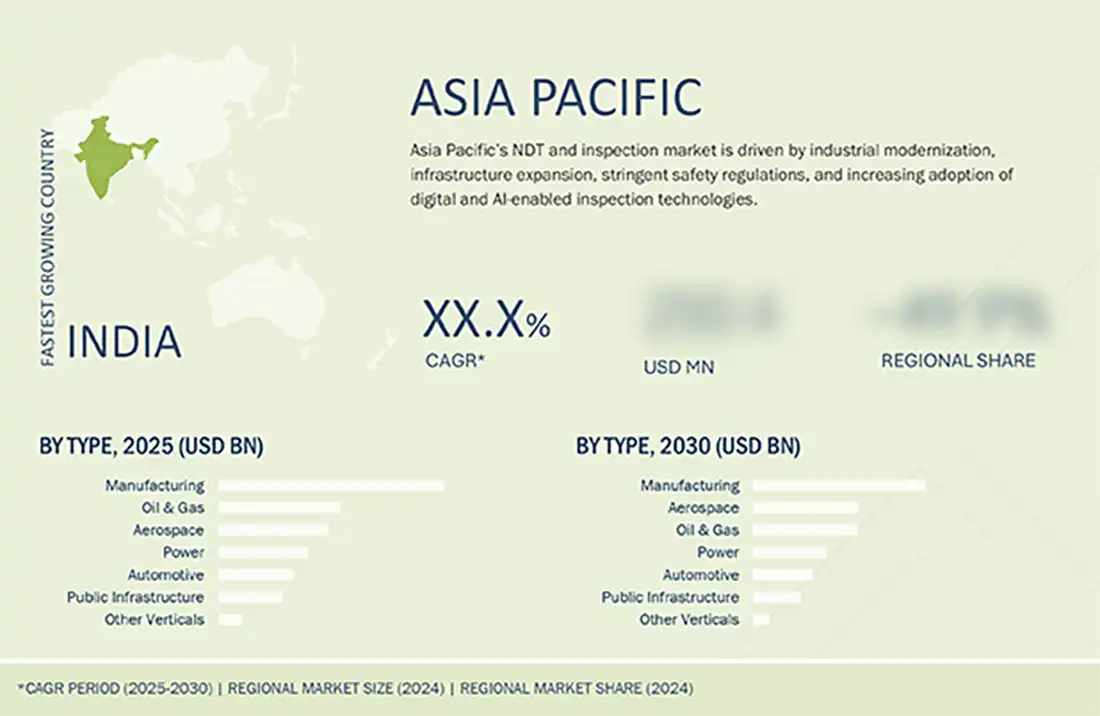
BY REGIONAsia Pacific is the fastest-growing region due to industrial expansion and regulatory focus. North America and Europe maintain strong adoption of advanced techniques and integrated service offerings.
-
COMPETITIVE LANDSCAPEKey players like SGS Société Générale De Surveillance SA, Bureau Veritas, Baker Hughes Company, Applus+, and Intertek Group plc focus on digital inspection, advanced NDT equipment, and global service networks to strengthen market presence and reliability.
The NDT and inspection industry is projected to grow steadily, driven by rising industrial safety requirements, stringent regulations, and demand for predictive maintenance. From ultrasonic and visual testing to advanced acoustic and radiographic techniques, the market benefits from digital solutions, AI-enabled analytics, and service expansions. Growing adoption across the oil & gas, aerospace, and power sectors further accelerates deployment, positioning it as a critical enabler of industrial reliability and compliance.
Source: Secondary Research, Interviews with Experts, MarketsandMarkets Analysis
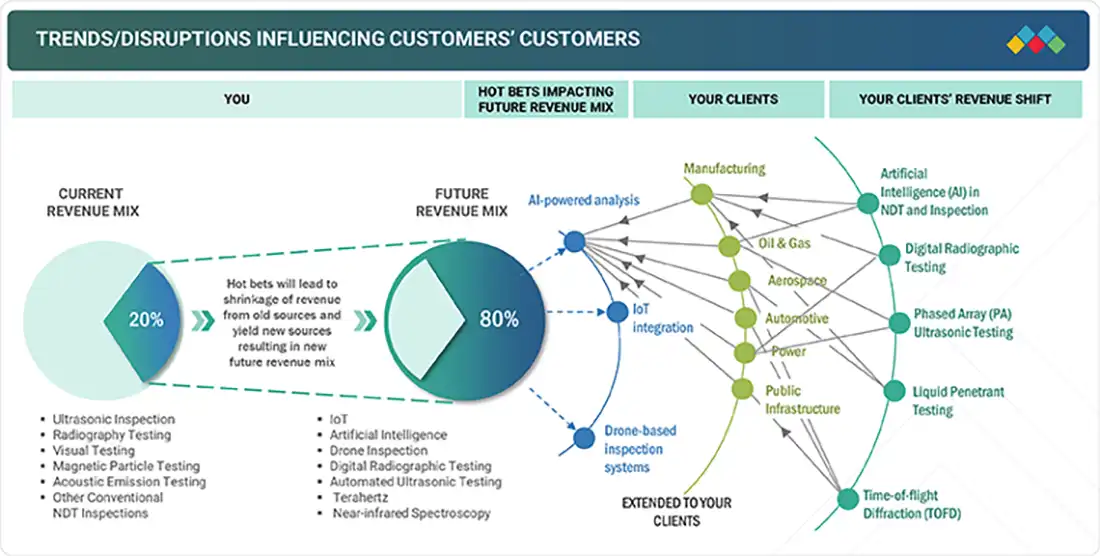
TRENDS & DISRUPTIONS IMPACTING CUSTOMERS' CUSTOMERS
In the NDT and inspection market, hot bets include AI-powered analysis, IoT integration, and drone-based inspection systems, with target applications spanning manufacturing, oil & gas, aerospace, automotive, power, and public infrastructure sectors. Disruptions such as digital radiographic testing, automated ultrasonic inspection, and phased array technologies will reshape client revenues, which in turn influence investment priorities and drive overall revenue growth for NDT solution providers.
Source: Secondary Research, Interviews with Experts, MarketsandMarkets Analysis
NDT AND INSPECTION MARKET DYNAMICS
Level
-
Implementation of stringent safety regulations to ensure public safety and product quality

-
Expansion of industrial automation and robotics in inspection

Level
-
Shortage of skilled technicians for advanced NDT operations

-
High cost of NDT equipment and related technologies

Level
-
Growing demand for NDT and inspection services in renewable energy and power sectors

-
Growing demand for miniaturized and portable NDT devices

Level
-
Increasing complexity of modern industrial structures and materials

-
High replacement and upgrade costs

Source: Secondary Research, Interviews with Experts, MarketsandMarkets Analysis
Driver: Increasing demand for remote and contactless inspection solutions
Rising safety, reliability, and quality requirements across industries such as oil & gas, power, aerospace, and manufacturing are driving rapid growth in NDT and inspection. Adoption of remote and contactless solutions, robotics, AR, and wireless sensors enhances efficiency and safety, while AI, IoT, and digital twin technologies enable predictive maintenance and proactive decision-making.
Restraint: High cost of NDT equipment and related technologies
The high upfront cost of advanced NDT equipment, including PAUT, digital radiography, and eddy-current devices, limits adoption, particularly among SMEs. Additional expenses for skilled training, software integration, calibration, and maintenance further raise total ownership costs. Multi-site standardization and operational downtime amplify financial barriers, prompting many organizations to rely on conventional, less-capable inspection methods despite long-term benefits.
Opportunity: Growing demand for NDT and inspection services in the renewable energy and power sectors
The global NDT and inspection market is witnessing strong opportunities in the renewable energy and power sectors, driven by rapid growth in wind, solar, and nuclear projects. Advanced techniques like UT, PAUT, radiography, and eddy-current testing, combined with AI analytics and remote monitoring, ensure asset integrity, preventive maintenance, operational efficiency, and positioning service-oriented solutions for long-term growth amid global clean energy adoption.
Challenge: Increasing complexity of modern industrial structures and materials
A key challenge in the NDT and inspection market is the growing complexity of modern industrial structures and advanced materials, including composites, alloys, ceramics, and 3D-printed parts. Detecting defects in uneven, layered, or intricate components requires advanced techniques such as PAUT, CT, and laser-based inspections, supported by AI-enabled systems. Addressing this requires substantial R&D, skilled technicians, and high-cost equipment, posing adoption challenges for smaller players and emerging markets.
NDT and Inspection Market: COMMERCIAL USE CASES ACROSS INDUSTRIES
| COMPANY | USE CASE DESCRIPTION | BENEFITS |
|---|---|---|
 |
AI-powered digital radiographic testing integrated with IoT sensors for real-time quality assurance across manufacturing and oil & gas facilities | Enhanced inspection accuracy combined with predictive maintenance reduces manual testing time, improves equipment reliability, and drives overall operational efficiency |
 |
Drone-based inspection systems with automated ultrasonic testing for aerospace and public infrastructure projects enabling remote asset monitoring | Streamlined inspection processes lower operational costs while strengthening safety protocols and ensuring comprehensive digital documentation for regulatory compliance |
 |
Phased array ultrasonic testing platforms integrated with artificial intelligence for predictive analysis in power generation and automotive sectors | Real-time defect detection supports optimized asset lifecycle management, minimizes downtime, and enables proactive fault identification for long-term reliability |
 |
Digital inspection workflows combining liquid penetrant testing with time-of-flight diffraction analysis for comprehensive structural assessment | Integrated reporting systems enhance data accuracy, accelerate project completion timelines, and improve coordination across inspection workflows |
 |
Smart NDT platforms utilizing magnetic particle testing and near-infrared spectroscopy with cloud-based analytics for multi-industry applications | Standardized testing procedures coupled with global data accessibility enable automated compliance reporting and deliver measurable operational cost savings |
Logos and trademarks shown above are the property of their respective owners. Their use here is for informational and illustrative purposes only.
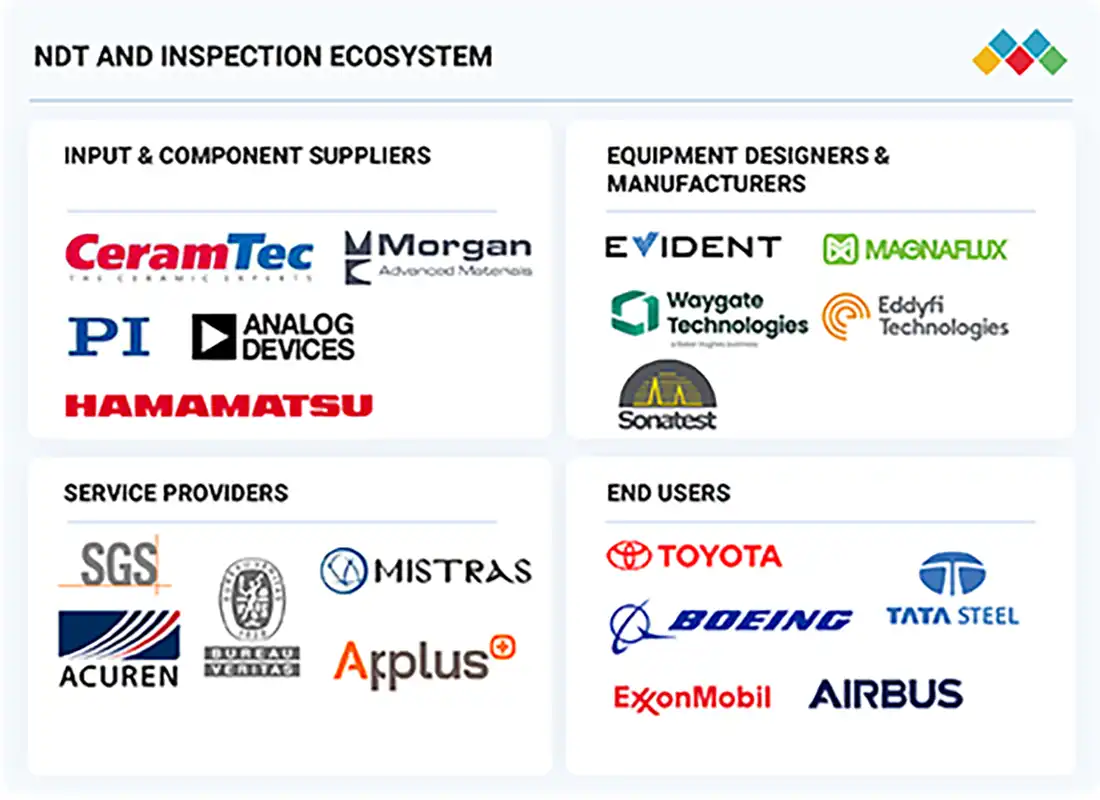
NDT AND INSPECTION MARKET ECOSYSTEM
The NDT and inspection ecosystem spans input and component suppliers, equipment designers and manufacturers, service providers, and end users. Component suppliers provide advanced materials and sensing technologies, while equipment manufacturers develop specialized testing and analysis systems. Service providers deliver comprehensive inspection solutions and compliance expertise, and end users across the automotive, aerospace, energy, and manufacturing sectors ensure asset integrity, safety standards, and operational reliability.
Logos and trademarks shown above are the property of their respective owners. Their use here is for informational and illustrative purposes only.
NDT AND INSPECTION MARKET SEGMENTS
Source: Secondary Research, Interviews with Experts, MarketsandMarkets Analysis
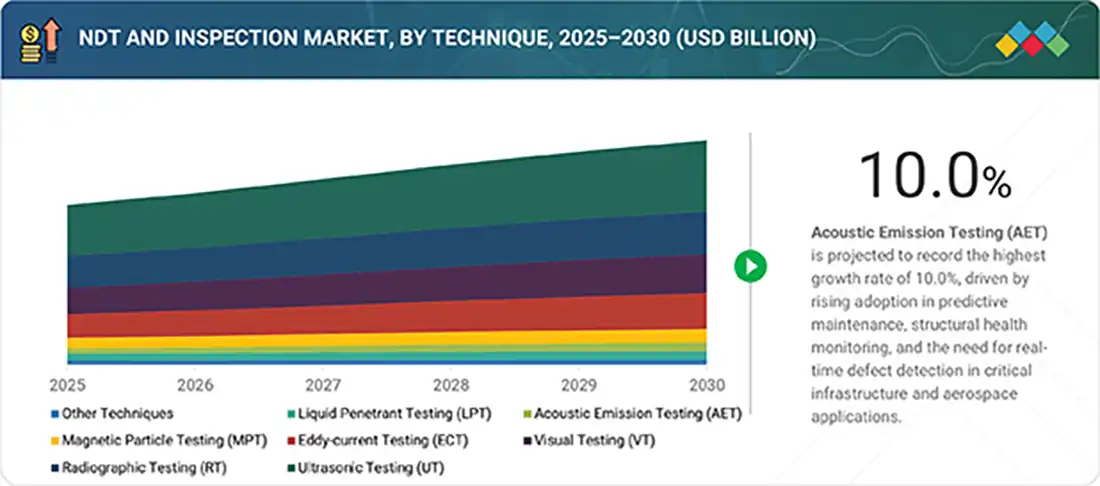
NDT and Inspection Market, By Technique
The ultrasonic testing (UT) segment accounted for the largest market share in 2024, driven by widespread adoption of straight beam, angle beam, immersion, phased array, TOFD, and guided wave methods across the oil & gas, aerospace, and power industries. Acoustic emission testing (AET) is anticipated to grow at the fastest CAGR, fueled by predictive maintenance, structural health monitoring, and AI-enabled detection. Emerging techniques such as terahertz imaging and near-infrared spectroscopy (NIRS) are gaining traction for specialized applications requiring high precision and sensitivity.
NDT and Inspection Market, By Services
Inspection services held the largest market share in 2024, supported by demand for ultrasonic, radiographic, visual, magnetic particle, eddy-current, and liquid penetrant inspections across industrial sectors. Other services, including training, certification, consultancy, and maintenance and repair, are projected to register the highest CAGR as industries increasingly seek end-to-end solutions and skilled personnel. Equipment rental and calibration services continue to expand through flexible, cost-efficient models that support complex inspection requirements.
NDT and Inspection Market, By Vertical
The oil & gas vertical accounted for the largest market share in 2024, driven by inspection requirements in refineries, transmission pipelines, subsea pipelines, and storage tanks. The market in the aerospace segment is expected to grow at the fastest CAGR, propelled by advanced inspection needs for aircraft engine parts, composite airframes, maintenance, and material analysis. Manufacturing, automotive, power, public infrastructure, and other verticals, including marine, medical, and polymers, continue to adopt advanced inspection techniques to ensure safety, reliability, and regulatory compliance.
REGION
Asia Pacific to be the fastest-growing region in the global NDT and inspection market during the forecast period
The Asia Pacific NDT and inspection market is poised for the fastest growth, driven by rapid industrialization, infrastructure expansion, and the adoption of advanced inspection technologies. Countries such as China, India, and Japan are witnessing increasing demand across the oil & gas, aerospace, manufacturing, and power sectors. Supportive government regulations, rising investments in digital inspection solutions, and the push for safety and compliance are further accelerating regional deployment and adoption of advanced NDT services and equipment.
The NDT and inspection market in North America is projected to expand steadily from USD 5.16 billion in 2025 to USD 7.71 billion by 2030 at a CAGR of 8.4%. The regional market growth is supported by a large base of aging oil & gas, power, aerospace, and infrastructure assets and a strong regulatory focus on safety and environmental compliance. Furthermore, the increasing adoption of advanced ultrasonic testing, digital radiography, remote and drone-based inspection, and NDT 4.0 solutions that integrate sensors, IoT connectivity, and AI-enabled analytics drives the market. Asset owners are shifting from purely code-driven periodic testing toward risk-based and condition-based inspection programs, while service providers and equipment OEMs capture new value pools in data management, integrity-management software, and long-term asset health contracts.
The European NDT and inspection market is projected to expand steadily from USD 3.48 billion in 2025 to USD 4.80 billion by 2030 at a CAGR of 6.7%. The regional market is driven by expanding aerospace and automotive production, which demands high precision and safety in components. The increasing use of lightweight composites, advanced alloys, and additive manufacturing parts requires advanced inspection methods, including ultrasonic testing, CT scanning, and digital radiography. The focus on Industry 4.0, automation, and predictive maintenance enhances operational efficiency and boosts reliance on NDT solutions. Rising production volumes, electric vehicle adoption, and aerospace fleet modernization further increase the need for regular testing, in-line inspection, and regulatory compliance, supporting steady regional market expansion
The Asia Pacific NDT and Inspection market is projected to reach USD 6.91 billion by 2030 from USD 4.30 billion in 2025, at a CAGR of 10.0% from 2025 to 2030. The regional market is driven by rapid infrastructure development, expansion of manufacturing and energy assets, and stricter safety and compliance mandates across emerging and developed economies. Industries are increasingly adopting advanced techniques, such as digital radiography, PAUT, robotics, and IoT-enabled monitoring, to improve inspection accuracy and reduce downtime. The region is also witnessing a strong push toward automation and AI-based defect recognition to address skill shortages and enhance operational efficiency. These trends are accelerating the transition from traditional periodic inspections to data-centric, continuous asset-integrity management models.
NDT and Inspection Market: COMPANY EVALUATION MATRIX
In the NDT and inspection companies matrix, SGS Société Générale De Surveillance SA (Star) leads with its extensive global footprint, comprehensive service portfolio, and expertise across inspection, certification, training, and advanced testing technologies. Baker Hughes Company (Emerging Leader) is rapidly gaining traction through its growing adoption of digital inspection solutions, predictive maintenance services, and AI-enabled analytics. While SGS maintains market leadership through scale and diversified capabilities, Baker Hughes demonstrates strong momentum to advance toward the leaders’ quadrant.
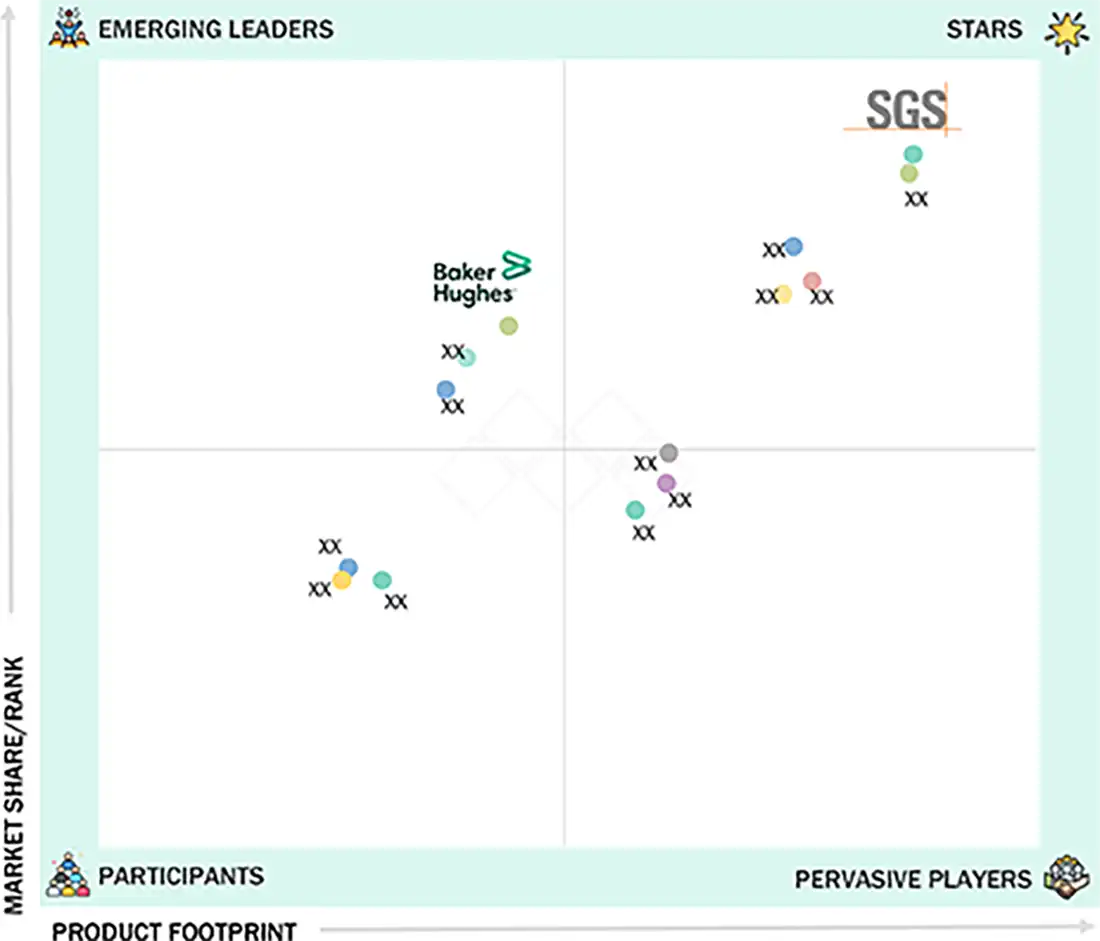
Source: Secondary Research, Interviews with Experts, MarketsandMarkets Analysis
NDT AND INSPECTION MARKET KEY PLAYERS
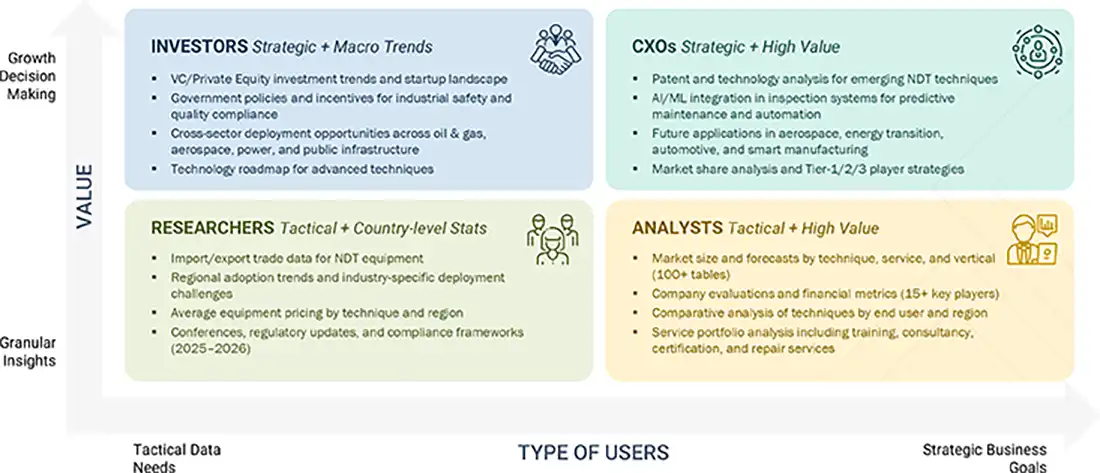
WHAT IS IN IT FOR YOU: NDT and Inspection Market REPORT CONTENT GUIDE
DELIVERED CUSTOMIZATIONS
We have successfully delivered the following deep-dive customizations:
| CLIENT REQUEST | CUSTOMIZATION DELIVERED | VALUE ADDS |
|---|---|---|
| North American Oil & Gas Company | Comparative benchmarking of AI-powered analysis vs. conventional ultrasonic testing for pipeline integrity management |
|
| European Aerospace Manufacturer | Lifecycle cost-benefit analysis of drone-based inspection systems for composite aircraft component evaluation |
|
| Asia Pacific Power Utility | Evaluation of IoT sensor integration with digital radiographic testing for power generation equipment monitoring |
|
| Global Automotive OEM | Assessment of phased array ultrasonic testing for electric vehicle battery and lightweight material inspections |
|
| Global NDT Equipment Manufacturer | Market research study on automated inspection workflows for multi-industry applications and service integration |
|
RECENT DEVELOPMENTS IN NDT AND INSPECTION MARKET
- October 2024 : Creaform (Canada) released VXintegrity 3.0 in October 2024. This software upgrade includes finite element analysis (FEA) and API 579 standards for faster and more accurate fitness-for-service assessments in oil and gas infrastructure.
- March 2024 : Evident (US) launched new features in its phased-array inspection solutions with the MapROVER and SteerROVER scanners. These scanners improve weld and corrosion inspections in hard-to-reach areas as well as high-temperature surfaces of pipes, tanks, and pressure vessels.
- December 2023 : MISTRAS Group (US) partnered with Voliro AG (Switzerland) to merge their drone-based NDT solutions. This partnership enhances inspection capabilities for assets like storage tanks and wind turbines using ultrasonic (UT) and electromagnetic acoustic transducer (EMAT) payloads.
- August 2023 : Waygate Technologies (Germany), a Baker Hughes Company (US) business, launched the Krautkramer RotoArray comPAct. This portable phased-array ultrasonic testing (PAUT) system is designed for manual inspection of large composite materials. It makes inspection processes easier and reduces costs for applications in aerospace, energy, and automotive fields.
- August 2023 : Bureau Veritas (France) strengthened its NDT capabilities by acquiring Sievert, a leading NDT service provider. Integration efforts continued into 2023. This acquisition improves Bureau Veritas’s global NDT offerings, which include ultrasonic, radiographic, and advanced inspection services for new construction and in-service assets.
Table of Contents
 Exclusive indicates content/data unique to MarketsandMarkets and not available with any competitors.
Methodology
The research study involved four major activities in estimating the size of the NDT and inspection market. Exhaustive secondary research has been done to collect important information about the market and peer markets. The next step has been to validate these findings and assumptions and size them with the help of primary research with industry experts across the value chain. Both top-down and bottom-up approaches have been used to estimate the market size. Post which the market breakdown and data triangulation have been adopted to estimate the market sizes of segments and sub-segments.
Secondary Research
In the secondary research process, various secondary sources were referred to identify and collect information required for this study. The secondary sources include annual reports, press releases, investor presentations of companies, white papers, and articles from recognized authors. Secondary research has been mainly done to obtain key information about the market’s value chain, the pool of key market players, market segmentation according to industry trends, regional outlook, and developments from both market and technology perspectives.
The NDT and inspection market report estimates the global market size using both the top-down and bottom-up approaches, along with several other dependent submarkets. The major players in the market were identified using extensive secondary research, and their presence in the market was determined using secondary and primary research. All the percentage shares, splits, and breakdowns have been determined using secondary sources and verified through primary sources.
Primary Research
Extensive primary research has been conducted after understanding the NDT and inspection market scenario through secondary research. Several primary interviews have been conducted with key opinion leaders from demand- and supply-side vendors across four major regions—North America, Europe, Asia Pacific, and the Rest of the World. Approximately 25% of the primary interviews have been conducted with the demand-side vendors and 75% with the supply-side vendors. Primary data has been collected mainly through telephonic interviews, which consist of 80% of the total primary interviews; questionnaires and emails have also been used to collect the data.
After successful interaction with industry experts, brief sessions were conducted with highly experienced independent consultants to reinforce the findings of our primary research. This, along with the in-house subject matter experts’ opinions, has led us to the findings as described in the report.

Note: “Others” includes sales, marketing, and product managers
To know about the assumptions considered for the study, download the pdf brochure
Market Size Estimation
In the market engineering process, top-down and bottom-up approaches and data triangulation methods have been used to estimate and validate the size of the NDT and inspection market and other dependent submarkets. The research methodology used to estimate the market sizes includes the following:
- Identifying stakeholders in the NDT and inspection market, including regulatory bodies (e.g., ASME, ISO, API), certification agencies, industry associations, consulting firms, equipment manufacturers, service providers, and end users across industries such as oil & gas, aerospace, automotive, power, and public infrastructure
- Analyzing major providers of NDT equipment and services and their key offerings, including ultrasonic testing (UT), radiographic testing (RT), eddy-current testing (ECT), magnetic particle testing (MPT), liquid penetrant testing (LPT), acoustic emission testing (AET), visual inspection systems, and other emerging techniques (e.g., terahertz imaging and near-infrared spectroscopy)
- Studying trends of NDT adoption across sectors such as manufacturing, oil & gas, aerospace, automotive, power, and public infrastructure
- Tracking recent market developments, including regulatory updates, technology advancements (e.g., AI- and IoT-integrated inspection platforms, robotic and drone-based inspection systems), product innovations, facility expansions, and mergers & acquisitions by key players to forecast market size and emerging opportunities
- Conducting multiple discussions with key opinion leaders, including equipment OEMs, service providers, quality assurance consultants, and regulatory auditors to understand real-time adoption trends, technical challenges, and the rising focus on predictive maintenance, automation, and data-driven inspection strategies
- Validating market estimates through in-depth consultations with industry experts—ranging from R&D heads of leading NDT equipment manufacturers to asset integrity managers and technical advisors—and aligning insights with domain specialists at MarketsandMarkets for accurate and reliable market projections
NDT and Inspection Market : Top-Down and Bottom-Up Approach

Data Triangulation
After arriving at the overall market size by the market size estimation process explained in the earlier section, the overall NDT and inspection market has been divided into several segments and subsegments. The data triangulation and market breakdown procedures have been used to complete the overall market engineering process and arrive at the exact statistics for all segments, wherever applicable. The data has been triangulated by studying various factors and trends from both the demand and supply-side perspectives. Along with data triangulation and market breakdown, the market has been validated through top-down and bottom-up approaches.
Market Definition
The non-destructive testing (NDT) and inspection market comprises technologies and services used to assess the quality, integrity, and performance of materials or structures without causing damage. NDT techniques, such as ultrasonic, radiographic, eddy-current, visual, and magnetic particle testing, enable flaw detection, stress analysis, and material characterization across critical applications. Inspection, including both visual and instrument-based methods, ensures compliance with quality standards, specifications, and regulations. NDT and inspection are essential for ensuring operational safety, product reliability, and process efficiency across industries such as aerospace, manufacturing, oil & gas, automotive, and power. The market is evolving with digital advancements, such as AI, IoT, robotics, and cloud-based platforms, for real-time monitoring and data-driven decision-making.
Key Stakeholders
- Original Equipment Manufacturers (OEMs)
- NDT Equipment Distributors and Suppliers
- Suppliers of Accessories and Consumables for NDT Equipment
- Providers of NDT and Inspection Services
- Research Organizations, Testing Laboratories, and Consulting Firms
- Government Bodies, Regulatory Authorities, and Policymakers
- Industry Associations, Standards Bodies, and Alliances (e.g., ASNT
- Venture Capitalists and Private Equity Firms
Report Objectives
- To define, describe, segment, and forecast the size of the NDT and inspection market, by technique, service, vertical, and region, in terms of value
- To describe the NDT and inspection market based on application
- To forecast the market size for the technique segmentation for ultrasonic testing (UT) equipment, in terms of volume
- To forecast the size of various segments of the market in four regions: North America, Asia Pacific, Europe, and the Rest of the World (RoW), in terms of value
- To offer detailed information on drivers, restraints, opportunities, and challenges influencing the market growth
- To provide a detailed overview of the NDT and inspection market value chain
- To strategically analyze the micromarkets concerning individual growth trends, prospects, and contributions to the overall market
- To study the impact of AI/Gen AI and the 2025 US tariff on the market under study, along with the macroeconomic outlook for each region
- To analyze opportunities for various stakeholders by identifying the high-growth segments of the market
- To benchmark the key players and analyze their market position in terms of revenue, market share, and core competencies2, and a detailed competitive landscape for the market leaders
- To analyze competitive developments such as product/service launches, agreements, partnerships, collaborations, acquisitions, and investments carried out by players in the NDT and inspection market
Available Customizations:
With the given market data, MarketsandMarkets offers customizations according to the specific requirements of companies. The following customization options are available for the report:
Country-wise Information:
- Country-wise breakdown for North America, Europe, Asia Pacific, and Rest of the World
Company Information:
- Detailed analysis and profiling of additional market players (up to five)
Key Questions Addressed by the Report
What is the current size of the NDT and Inspection Market?
The global NDT and Inspection Market is estimated at USD 14.99 billion in 2025.
What is the projected market size of the NDT and Inspection Market by 2030?
The market is expected to reach USD 22.34 billion by 2030.
What CAGR is the NDT and Inspection Market expected to register during 2025–2030?
The market is projected to grow at a CAGR of 8.3% during the forecast period.
What are the major trends shaping the NDT and Inspection Market?
Key trends include AI-powered inspection, IoT-enabled monitoring, digital twin integration, drone-based inspections, robotic inspection systems, digital radiography, and automated ultrasonic testing.
What is a major growth driver for the NDT and Inspection Market?
A key growth driver is the increasing demand for remote and contactless inspection solutions, particularly across oil & gas, aerospace, manufacturing, and power industries to improve safety and operational efficiency.
Which companies are leading the NDT and Inspection Market?
Major market participants include SGS SA, Bureau Veritas, Baker Hughes, Applus+, Intertek Group plc, MISTRAS Group, Evident Corporation, and Waygate Technologies.
Which industry vertical holds the largest share of the NDT and Inspection Market?
The oil & gas industry holds the largest market share due to extensive inspection requirements for pipelines, storage tanks, refineries, and offshore assets.
Which NDT technique dominates the market?
Ultrasonic Testing (UT) accounted for the largest market share in 2024 because of its widespread use in aerospace, oil & gas, manufacturing, and power generation industries.
Which region is expected to witness the fastest growth in the NDT and Inspection Market?
Asia Pacific is projected to be the fastest-growing region, expected to grow from USD 4.30 billion in 2025 to USD 6.91 billion by 2030, at a CAGR of 10.0%.
What does the report analysis indicate about the future of the NDT and Inspection Market?
The report indicates strong future growth driven by industrial automation, predictive maintenance, stringent safety regulations, renewable energy investments, AI-enabled defect detection, and increasing adoption of robotics and digital inspection technolo
Need a Tailored Report?
Customize this report to your needs
Get 10% FREE Customization
Customize This ReportPersonalize This Research
- Triangulate with your Own Data
- Get Data as per your Format and Definition
- Gain a Deeper Dive on a Specific Application, Geography, Customer or Competitor
- Any level of Personalization
Let Us Help You
- What are the Known and Unknown Adjacencies Impacting the NDT and Inspection Market
- What will your New Revenue Sources be?
- Who will be your Top Customer; what will make them switch?
- Defend your Market Share or Win Competitors
- Get a Scorecard for Target Partners

Custom Market Research Services
We Will Customise The Research For You, In Case The Report Listed Above Does Not Meet With Your Requirements
Get 10% Free CustomisationTESTIMONIALS

Tetsuya Ohhira
Business Development Manager-Technology Business
Nikon Corporation,
Leading Japanese MNC specializing in optics and imaging productswww.nikon.com
MarketsandMarkets™ response
is quick. Their attitude is flexible and positive. Analyst Insights are globally considered and
significant. Client Services quickly respond to our inquiry and demand. Their wide range of global
surveys help us make our strategic plan.
We hope Knowledge Store will be easier to search
for a report.
VP - Marketing & Business Development
Leading Provider of Process Control Solutions
We engaged with MarketsandMarkets on a study to perform an analysis and recommend a Go-To-Market strategy for metrology and process control in the semiconductor market. The study was tailored to our targets and needs with well-defined milestones. Our overall experience with the MarketsandMarkets team was very good throughout the project in all aspects including the analysis methodologies used, the quality and depth of primary and secondary data sets, the professionalism and flexibility of the team and the ability to meet the target schedule and milestones. We want to thank MarketsandMarkets team for a job well done.
- US NDT and Inspection Market
- Canada NDT and Inspection Market
- Mexico NDT and Inspection Market
- Germany NDT and Inspection Market
- UK NDT and Inspection Market
- France NDT and Inspection Market
- Italy NDT and Inspection Market
- Rest Of Europe NDT and Inspection Market
- China NDT and Inspection Market
- Japan NDT and Inspection Market
- India NDT and Inspection Market
- Rest Of Asia Pacific NDT and Inspection Market
Growth opportunities and latent adjacency in NDT and Inspection Market


Daniil
Jan, 2017
I am really interested on NDT, so can you provide me the general information about it and also a market research on NDT in Spain if that is possible..
Dennis
May, 2013
I am interested in the following sections of the report - Gamma Radiography Equipment and Isotopes for Industrial Radiography Inspection. Digital Imaging in Industrial Radiography for CR and DR..
Calum
Aug, 2019
After reviewing several different market research reports, MarketsandMarkets have concluded that the NDT market is much lower than other research institutions by up to 50%. I was wondering if you could highlight why this may be? .
David
Jun, 2016
Could you give me a sample of pages, inspection (page 82 onwards)? It would be very helpful in making a decision on whether to buy..
Alan
Apr, 2026
Which specific customer segments (residential, enterprise, utilities, builders) are driving the highest demand, and why now?.
William
Apr, 2026
What does the value chain and ecosystem of the NDT inspection industry look like, from equipment manufacturers to service providers?.
Tania
Jun, 2019
I am looking for information to support an NDT Inspection Services client in making strategic growth decisions..
Mustafa
Jun, 2019
We need the details of 2019 to 2024 market of Turkey about Advanced NDT methods and conventional NDT methods..
j
May, 2019
This is not a typical area for us, just trying to get a high level understanding of what industrial radiography (only) looks like at the global level. .
clara
Feb, 2016
Can I get more information related to NDT Market, identify top player US and international players, pricing analysis, market share?.
rohit
Feb, 2019
I want to start my business in NDT market. Do you have any discounts for start-ups?.
JAS
May, 2019
I am looking to tap into the NDT rental equipment market in Malaysia but not limited to the Asia region. Any help in the current market information would be great..
Faisal
Dec, 2014
I was wondering if this report could be reorganized or customized to fit the NDT trends in Saudi Arabia. We are interested to learn about the demand in terms of industry, techniques, growth, competition, etc. .
Komal
Nov, 2017
I am interested in the following - 1. market share of UAE alone, 2.market share of NDT companies within UAE. 3. Market share for NDT equipment 4. Market share of NDT services. .
Ahmed
Apr, 2016
Could you please provide data related to the prices of the following equipment; AC Yoke, UT wall thickness, UT Shear wave, Flux inspection equipment & Eddy Current..
Patrick
Dec, 2014
Request a Complimentary Copy of the NDT Report Insights, Key Findings, Drivers, Trends, Program Sources, and Methodology. .
Kiran
Jun, 2019
We are a start up in Kenya for NDT solutions and want to do aerospace and industrial testing. Our scope is east and central Africa, please send us some date..
Kiran
Jun, 2019
We are a start up in Kenya for NDT solutions and want to do aerospace and industrial testing. Our scope is east and central Africa, please send us some date..
Ralf
Jun, 2014
Do you provide any discount for visual inspection Technology only? Details available for visual inspection e.g. video scopes..
Fumi
Feb, 2016
We are a sales agent in Japan. Now we are asked by one of our customers in Japan for quote for the NDT market report (Single User License). If we help the customer to purchase the report, could you give us quote for it, please ? The customer has difficulty to pay directly to foreign companies, therefore, they ask us to obtain the item on behalf of them. As for payment, we will pay by our corporate credit card or remit by wire transfer into your bank account in advance. When we place an order, we will send you a PO by fax if required..
Carlos
Aug, 2016
We are interested in your report on Non-Destructive Testing and Inspection Market by Technique (Visual Testing, Magnetic Particle, Liquid Penetrant, Eddy Current, Ultrasonic, Radiographic, Acoustic Emission, Terahertz Imaging), Service, Vertical, and Geography - Global Forecast to 2022 .
Rajeev
May, 2019
Please share the PDF file of NDT market for us to evaluate the suitable technology..
alexandros
Jan, 2015
I am interested in the following - Non-Destructive Testing Equipment & Services Market by Contact Methods (Ultrasonic, Eddy Current, Electromagnetic, Liquid Penetrant), Non-Contact (Radiography, Thermography, Visual Testing), Services (Inspection, Rental, Training, Consultation).
AURORA
Dec, 2017
I am interested in the following - Pulse Reflectometry Technology, Acoustic Pulse Recognition (APR), global market analysis, current trends and future growth potential. NDT tech applications in new sectors, cross-industry applications, and potential revenues..
Ann
Nov, 2016
Our focus is on most granular data available. Ideally view on supplier landscape (competitive research) in Power gen. Focus on wind, nuclear, gas� Can you provide a free sample of the report?.
Sharon
Nov, 2019
We are looking for testing service market size of "corrosion" vs. "welding/construction" as % of NDT market in North America. Do you have this type of breakdown?.
Olawale
Nov, 2019
Kindly assist with a copy of Non-Destructive Testing and Inspection Market by Technique (Visual Testing, Magnetic Particle, Liquid Penetrant, Eddy Current, Ultrasonic, Radiographic, Acoustic Emission), Method, Service, Vertical, and Geography - Global Forecast to 2023.
KIM
Oct, 2019
I'd like to have some information which is NDT inspection market size. Especially, I want to know RT(Radiographic testing) application market information..
Lee
Sep, 2019
We would like to know NDT market situation in Kazakhstan. Specifically we would like to know NDT market information of NDT flat panel detector in Kazakhstan. .
Telmo
Sep, 2019
What all have you covered under NDT by technique section? Can you provide more details?.
Walid
Sep, 2018
I'm interested in the following sections: Visual Testing, Magnetic Particle, Liquid Penetrant, Eddy Current, Ultrasonic, Radiographic, Acoustic Emission.
Ruben
Aug, 2016
I am preparing a business plan, and want to know the movement or the world market for my business and NDT market..
Dean
Aug, 2016
I am interested in the applications part of NDT market. Do you provide only that section?.
Laurence
Aug, 2018
Our focus is on Eddy current NDT primarily. Can we get a pdf brochure of the NDT report?.
Matt
Jul, 2019
I'm looking to better understand the size and structure of the NDT market and would appreciate a sample of this report before committing to the full report..
Volker
Jul, 2016
We are looking for some information on Market by Non-Contact (Radiography, Thermography, Visual Testing), Services (Inspection, Rental, Training, Consultation), Application & Geography - Analysis & Global Forecast to 2013 - 2020.
SAGAR
Jun, 2018
I am looking for cheaper solutions for NDT equipment and accessories, list of manufacturers in India and NDT work force solutions..
RIVELINO
Jun, 2017
I am interested in your NDT report. I see that it is a worldwide report but the point it is that I am only interested of Mexico which I am located. Does it include the customers list directory per industry as well? Is it possible to buy only the Mexico section of your report? In case of positive, could you please let me know the cost?.
Humphrey
Jun, 2019
I am working on SAM for NDT & Inspection in Sub-Sahara Africa and looking for material to help my forecast..
Robert
May, 2015
I would like to better understand the services analysis to assure this product is appropriate for our use..
peter
Apr, 2015
I am interested in the phase array method, eddy current testing method and a whole overview of the NDT services..
surendran
Apr, 2018
Can I get more information about Pulsed eddy current, ACFM, In-Line inspection, Robotic online tank inspection, Infrared thermography?.
Wilson
Apr, 2017
I am looking for information about the NDT application and their automatization. Investment impact and cost-benefit are my focus point..
Nick
Apr, 2019
Looking for the biggest companies by market share for both Germany and Europe would be helpful. Also the market volumes of both Regions in total and for each technological category (Ultrasonic testing, eddy current,..).
Marc
Apr, 2016
Specifically want examples of sales figures of penetrant testing equipment world wide, Europe & UK 2014 on wards .
Spencer
Feb, 2017
I am a student doing an industry report project on the NDT industry. Access to this report would help me understand and gain more knowledge on this industry..
John
Jan, 2015
I am interested in understanding the NDT market size in dollar value for each country in Asia. If this information is sufficient we may consider buying the entire document to assist with expansion planning. .
sreelal
Jan, 2019
Looking forward for Visual Inspection Standards evolution in Gas Turbine Industry and Additive Mfg. inspection for the same..