Fingerprint Sensor Market

Fingerprint Sensor Market Size, Share and Industry Growth Analysis by Technology (Capacitive, Optical, Thermal, Ultrasonic), Type (Area & Touch, Swipe), Sensor Technology, End-Use Application and Region- Global Forecast to 2029

Report Code: SE 3536 May, 2024, by marketsandmarkets.com

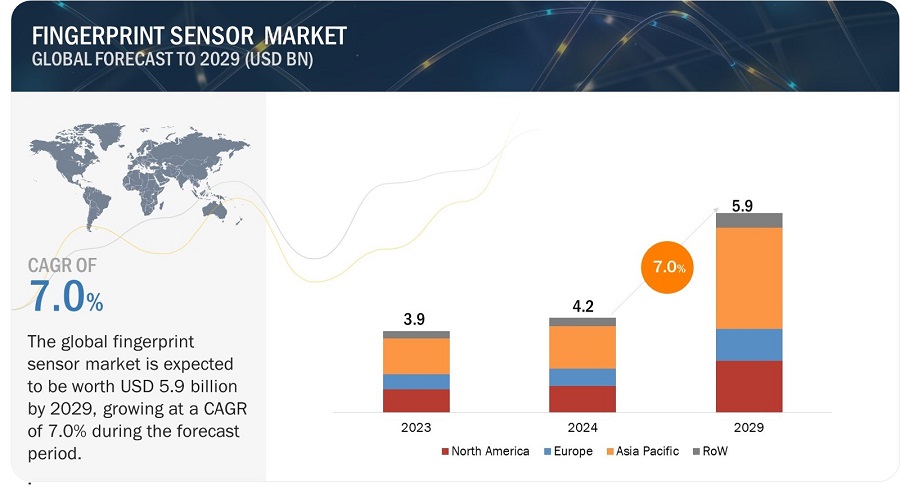
[263 Pages Report] The fingerprint sensor market is projected to grow from USD 4.2 billion in 2024 and is expected to reach USD 5.9 billion by 2029, growing at a CAGR of 7.0% from 2024 to 2029. Implementing biometric technology-based time and attendance registering systems has simplified tracking employees' time and attendance and is driving the market. Fingerprint technology-based systems are user-friendly and easy to install, aiding management in tracking and analyzing employee data. One of their main advantages is preventing employees from logging in for one another, a common issue with older methods like time clocks, sign-in sheets, and ID card swiping. Fingerprint sensors have significantly reduced attendance fraud.

The objective of the report is to define, describe, and forecast the fingerprint sensor market based on technology, sensor technology, type, end-use application, and region.
Fingerprint Sensor Market

Fingerprint Sensor Market

Fingerprint Sensor Market Forecast to 2029

To know about the assumptions considered for the study, Request for Free Sample Report

Fingerprint Sensor Market Dynamics

Drivers: Rise in number of identity threats leading to emergence of fingerprint technologies

Identity theft refers to the illegal acquisition of an individual's personal or financial details to perpetrate fraud, including unauthorized transactions. It occurs through various methods and inflicts harm on victims' credit, finances, and reputation. Recently, there has been an increase in identity threats. According to the Aite Group, 33% of consumers between the ages of 25 to 34 years old experienced identity theft in 2022. On the other hand, according to the Consumer Sentinel Network, maintained by the Federal Trade Commission (FTC), there was a 23% decrease in identity theft in 2022 from 2021. In 2022, 1,108,609 reports were filed for identity theft, down from 1,434,693 in 2021.

Numerous identity theft protection services aid individuals in preventing and mitigating the repercussions of identity theft. These services offer guidance on safeguarding personal information, monitor public and private records such as credit reports for suspicious activity, and aid victims in resolving identity theft issues. Additionally, government agencies and nonprofit organizations offer similar assistance through websites equipped with tools and information to prevent, address, and report identity theft incidents. Similarly, financial institutions and government agencies utilize fingerprints and other biometric technologies to enhance identity verification and protect individuals from identity theft.

Restraint: Increased adoption of substitute technologies, such as face and iris scanning

The rise in substitute technologies such as facial and iris scanning challenges the dominance of fingerprint recognition, the most popular form of biometric security. While fingerprint recognition is well-established, other biometric parameters like iris/retina, voice, pulse, DNA, and vein offer enhanced security levels. Facial recognition and iris scanning are increasingly favored and may eventually replace fingerprint sensing. Facial recognition systems analyze facial features for identification, making them suitable for remote recognition. Similarly, iris scanning captures unique iris characteristics, which are encrypted for security. Iris scanning, particularly using infrared light, is recognized for its high security standards. For instance, JetBlue is exploring the use of facial recognition technology as an alternative to traditional boarding passes for authentication. Meanwhile, in sectors like banking and finance where security is of utmost importance, institutions such as Bank of America, HSBC, Chase, and Apple's FaceID are leveraging facial recognition technology to verify customers' identities, access mobile banking applications, and execute transactions securely.

Opportunity: Increased adoption of IoT-based biometric technology

The advent of IoT has revolutionized automation systems by connecting smart objects to the internet, facilitating seamless data exchange. However, the increasing number of connected devices heightens the risk of information loss or breaches. Biometrics offers a solution for ensuring secure connections within the IoT network, protecting against fraud and theft. Currently, passwords or PINs safeguard devices and transaction processes, but unsecured connections are vulnerable to malware attacks. Implementing biometric identification systems, such as fingerprint solutions, enhances device security.

Biometric security measures can be integrated at different points in the IoT data pathway, from device authentication using fingerprint sensors to individual identity verification via smartcards. These security measures ensure the smooth flow of data between points while safeguarding data integrity. Continuous technological advancements are expected to further enhance fingerprint technology, given its widespread deployment across various devices.

Challenge: Sensor performance limitations

Sensor performance limitations represent a significant hurdle in the fingerprint sensor market, impacting the broader adoption and effectiveness of this technology across various industries. It can be hampered by various factors, including environmental conditions and user physiology.  For instance, dry, sweaty, or dirty fingers can impede the sensor's ability to capture a clear and accurate fingerprint image.  This can lead to failed recognition attempts, frustration for users, and ultimately, a weakened security posture. Additionally, certain professions or activities can lead to damaged or worn fingerprints, further reducing sensor effectiveness.

Fingerprint Sensor Map/Ecosystem:
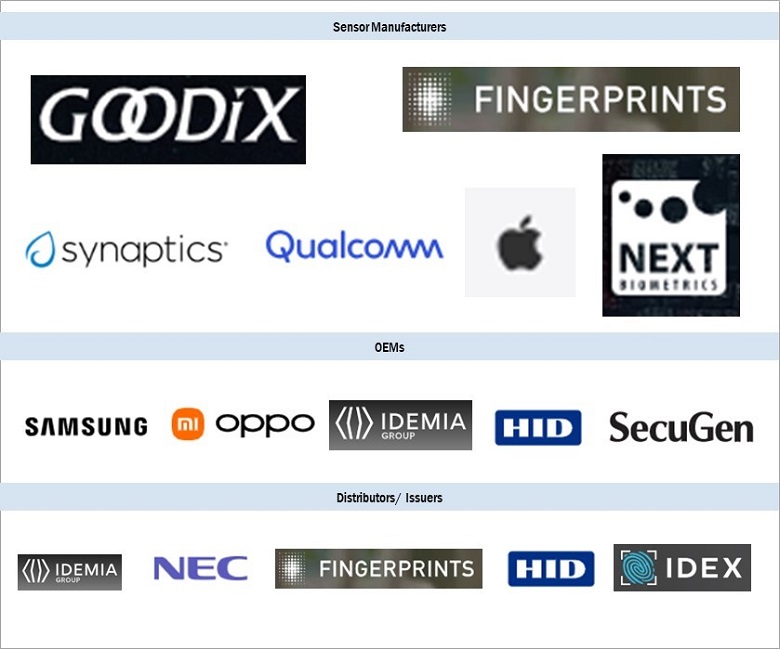
Fingerprint Sensor Market by Ecosystem

Market for area & touch sensor segment is expected to witness higher CAGR during the forecast period.

An area or touch sensor is a type of sensor that simply requires users to press their finger against a designated area, often situated beneath the Home button, as seen in devices like the iPhone. The differentiation between touch and area sensors lies not in technology but in their intended applications. Touch sensors activate upon physical contact with an object or individual and are more sensitive compared to traditional buttons or manual controls.

Market for consumer electronics segment in the end-use application is expected to witness fastest growth in the fingerprint sensor market during the forecast period.

The fingerprint sensor market in consumer electronics is experiencing exponential growth, fueled by increasing demand for secure authentication solutions in smartphones, tablets, laptops, and wearable devices. These sensors are utilized for unlocking devices, authorizing payments, and securing personal data, enhancing user convenience and data security. As consumers become more conscious of privacy and security concerns, the adoption of fingerprint sensors is expected to surge further.

Optical segment in the technology of fingerprint sensor market is expected to hold the second largest market share by 2029.

Optical sensors function by utilizing light and converting it into electrical signals to create fingerprint images. These sensors employ optical lenses, such as charge-coupled devices (CCD) and complementary metal-oxide-semiconductor (CMOS), along with light-emitting diodes (LEDs) for illumination. Using a light-emitting phosphor layer, the technology captures fingerprints through total internal reflection by illuminating the surface. The resulting image is then captured and stored.

Fingerprint sensor market in the Asia Pacific is estimated to grow at the fastest rate during the forecast period.

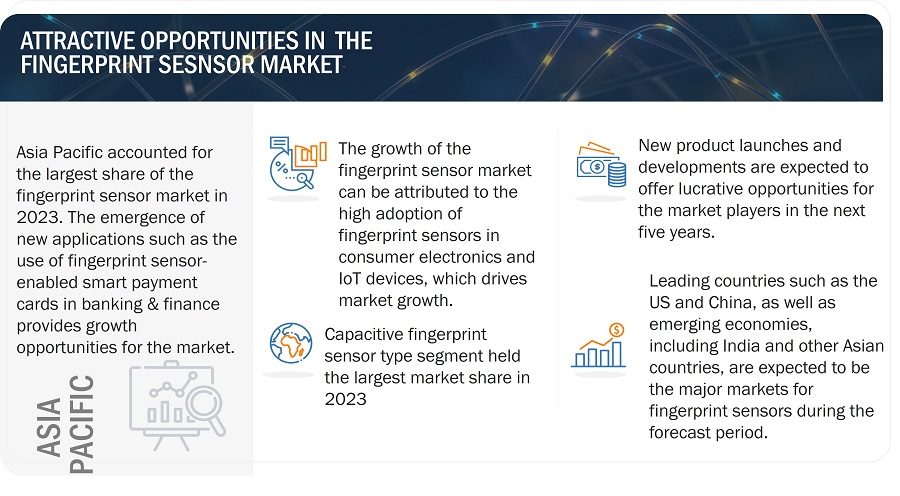
Asia Pacific accounted for the largest share of the overall fingerprint sensor market in terms of value in 2023 and is also expected to witness highest growth during the forecast period. The region's large population is driving the market growth and the increasing demand for secure authentication solutions, causing the market to soar.Fuelled by the widespread adoption of smartphones and the booming digital payments industry in countries like India, China, and Japan, the fingerprint sensor market is primed for unprecedented expansion. In December 2023, the Ministry of Finance, Government of India, announced that the total volume of digital payment transactions in India has surged from USD 252.5 million in 2017-18 to USD 1,643.4 million in 2022-23, registering a remarkable CAGR rate of 45%. The growing digital payment industry is expected to fuel the exponential expansion of the fingerprint sensor market in the region.
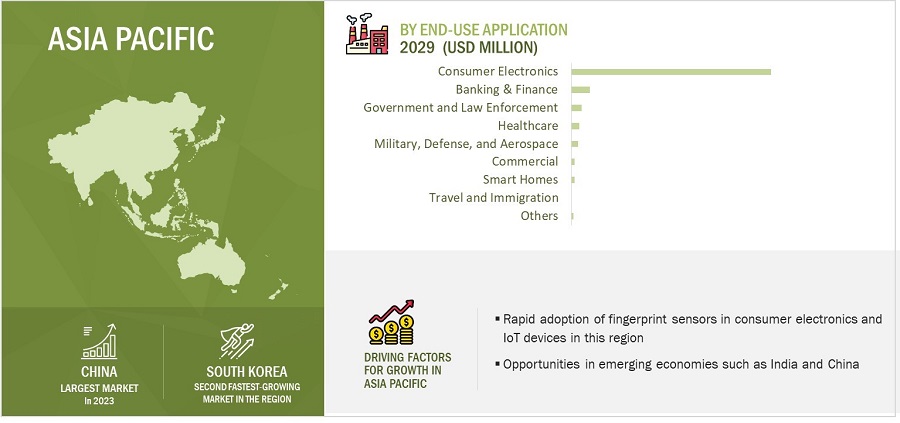
Fingerprint Sensor Market by Region

Fingerprint Sensor Market by Region

To know about the assumptions considered for the study, download the pdf brochure

Key Market Players

Major vendors in the fingerprint sensor companies include Shenzhen Goodix Technology Co., Ltd. (China), Fingerprints (Sweden), Synaptics Incorporated (US), Apple Inc. (US) NEXT Biometrics (Norway), Novatek Microelectronics Corp. (Taiwan), Qualcomm Technologies, Inc. (US) among others.

Get online access to the report on the World's First Market Intelligence Cloud

  • Easy to Download Historical Data & Forecast Numbers
  • Company Analysis Dashboard for high growth potential opportunities
  • Research Analyst Access for customization & queries
  • Competitor Analysis with Interactive dashboard
  • Latest News, Updates & Trend analysis
Request Sample

Scope of the Report

Report Metric

Details

Market size available for years

2020-2029

Base year

2023

Forecast period

2024-2029

Forecast Units

USD Million/USD Billion

Segments Covered

By technology, sensor technology, type, end-use application and Region

Geographic regions covered

North America, Europe, Asia Pacific, and RoW

Companies covered

Shenzhen Goodix Technology Co., Ltd. (China), Fingerprints (Sweden), Synaptics Incorporated (US), Apple Inc. (US), Egis Technology Inc (Taiwan), CrucialTec (South Korea), NEXT Biometrics (Norway), Novatek Microelectronics Corp. (Taiwan), Qualcomm Technologies, Inc. (US), Q Technology (China), Vicharak (India), Invixium (Canada), M2SYS Technology (US), Parallax Inc. (US), Mantra Softech India Pvt Ltd. (India), CMOS Sensor Inc. (US), ELAN Microelectronics Corp. (Taiwan), FocalTech Systems Co., Ltd. (China), ID3 Technologies (France), IDEX Biometrics (Norway), Japan Display Inc. (Japan), QXi Technology (China), Sonavation Inc. (US), Touch Biometrix (UK), and VKANSEE (US).

Fingerprint Sensor Market Highlights

This research report categorizes the fingerprint sensor market based on technology, sensor technology, type, end-use application and Region.

Segment

Subsegment

By Technology

  • Capacitive
  • Optical
  • Thermal
  • Ultrasonic

By Sensor Technology

  • 2D
  • 3D

By Type

  • Area & Touch Sensor
  • Swipe Sensor

By End-Use Application

  • Consumer Electronics
  • Travel and Immigration
  • Government and Law Enforcement
  • Banking and Finance
  • Commercial
  • Smart Homes
  • Healthcare
  • Military, Defense, and Aerospace
  • Others

By Region:

  • North America
    • US
    • Canada
    • Mexico
  • Europe
    • Germany
    • UK
    • France
    • Italy
    • Rest of Europe
  • Asia Pacific
    • China
    • Japan
    • India
    • South Korea
    • Rest of Asia Pacific
  • Rest of the world
    • GCC
    • Rest of Middle East
    • Africa
    • South America

Recent Developments

  • In March 2023, Shenzhen Goodix Technology Co., Ltd. (China) launched an ultra-narrow side key capacitive fingerprint sensor, integrated with an OLED touch controller and light sensor, power up the Lenovo Tab. This innovative combination enhances security and usability, ensuring a seamless user experience.
  • In October 2023, Fingerprints (Sweden) partnered with Ansal Component (Turkey), a leading provider of component supply services. This collaboration streamlines the region's efforts in developing secure devices incorporating cutting-edge fingerprint sensors and software technologies.
  • In May 2023, Synaptics Incorporated. (US) partnered with Boréas Technologies (Canada) and integrated its S9A0H NIST SP800-193 firmware qualified touch controller with Boréas Technologies piezo haptics technology. This collaboration yields a high-performance trackpad module offering OEMs force sensing and top-tier haptic feedback, facilitating thin and lightweight trackpads with consistent click sensations across the entire active surface.

Critical questions answered by this report:

To speak to our analyst for a discussion on the above findings, click Speak to Analyst

TABLE OF CONTENTS
 
1 INTRODUCTION (Page No. - 40)
    1.1 STUDY OBJECTIVES 
    1.2 MARKET DEFINITION 
    1.3 STUDY SCOPE 
           1.3.1 MARKETS COVERED
           FIGURE 1 FINGERPRINT SENSOR: MARKET SEGMENTATION
           1.3.2 REGIONAL SCOPE
           1.3.3 YEARS CONSIDERED
           1.3.4 INCLUSIONS AND EXCLUSIONS
    1.4 CURRENCY CONSIDERED 
    1.5 UNITS CONSIDERED 
    1.6 LIMITATIONS 
    1.7 STAKEHOLDERS 
    1.8 SUMMARY OF CHANGES 
    1.9 RECESSION IMPACT 
 
2 RESEARCH METHODOLOGY (Page No. - 45)
    2.1 RESEARCH APPROACH 
           FIGURE 2 FINGERPRINT SENSOR MARKET: RESEARCH DESIGN
           2.1.1 SECONDARY DATA
                    2.1.1.1 List of major secondary sources
                    2.1.1.2 Key data from secondary sources
           2.1.2 PRIMARY DATA
                    2.1.2.1 List of key interview participants
                    2.1.2.2 Breakdown of primary interviews
                    2.1.2.3 Key data from primary sources
                    2.1.2.4 Key industry insights
           2.1.3 SECONDARY AND PRIMARY RESEARCH
    2.2 MARKET SIZE ESTIMATION 
           FIGURE 3 RESEARCH FLOW OF MARKET SIZE ESTIMATION
           2.2.1 BOTTOM-UP APPROACH
                    2.2.1.1 Approach to estimate market size using bottom-up analysis (demand side)
           FIGURE 4 FINGERPRINT SENSOR MARKET: BOTTOM-UP APPROACH
           2.2.2 TOP-DOWN APPROACH
                    2.2.2.1 Approach to estimate market size using top-down analysis (supply side)
           FIGURE 5 FINGERPRINT SENSOR MARKET: TOP-DOWN APPROACH
           FIGURE 6 MARKET SIZE ESTIMATION METHODOLOGY (SUPPLY-SIDE): REVENUE GENERATED BY FINGERPRINT SENSOR MANUFACTURERS
    2.3 DATA TRIANGULATION 
           FIGURE 7 FINGERPRINT SENSOR MARKET: DATA TRIANGULATION
    2.4 RESEARCH ASSUMPTIONS 
    2.5 PARAMETERS CONSIDERED TO ANALYZE IMPACT OF RECESSION ON STUDIED MARKET 
           TABLE 1 ASSUMPTIONS: RECESSION
    2.6 RISK ASSESSMENT 
           TABLE 2 RISK ASSESSMENT: FINGERPRINT SENSOR MARKET
    2.7 RESEARCH LIMITATIONS 
 
3 EXECUTIVE SUMMARY (Page No. - 56)
           FIGURE 8 CAPACITIVE TECHNOLOGY-ENABLED FINGERPRINT SENSORS TO ACCOUNT FOR LARGEST MARKET SHARE DURING FORECAST PERIOD
           FIGURE 9 2D SENSORS TO HOLD LARGER MARKET SHARE DURING FORECAST PERIOD
           FIGURE 10 AREA & TOUCH SENSORS TO CAPTURE LARGER MARKET SHARE DURING FORECAST PERIOD
           FIGURE 11 CONSUMER ELECTRONICS TO ACCOUNT FOR LARGEST SHARE OF FINGERPRINT SENSOR MARKET, BY END-USE APPLICATION, DURING FORECAST PERIOD
           FIGURE 12 ASIA PACIFIC DOMINATED GLOBAL FINGERPRINT SENSOR MARKET IN 2023
 
4 PREMIUM INSIGHTS (Page No. - 60)
    4.1 ATTRACTIVE OPPORTUNITIES FOR PLAYERS IN FINGERPRINT SENSOR MARKET 
           FIGURE 13 GROWING ADOPTION OF FINGERPRINT SENSORS IN CONSUMER ELECTRONICS TO BOOST MARKET GROWTH DURING FORECAST PERIOD
    4.2 FINGERPRINT SENSOR MARKET, BY TECHNOLOGY 
           FIGURE 14 ULTRASONIC TECHNOLOGY TO REGISTER HIGHEST CAGR DURING FORECAST PERIOD
    4.3 FINGERPRINT SENSOR MARKET, BY TYPE AND SENSOR TECHNOLOGY 
           FIGURE 15 AREA & TOUCH SENSORS AND 2D SEGMENTS TO HOLD LARGER MARKET SHARES IN 2024
    4.4 FINGERPRINT SENSOR MARKET, BY END-USE APPLICATION 
           FIGURE 16 BANKING & FINANCE SEGMENT TO RECORD HIGHEST CAGR DURING FORECAST PERIOD
    4.5 FINGERPRINT SENSOR MARKET, BY REGION 
           FIGURE 17 ASIA PACIFIC TO WITNESS HIGHEST CAGR DURING FORECAST PERIOD
    4.6 FINGERPRINT SENSOR MARKET, BY COUNTRY 
           FIGURE 18 CHINA TO REGISTER HIGHEST CAGR IN GLOBAL MARKET FROM 2024 TO 2029
 
5 MARKET OVERVIEW (Page No. - 63)
    5.1 INTRODUCTION 
    5.2 MARKET DYNAMICS 
           FIGURE 19 FINGERPRINT SENSOR MARKET: DRIVERS, RESTRAINTS, OPPORTUNITIES, AND CHALLENGES
           5.2.1 DRIVERS
                    5.2.1.1 Extensive use of fingerprint sensors in consumer electronic devices for biometric authentication
                    5.2.1.2 High adoption of biometrics in law enforcement and government applications for enhanced security
                    5.2.1.3 Increasing deployment of fingerprint sensor technology in employee time and attendance systems
                    5.2.1.4 Surging demand for advanced fingerprint technology due to increasing number of identity theft and fraud cases
                    5.2.1.5 Growing preference for mobile payments and online transactions
                               FIGURE 20 DRIVERS AND THEIR IMPACT ON FINGERPRINT SENSOR MARKET
           5.2.2 RESTRAINTS
                    5.2.2.1 Security threats pertaining to biometric data
                    5.2.2.2 Availability of substitute technologies such as face and iris recognition
                               FIGURE 21 RESTRAINTS AND THEIR IMPACT ON FINGERPRINT SENSOR MARKET
           5.2.3 OPPORTUNITIES
                    5.2.3.1 Emergence of biometric smart cards for banking, financial services, and insurance applications
                    5.2.3.2 Integration of IoT into biometric solutions
                    5.2.3.3 Increasing adoption of biometrics in automotive industry
                    5.2.3.4 Advancements in 3D fingerprint technology
                               FIGURE 22 OPPORTUNITIES AND THEIR IMPACT ON FINGERPRINT SENSOR MARKET
           5.2.4 CHALLENGES
                    5.2.4.1 Performance limitations of fingerprint sensors
                               FIGURE 23 CHALLENGES AND THEIR IMPACT ON FINGERPRINT SENSOR MARKET
    5.3 TRENDS/DISRUPTIONS IMPACTING CUSTOMER BUSINESS 
           FIGURE 24 TRENDS AND DISRUPTIONS IN FINGERPRINT SENSOR MARKET
    5.4 PRICING ANALYSIS 
           5.4.1 AVERAGE SELLING PRICE TREND OF KEY PLAYERS, BY TECHNOLOGY
                    FIGURE 25 AVERAGE SELLING PRICE TREND OF TOP THREE TECHNOLOGIES OFFERED BY KEY PLAYERS
                    TABLE 3 AVERAGE SELLING PRICE TREND OF FINGERPRINT SENSORS OFFERED BY KEY PLAYERS, BY TECHNOLOGY (USD)
           5.4.2 AVERAGE SELLING PRICE TREND OF KEY PLAYERS, BY REGION
                    FIGURE 26 AVERAGE SELLING PRICE TREND OF CAPACITIVE SENSORS, BY REGION, (2020–2023)
                    TABLE 4 AVERAGE SELLING PRICE TREND OF CAPACITIVE SENSORS, BY REGION, 2020–2023 (USD)
                    FIGURE 27 AVERAGE SELLING PRICE TREND OF OPTICAL SENSORS, BY REGION, (2020–2023)
                    TABLE 5 AVERAGE SELLING PRICE TREND OF OPTICAL SENSORS, BY REGION, 2020–2023 (USD)
                    FIGURE 28 AVERAGE SELLING PRICE TREND OF ULTRASONIC SENSORS, BY REGION, (2020–2023)
                    TABLE 6 AVERAGE SELLING PRICE TREND OF ULTRASONIC SENSORS, BY REGION, 2020–2023 (USD)
    5.5 VALUE CHAIN ANALYSIS 
           FIGURE 29 GLOBAL FINGERPRINT SENSOR MARKET: VALUE CHAIN ANALYSIS
    5.6 ECOSYSTEM ANALYSIS 
           FIGURE 30 FINGERPRINT SENSOR ECOSYSTEM
           TABLE 7 ROLE OF COMPANIES IN FINGERPRINT SENSOR ECOSYSTEM
    5.7 INVESTMENT AND FUNDING SCENARIO 
           FIGURE 31 INVESTMENT IN SMART SENSOR TECHNOLOGY, BY CHINA, 2018–2022
    5.8 TECHNOLOGY ANALYSIS 
           5.8.1 KEY TECHNOLOGIES
                    5.8.1.1 Ultrasonic fingerprint sensing
                    5.8.1.2 Capacitive fingerprint sensing
           5.8.2 COMPLEMENTARY TECHNOLOGIES
                    5.8.2.1 Biometric fusion
                    5.8.2.2 Liveness detection
           5.8.3 ADJACENT TECHNOLOGIES
                    5.8.3.1 On-device machine learning
    5.9 PATENT ANALYSIS 
           FIGURE 32 NUMBER OF PATENTS GRANTED PER YEAR FROM 2013 TO 2023
           FIGURE 33 TOP 10 COMPANIES WITH HIGH NUMBER OF PATENT APPLICATIONS IN LAST 10 YEARS
           TABLE 8 TOP PATENT OWNERS IN LAST 10 YEARS
           TABLE 9 MAJOR PATENT REGISTRATIONS, 2023
    5.10 TRADE ANALYSIS 
           5.10.1 IMPORT DATA (HS CODE 847160)
           FIGURE 34 IMPORT DATA FOR HS CODE 847160-COMPLIANT PRODUCTS, BY COUNTRY, 2019–2022
           5.10.2 EXPORT DATA (HS CODE 847160)
           FIGURE 35 EXPORT DATA FOR HS CODE 847160-COMPLIANT PRODUCTS, BY COUNTRY, 2019–2022
    5.11 KEY CONFERENCES AND EVENTS, 2024–2025 
           TABLE 10 FINGERPRINT SENSOR MARKET: LIST OF CONFERENCES AND EVENTS, 2024–2025
    5.12 CASE STUDY ANALYSIS 
           5.12.1 GOODIX’S FINGERPRINT AND AUDIO SOLUTIONS FUEL ENGINE OF REALME GT 5G FOR NEXT-GEN FLAGSHIP PERFORMANCE
           5.12.2 ENSURITY FIDO2 SECURITY KEY EMBEDS FINGERPRINTS’ BIOMETRICS FOR PASSWORDLESS AUTHENTICATION
           5.12.3 EGIS SUPPLIES FINGERPRINT SENSORS TO HYUNDAI TO UNLOCK VEHICLES WITHOUT PASSWORD AND ACTIVATE PERSONAL SETTINGS
           5.12.4 NEC CORPORATION’S AFIS CREATES FINGERPRINT IDENTIFICATION DATABASE FOR HANIS PROJECT LED BY DEPARTMENT OF HOME AFFAIRS (SOUTH AFRICA)
           5.12.5 ARATEK’S A800 FINGERPRINT SCANNERS SUPPORT LIBERIA’S 2023 ELECTION BY OFFERING ENHANCED DATA QUALITY, SECURITY, AND EFFICIENT VOTER REGISTRATION
    5.13 REGULATORY LANDSCAPE 
           5.13.1 REGULATORY BODIES, GOVERNMENT AGENCIES, AND OTHER ORGANIZATIONS
                    TABLE 11 NORTH AMERICA: LIST OF REGULATORY BODIES, GOVERNMENT AGENCIES, AND OTHER ORGANIZATIONS
                    TABLE 12 EUROPE: LIST OF REGULATORY BODIES, GOVERNMENT AGENCIES, AND OTHER ORGANIZATIONS
                    TABLE 13 ASIA PACIFIC: LIST OF REGULATORY BODIES, GOVERNMENT AGENCIES, AND OTHER ORGANIZATIONS
                    TABLE 14 ROW: LIST OF REGULATORY BODIES, GOVERNMENT AGENCIES, AND OTHER ORGANIZATIONS
           5.13.2 STANDARDS AND REGULATORY POLICIES
                    5.13.2.1 National Institute of Standards and Technology (NIST) standards
                    5.13.2.2 FBI Criminal Justice Information Services (CJIS) Security Policy
                    5.13.2.3 ISO/IEC 19794
                    5.13.2.4 ISO/IEC 24745
                    5.13.2.5 ISO/IEC 17839
                    5.13.2.6 CE marking
                    5.13.2.7 FAP 10
                    5.13.2.8 FAP 20
                    5.13.2.9 FAP 30
                    5.13.2.10 Others
           5.13.3 REGULATIONS, BY REGION/COUNTRY
                    5.13.3.1 US
                    5.13.3.2 Europe
                    5.13.3.3 China
                    5.13.3.4 Japan
    5.14 PORTER’S FIVE FORCES ANALYSIS 
           TABLE 15 FINGERPRINT SENSOR MARKET: PORTER’S FIVE FORCES ANALYSIS
           FIGURE 36 FINGERPRINT SENSOR MARKET: PORTER’S FIVE FORCES ANALYSIS
           5.14.1 INTENSITY OF COMPETITIVE RIVALRY
           5.14.2 BARGAINING POWER OF SUPPLIERS
           5.14.3 BARGAINING POWER OF BUYERS
           5.14.4 THREAT OF SUBSTITUTES
           5.14.5 THREAT OF NEW ENTRANTS
    5.15 KEY STAKEHOLDERS AND BUYING CRITERIA 
           5.15.1 KEY STAKEHOLDERS IN BUYING PROCESS
                    FIGURE 37 INFLUENCE OF STAKEHOLDERS ON BUYING PROCESS FOR TOP FOUR END-USE APPLICATIONS
                    TABLE 16 INFLUENCE OF STAKEHOLDERS ON BUYING PROCESS FOR TOP FOUR END-USE APPLICATIONS (%)
           5.15.2 BUYING CRITERIA
                    FIGURE 38 KEY BUYING CRITERIA FOR TOP FOUR END-USE APPLICATIONS
                    TABLE 17 KEY BUYING CRITERIA FOR TOP FOUR END-USE APPLICATIONS
 
6 DIFFERENT MATERIALS USED IN FINGERPRINT SENSORS (Page No. - 96)
    6.1 INTRODUCTION 
    6.2 PIEZOELECTRIC MATERIALS (QUARTZ) 
    6.3 PYROELECTRIC MATERIALS (LITHIUM TANTALATE) 
    6.4 ADHESIVES 
    6.5 COATING MATERIALS 
 
7 PRODUCTS INTEGRATED WITH FINGERPRINT SENSORS (Page No. - 98)
    7.1 INTRODUCTION 
    7.2 AUTHENTICATION SYSTEMS IN SMART DEVICES AND WEARABLES 
    7.3 ATTENDANCE RECORDING SYSTEMS 
    7.4 ACCESS CONTROL SYSTEMS 
           7.4.1 BIOMETRICS SYSTEMS
           7.4.2 DIGITAL LOCKS
    7.5 BIOMETRIC SMART CARDS 
           7.5.1 FINANCIAL CARDS
           7.5.2 ID CARDS
    7.6 VEHICLES 
    7.7 OTHERS 
 
8 FINGERPRINT SENSOR MARKET, BY SENSOR TECHNOLOGY (Page No. - 101)
    8.1 INTRODUCTION 
           FIGURE 39 2D SEGMENT TO HOLD LARGER MARKET SHARE DURING FORECAST PERIOD
           TABLE 18 FINGERPRINT SENSOR MARKET, BY SENSOR TECHNOLOGY, 2020–2023 (USD MILLION)
           TABLE 19 FINGERPRINT SENSOR MARKET, BY SENSOR TECHNOLOGY, 2024–2029 (USD MILLION)
    8.2 2D 
           8.2.1 LOW COST OF 2D SENSORS TO FUEL SEGMENTAL GROWTH
    8.3 3D 
           8.3.1 RISING FOCUS ON IMPROVING SECURITY OF ELECTRONIC DEVICES TO BOOST DEMAND
 
9 FINGERPRINT SENSOR MARKET, BY TYPE (Page No. - 104)
    9.1 INTRODUCTION 
           FIGURE 40 AREA & TOUCH SENSORS SEGMENT TO HOLD LARGER MARKET SHARE DURING FORECAST PERIOD
           TABLE 20 FINGERPRINT SENSOR MARKET, BY TYPE, 2020–2023 (USD MILLION)
           TABLE 21 FINGERPRINT SENSOR MARKET, BY TYPE, 2024–2029 (USD MILLION)
    9.2 AREA & TOUCH SENSORS 
           9.2.1 TECHNOLOGICAL ADVANCES IN TOUCH SENSORS TO BOOST DEMAND FOR AREA & TOUCH FINGERPRINT SENSORS
    9.3 SWIPE SENSORS 
           9.3.1 NEED TO ENSURE SECURITY OF ELECTRONIC DEVICES TO FOSTER SEGMENTAL GROWTH
 
10 FINGERPRINT SENSOR MARKET, BY TECHNOLOGY (Page No. - 108)
     10.1 INTRODUCTION 
             FIGURE 41 CAPACITIVE SEGMENT TO HOLD LARGEST MARKET SHARE DURING FORECAST PERIOD
             TABLE 22 FINGERPRINT SENSOR MARKET, BY TECHNOLOGY, 2020–2023 (USD MILLION)
             TABLE 23 FINGERPRINT SENSOR MARKET, BY TECHNOLOGY, 2024–2029 (USD MILLION)
     10.2 CAPACITIVE 
             10.2.1 COST-EFFECTIVENESS AND EASE OF INTEGRATION OF CAPACITIVE FINGERPRINT SENSORS IN MOBILE DEVICES TO FUEL MARKET GROWTH
                        TABLE 24 CAPACITIVE FINGERPRINT SENSOR MARKET, BY END-USE APPLICATION, 2020–2023 (USD MILLION)
                        TABLE 25 CAPACITIVE FINGERPRINT SENSOR MARKET, BY END-USE APPLICATION, 2024–2029 (USD MILLION)
                        TABLE 26 CAPACITIVE FINGERPRINT SENSOR MARKET, BY REGION, 2020–2023 (USD MILLION)
                        TABLE 27 CAPACITIVE FINGERPRINT SENSOR MARKET, BY REGION, 2024–2029 (USD MILLION)
     10.3 OPTICAL 
             10.3.1 RISE IN ADOPTION OF OPTICAL IN-DISPLAY FINGERPRINT SENSORS BY SMARTPHONE MANUFACTURERS TO PROPEL MARKET
                        TABLE 28 OPTICAL FINGERPRINT SENSOR MARKET, BY END-USE APPLICATION, 2020–2023 (USD MILLION)
                        TABLE 29 OPTICAL FINGERPRINT SENSOR MARKET, BY END-USE APPLICATION, 2024–2029 (USD MILLION)
                        TABLE 30 OPTICAL FINGERPRINT SENSOR MARKET, BY REGION, 2020–2023 (USD MILLION)
                        TABLE 31 OPTICAL FINGERPRINT SENSOR MARKET, BY REGION, 2024–2029 (USD MILLION)
     10.4 THERMAL 
             10.4.1 USE OF SENSORS IN BIOMETRIC SMART CARDS TO CREATE GROWTH OPPORTUNITIES FOR THERMAL SENSOR MARKET
                        TABLE 32 THERMAL FINGERPRINT SENSOR MARKET, BY END-USE APPLICATION, 2020–2023 (USD MILLION)
                        TABLE 33 THERMAL FINGERPRINT SENSOR MARKET, BY END-USE APPLICATION, 2024–2029 (USD MILLION)
                        TABLE 34 THERMAL FINGERPRINT SENSOR MARKET, BY REGION, 2020–2023 (USD MILLION)
                        TABLE 35 THERMAL FINGERPRINT SENSOR MARKET, BY REGION, 2024–2029 (USD MILLION)
     10.5 ULTRASONIC 
             10.5.1 ABILITY OF ULTRASONIC SENSORS TO CAPTURE FINE DETAILS TO DRIVE MARKET
                        TABLE 36 ULTRASONIC FINGERPRINT SENSOR MARKET, BY END-USE APPLICATION, 2020–2023 (USD MILLION)
                        TABLE 37 ULTRASONIC FINGERPRINT SENSOR MARKET, BY END-USE APPLICATION, 2024–2029 (USD MILLION)
                        TABLE 38 ULTRASONIC FINGERPRINT SENSOR MARKET, BY REGION, 2020–2023 (USD MILLION)
                        TABLE 39 ULTRASONIC FINGERPRINT SENSOR MARKET, BY REGION, 2024–2029 (USD MILLION)
 
11 FINGERPRINT SENSOR MARKET, BY END-USE APPLICATION (Page No. - 118)
     11.1 INTRODUCTION 
             FIGURE 42 CONSUMER ELECTRONICS SEGMENT TO HOLD LARGEST MARKET SHARE DURING FORECAST PERIOD
             TABLE 40 FINGERPRINT SENSOR MARKET, BY END-USE APPLICATION, 2020–2023 (USD MILLION)
             TABLE 41 FINGERPRINT SENSOR MARKET, BY END-USE APPLICATION, 2024–2029 (USD MILLION)
             TABLE 42 FINGERPRINT SENSOR MARKET, BY END-USE APPLICATION, 2020–2023 (MILLION UNITS)
             TABLE 43 FINGERPRINT SENSOR MARKET, BY END-USE APPLICATION, 2024–2029 (MILLION UNITS)
     11.2 CONSUMER ELECTRONICS 
             11.2.1 SMARTPHONES
                        11.2.1.1 Increasing popularity of fingerprint authentication in smartphones to fuel segmental growth
             11.2.2 LAPTOPS & PERSONAL COMPUTERS
                        11.2.2.1 Rising use of fingerprint technology in laptops to ensure security to boost market
             11.2.3 TABLETS
                        11.2.3.1 Surging demand for tablets with growing trend of remote work and e-learning to contribute to segmental growth
             11.2.4 WEARABLE DEVICES
                        11.2.4.1 Growing efforts of leading OEMs to offer wearables with dynamic features to create opportunities for fingerprint sensor providers
             11.2.5 OTHER CONSUMER ELECTRONICS
                        TABLE 44 FINGERPRINT SENSOR MARKET FOR CONSUMER ELECTRONICS, BY TECHNOLOGY, 2020–2023 (USD MILLION)
                        TABLE 45 FINGERPRINT SENSOR MARKET FOR CONSUMER ELECTRONICS, BY TECHNOLOGY, 2024–2029 (USD MILLION)
                        TABLE 46 CAPACITIVE FINGERPRINT SENSOR MARKET FOR CONSUMER ELECTRONICS, BY REGION, 2020–2023 (USD MILLION)
                        TABLE 47 CAPACITIVE FINGERPRINT SENSOR MARKET FOR CONSUMER ELECTRONICS, BY REGION, 2024–2029 (USD MILLION)
                        TABLE 48 OPTICAL FINGERPRINT SENSOR MARKET FOR CONSUMER ELECTRONICS, BY REGION, 2020–2023 (USD MILLION)
                        TABLE 49 OPTICAL FINGERPRINT SENSOR MARKET FOR CONSUMER ELECTRONICS, BY REGION, 2024–2029 (USD MILLION)
                        TABLE 50 THERMAL FINGERPRINT SENSOR MARKET FOR CONSUMER ELECTRONICS, BY REGION, 2020–2023 (USD MILLION)
                        TABLE 51 THERMAL FINGERPRINT SENSOR MARKET FOR CONSUMER ELECTRONICS, BY REGION, 2024–2029 (USD MILLION)
                        TABLE 52 ULTRASONIC FINGERPRINT SENSOR MARKET FOR CONSUMER ELECTRONICS, BY REGION, 2020–2023 (USD MILLION)
                        TABLE 53 ULTRASONIC FINGERPRINT SENSOR MARKET FOR CONSUMER ELECTRONICS, BY REGION, 2024–2029 (USD MILLION)
                        TABLE 54 FINGERPRINT SENSOR MARKET FOR CONSUMER ELECTRONICS, BY REGION, 2020–2023 (USD MILLION)
                        TABLE 55 FINGERPRINT SENSOR MARKET FOR CONSUMER ELECTRONICS, BY REGION, 2024–2029 (USD MILLION)
     11.3 TRAVEL & IMMIGRATION 
             11.3.1 SURGING DEPLOYMENT OF BIOMETRIC SYSTEMS AT AIRPORTS TO AUGMENT DEMAND FOR FINGERPRINT SENSORS
                        TABLE 56 FINGERPRINT SENSOR MARKET FOR TRAVEL & IMMIGRATION, BY TECHNOLOGY, 2020–2023 (USD MILLION)
                        TABLE 57 FINGERPRINT SENSOR MARKET FOR TRAVEL & IMMIGRATION, BY TECHNOLOGY, 2024–2029 (USD MILLION)
                        TABLE 58 CAPACITIVE FINGERPRINT SENSOR MARKET FOR TRAVEL & IMMIGRATION, BY REGION, 2020–2023 (USD MILLION)
                        TABLE 59 CAPACITIVE FINGERPRINT SENSOR MARKET FOR TRAVEL & IMMIGRATION, BY REGION, 2024–2029 (USD MILLION)
                        TABLE 60 OPTICAL FINGERPRINT SENSOR MARKET FOR TRAVEL & IMMIGRATION, BY REGION, 2020–2023 (USD MILLION)
                        TABLE 61 OPTICAL FINGERPRINT SENSOR MARKET FOR TRAVEL & IMMIGRATION, BY REGION, 2024–2029 (USD MILLION)
                        TABLE 62 THERMAL FINGERPRINT SENSOR MARKET FOR TRAVEL & IMMIGRATION, BY REGION, 2020–2023 (USD MILLION)
                        TABLE 63 THERMAL FINGERPRINT SENSOR MARKET FOR TRAVEL & IMMIGRATION, BY REGION, 2024–2029 (USD MILLION)
                        TABLE 64 ULTRASONIC FINGERPRINT SENSOR MARKET FOR TRAVEL & IMMIGRATION, BY REGION, 2020–2023 (USD MILLION)
                        TABLE 65 ULTRASONIC FINGERPRINT SENSOR MARKET FOR TRAVEL & IMMIGRATION, BY REGION, 2024–2029 (USD MILLION)
                        TABLE 66 FINGERPRINT SENSOR MARKET FOR TRAVEL & IMMIGRATION, BY REGION, 2020–2023 (USD MILLION)
                        TABLE 67 FINGERPRINT SENSOR MARKET FOR TRAVEL & IMMIGRATION, BY REGION, 2024–2029 (USD MILLION)
     11.4 GOVERNMENT & LAW ENFORCEMENT 
             11.4.1 GOVERNMENT INITIATIVES TO PROVIDE DIGITAL IDENTITY TO CITIZENS TO SUPPORT MARKET GROWTH
                        TABLE 68 FINGERPRINT SENSOR MARKET FOR GOVERNMENT & LAW ENFORCEMENT, BY TECHNOLOGY, 2020–2023 (USD MILLION)
                        TABLE 69 FINGERPRINT SENSOR MARKET FOR GOVERNMENT & LAW ENFORCEMENT, BY TECHNOLOGY, 2024–2029 (USD MILLION)
                        TABLE 70 CAPACITIVE FINGERPRINT SENSOR MARKET FOR GOVERNMENT & LAW ENFORCEMENT, BY REGION, 2020–2023 (USD MILLION)
                        TABLE 71 CAPACITIVE FINGERPRINT SENSOR MARKET FOR GOVERNMENT & LAW ENFORCEMENT, BY REGION, 2024–2029 (USD MILLION)
                        TABLE 72 OPTICAL FINGERPRINT SENSOR MARKET FOR GOVERNMENT & LAW ENFORCEMENT, BY REGION, 2020–2023 (USD MILLION)
                        TABLE 73 OPTICAL FINGERPRINT SENSOR MARKET FOR GOVERNMENT & LAW ENFORCEMENT, BY REGION, 2024–2029 (USD MILLION)
                        TABLE 74 THERMAL FINGERPRINT SENSOR MARKET FOR GOVERNMENT & LAW ENFORCEMENT, BY REGION, 2020–2023 (USD MILLION)
                        TABLE 75 THERMAL FINGERPRINT SENSOR MARKET FOR GOVERNMENT & LAW ENFORCEMENT, BY REGION, 2024–2029 (USD MILLION)
                        TABLE 76 ULTRASONIC FINGERPRINT SENSOR MARKET FOR GOVERNMENT & LAW ENFORCEMENT, BY REGION, 2020–2023 (USD MILLION)
                        TABLE 77 ULTRASONIC FINGERPRINT SENSOR MARKET FOR GOVERNMENT & LAW ENFORCEMENT, BY REGION, 2024–2029 (USD MILLION)
                        TABLE 78 FINGERPRINT SENSOR MARKET FOR GOVERNMENT & LAW ENFORCEMENT, BY REGION, 2020–2023 (USD MILLION)
                        TABLE 79 FINGERPRINT SENSOR MARKET FOR GOVERNMENT & LAW ENFORCEMENT, BY REGION, 2024–2029 (USD MILLION)
     11.5 MILITARY, DEFENSE, AND AEROSPACE 
             11.5.1 INCREASING NEED FOR ROBUST ACCESS CONTROL SYSTEMS TO BOOST DEMAND FOR FINGERPRINT SENSORS
                        TABLE 80 FINGERPRINT SENSOR MARKET FOR MILITARY, DEFENSE, AND AEROSPACE, BY TECHNOLOGY, 2020–2023 (USD MILLION)
                        TABLE 81 FINGERPRINT SENSOR MARKET FOR MILITARY, DEFENSE, AND AEROSPACE, BY TECHNOLOGY, 2024–2029 (USD MILLION)
                        TABLE 82 CAPACITIVE FINGERPRINT SENSOR MARKET FOR MILITARY, DEFENSE, AND AEROSPACE, BY REGION, 2020–2023 (USD MILLION)
                        TABLE 83 CAPACITIVE FINGERPRINT SENSOR MARKET FOR MILITARY, DEFENSE, AND AEROSPACE, BY REGION, 2024–2029 (USD MILLION)
                        TABLE 84 OPTICAL FINGERPRINT SENSOR MARKET FOR MILITARY, DEFENSE, AND AEROSPACE, BY REGION, 2020–2023 (USD MILLION)
                        TABLE 85 OPTICAL FINGERPRINT SENSOR MARKET FOR MILITARY, DEFENSE, AND AEROSPACE, BY REGION, 2024–2029 (USD MILLION)
                        TABLE 86 THERMAL FINGERPRINT SENSOR MARKET FOR MILITARY, DEFENSE, AND AEROSPACE, BY REGION, 2020–2023 (USD MILLION)
                        TABLE 87 THERMAL FINGERPRINT SENSOR MARKET FOR MILITARY, DEFENSE, AND AEROSPACE, BY REGION, 2024–2029 (USD MILLION)
                        TABLE 88 ULTRASONIC FINGERPRINT SENSOR MARKET FOR MILITARY, DEFENSE, AND AEROSPACE, BY REGION, 2020–2023 (USD MILLION)
                        TABLE 89 ULTRASONIC FINGERPRINT SENSOR MARKET FOR MILITARY, DEFENSE, AND AEROSPACE, BY REGION, 2024–2029 (USD MILLION)
                        TABLE 90 FINGERPRINT SENSOR MARKET FOR MILITARY, DEFENSE, AND AEROSPACE, BY REGION, 2020–2023 (USD MILLION)
                        TABLE 91 FINGERPRINT SENSOR MARKET FOR MILITARY, DEFENSE, AND AEROSPACE, BY REGION, 2024–2029 (USD MILLION)
     11.6 BANKING & FINANCE 
             11.6.1 ADOPTION OF FINGERPRINT SCANNERS AS ALTERNATIVES TO PIN-TO-AUTHENTICATE PAYMENT CARDS TO BOOST SEGMENTAL GROWTH
                        TABLE 92 FINGERPRINT SENSOR MARKET FOR BANKING & FINANCE, BY TECHNOLOGY, 2020–2023 (USD MILLION)
                        TABLE 93 FINGERPRINT SENSOR MARKET FOR BANKING & FINANCE, BY TECHNOLOGY, 2024–2029 (USD MILLION)
                        TABLE 94 CAPACITIVE FINGERPRINT SENSOR MARKET FOR BANKING & FINANCE, BY REGION, 2020–2023 (USD MILLION)
                        TABLE 95 CAPACITIVE FINGERPRINT SENSOR MARKET FOR BANKING & FINANCE, BY REGION, 2024–2029 (USD MILLION)
                        TABLE 96 OPTICAL FINGERPRINT SENSOR MARKET FOR BANKING & FINANCE, BY REGION, 2020–2023 (USD MILLION)
                        TABLE 97 OPTICAL FINGERPRINT SENSOR MARKET FOR BANKING & FINANCE, BY REGION, 2024–2029 (USD MILLION)
                        TABLE 98 THERMAL FINGERPRINT SENSOR MARKET FOR BANKING & FINANCE, BY REGION, 2020–2023 (USD MILLION)
                        TABLE 99 THERMAL FINGERPRINT SENSOR MARKET FOR BANKING & FINANCE, BY REGION, 2024–2029 (USD MILLION)
                        TABLE 100 ULTRASONIC FINGERPRINT SENSOR MARKET FOR BANKING & FINANCE, BY REGION, 2020–2023 (USD MILLION)
                        TABLE 101 ULTRASONIC FINGERPRINT SENSOR MARKET FOR BANKING & FINANCE, BY REGION, 2024–2029 (USD MILLION)
                        TABLE 102 FINGERPRINT SENSOR MARKET FOR BANKING & FINANCE, BY REGION, 2020–2023 (USD MILLION)
                        TABLE 103 FINGERPRINT SENSOR MARKET FOR BANKING & FINANCE, BY REGION, 2024–2029 (USD MILLION)
     11.7 HEALTHCARE 
             11.7.1 NEED TO PROTECT IDENTITY AND CRITICAL PATIENT INFORMATION TO DRIVE DEMAND FOR FINGERPRINT SENSOR-BASED BIOMETRIC SYSTEMS
                        TABLE 104 FINGERPRINT SENSOR MARKET FOR HEALTHCARE, BY TECHNOLOGY, 2020–2023 (USD MILLION)
                        TABLE 105 FINGERPRINT SENSOR MARKET FOR HEALTHCARE, BY TECHNOLOGY, 2024–2029 (USD MILLION)
                        TABLE 106 CAPACITIVE FINGERPRINT SENSOR MARKET FOR HEALTHCARE, BY REGION, 2020–2023 (USD MILLION)
                        TABLE 107 CAPACITIVE FINGERPRINT SENSOR MARKET FOR HEALTHCARE, BY REGION, 2024–2029 (USD MILLION)
                        TABLE 108 OPTICAL FINGERPRINT SENSOR MARKET FOR HEALTHCARE, BY REGION, 2020–2023 (USD MILLION)
                        TABLE 109 OPTICAL FINGERPRINT SENSOR MARKET FOR HEALTHCARE, BY REGION, 2024–2029 (USD MILLION)
                        TABLE 110 THERMAL FINGERPRINT SENSOR MARKET FOR HEALTHCARE, BY REGION, 2020–2023 (USD MILLION)
                        TABLE 111 THERMAL FINGERPRINT SENSOR MARKET FOR HEALTHCARE, BY REGION, 2024–2029 (USD MILLION)
                        TABLE 112 ULTRASONIC FINGERPRINT SENSOR MARKET FOR HEALTHCARE, BY REGION, 2020–2023 (USD MILLION)
                        TABLE 113 ULTRASONIC FINGERPRINT SENSOR MARKET FOR HEALTHCARE, BY REGION, 2024–2029 (USD MILLION)
                        TABLE 114 FINGERPRINT SENSOR MARKET FOR HEALTHCARE, BY REGION, 2020–2023 (USD MILLION)
                        TABLE 115 FINGERPRINT SENSOR MARKET FOR HEALTHCARE, BY REGION, 2024–2029 (USD MILLION)
     11.8 SMART HOMES 
             11.8.1 DEVELOPMENT OF SMART LOCKS BY DIFFERENT OEMS TO CREAT GROWTH OPPORTUNITIES FOR MARKET PLAYERS
                        TABLE 116 FINGERPRINT SENSOR MARKET FOR SMART HOMES, BY TECHNOLOGY, 2020–2023 (USD MILLION)
                        TABLE 117 FINGERPRINT SENSOR MARKET FOR SMART HOMES, BY TECHNOLOGY, 2024–2029 (USD MILLION)
                        TABLE 118 CAPACITIVE FINGERPRINT SENSOR MARKET FOR SMART HOMES, BY REGION, 2020–2023 (USD MILLION)
                        TABLE 119 CAPACITIVE FINGERPRINT SENSOR MARKET FOR SMART HOMES, BY REGION, 2024–2029 (USD MILLION)
                        TABLE 120 OPTICAL FINGERPRINT SENSOR MARKET FOR SMART HOMES, BY REGION, 2020–2023 (USD MILLION)
                        TABLE 121 OPTICAL FINGERPRINT SENSOR MARKET FOR SMART HOMES, BY REGION, 2024–2029 (USD MILLION)
                        TABLE 122 THERMAL FINGERPRINT SENSOR MARKET FOR SMART HOMES, BY REGION, 2020–2023 (USD MILLION)
                        TABLE 123 THERMAL FINGERPRINT SENSOR MARKET FOR SMART HOMES, BY REGION, 2024–2029 (USD MILLION)
                        TABLE 124 ULTRASONIC FINGERPRINT SENSOR MARKET FOR SMART HOMES, BY REGION, 2020–2023 (USD MILLION)
                        TABLE 125 ULTRASONIC FINGERPRINT SENSOR MARKET FOR SMART HOMES, BY REGION, 2024–2029 (USD MILLION)
                        TABLE 126 FINGERPRINT SENSOR MARKET FOR SMART HOMES, BY REGION, 2020–2023 (USD MILLION)
                        TABLE 127 FINGERPRINT SENSOR MARKET FOR SMART HOMES, BY REGION, 2024–2029 (USD MILLION)
     11.9 COMMERCIAL 
             11.9.1 ADOPTION OF BIOMETRIC SYSTEMS IN VARIOUS ENTERPRISES AND RETAIL STORES TO ACCELERATE GROWTH
                        TABLE 128 FINGERPRINT SENSOR MARKET FOR COMMERCIAL, BY TECHNOLOGY, 2020–2023 (USD MILLION)
                        TABLE 129 FINGERPRINT SENSOR MARKET FOR COMMERCIAL, BY TECHNOLOGY, 2024–2029 (USD MILLION)
                        TABLE 130 CAPACITIVE FINGERPRINT SENSOR MARKET FOR COMMERCIAL, BY REGION, 2020–2023 (USD MILLION)
                        TABLE 131 CAPACITIVE FINGERPRINT SENSOR MARKET FOR COMMERCIAL, BY REGION, 2024–2029 (USD MILLION)
                        TABLE 132 OPTICAL FINGERPRINT SENSOR MARKET FOR COMMERCIAL, BY REGION, 2020–2023 (USD MILLION)
                        TABLE 133 OPTICAL FINGERPRINT SENSOR MARKET FOR COMMERCIAL, BY REGION, 2024–2029 (USD MILLION)
                        TABLE 134 THERMAL FINGERPRINT SENSOR MARKET FOR COMMERCIAL, BY REGION, 2020–2023 (USD MILLION)
                        TABLE 135 THERMAL FINGERPRINT SENSOR MARKET FOR COMMERCIAL, BY REGION, 2024–2029 (USD MILLION)
                        TABLE 136 ULTRASONIC FINGERPRINT SENSOR MARKET FOR COMMERCIAL, BY REGION, 2020–2023 (USD MILLION)
                        TABLE 137 ULTRASONIC FINGERPRINT SENSOR MARKET FOR COMMERCIAL, BY REGION, 2024–2029 (USD MILLION)
                        TABLE 138 FINGERPRINT SENSOR MARKET FOR COMMERCIAL, BY REGION, 2020–2023 (USD MILLION)
                        TABLE 139 FINGERPRINT SENSOR MARKET FOR COMMERCIAL, BY REGION, 2024–2029 (USD MILLION)
     11.10 OTHER END-USE APPLICATIONS 
             TABLE 140 FINGERPRINT SENSOR MARKET FOR OTHER END-USE APPLICATIONS, BY TECHNOLOGY, 2020–2023 (USD MILLION)
             TABLE 141 FINGERPRINT SENSOR MARKET FOR OTHER END-USE APPLICATIONS, BY TECHNOLOGY, 2024–2029 (USD MILLION)
             TABLE 142 CAPACITIVE FINGERPRINT SENSOR MARKET FOR OTHER END-USE APPLICATIONS, BY REGION, 2020–2023 (USD MILLION)
             TABLE 143 CAPACITIVE FINGERPRINT SENSOR MARKET FOR OTHER END-USE APPLICATIONS, BY REGION, 2024–2029 (USD MILLION)
             TABLE 144 OPTICAL FINGERPRINT SENSOR MARKET FOR OTHER END-USE APPLICATIONS, BY REGION, 2020–2023 (USD MILLION)
             TABLE 145 OPTICAL FINGERPRINT SENSOR MARKET FOR OTHER END-USE APPLICATIONS, BY REGION, 2024–2029 (USD MILLION)
             TABLE 146 THERMAL FINGERPRINT SENSOR MARKET FOR OTHER END-USE APPLICATIONS, BY REGION, 2020–2023 (USD MILLION)
             TABLE 147 THERMAL FINGERPRINT SENSOR MARKET FOR OTHER END-USE APPLICATIONS, BY REGION, 2024–2029 (USD MILLION)
             TABLE 148 ULTRASONIC FINGERPRINT SENSOR MARKET FOR OTHER END-USE APPLICATIONS BY REGION, 2020–2023 (USD MILLION)
             TABLE 149 ULTRASONIC FINGERPRINT SENSOR MARKET FOR OTHER END-USE APPLICATIONS, BY REGION, 2024–2029 (USD MILLION)
             TABLE 150 FINGERPRINT SENSOR MARKET FOR OTHER END-USE APPLICATIONS, BY REGION, 2020–2023 (USD MILLION)
             TABLE 151 FINGERPRINT SENSOR MARKET FOR OTHER END-USE APPLICATIONS, BY REGION, 2024–2029 (USD MILLION)
 
12 FINGERPRINT SENSOR MARKET, BY REGION (Page No. - 156)
     12.1 INTRODUCTION 
           FIGURE 43 ASIA PACIFIC TO HOLD LARGEST MARKET SHARE DURING FORECAST PERIOD
           TABLE 152 FINGERPRINT SENSOR MARKET, BY REGION, 2020–2023 (USD MILLION)
           TABLE 153 FINGERPRINT SENSOR MARKET, BY REGION, 2024–2029 (USD MILLION)
     12.2 NORTH AMERICA 
             12.2.1 NORTH AMERICA: RECESSION IMPACT
                        FIGURE 44 NORTH AMERICA: FINGERPRINT SENSOR MARKET SNAPSHOT
                        FIGURE 45 US TO HOLD LARGEST SHARE OF NORTH AMERICAN FINGERPRINT SENSOR MARKET IN 2029
                        TABLE 154 NORTH AMERICA: FINGERPRINT SENSOR MARKET, BY TECHNOLOGY, 2020–2023 (USD MILLION)
                        TABLE 155 NORTH AMERICA: FINGERPRINT SENSOR MARKET, BY TECHNOLOGY, 2024–2029 (USD MILLION)
                        TABLE 156 NORTH AMERICA: FINGERPRINT SENSOR MARKET, BY END-USE APPLICATION, 2020–2023 (USD MILLION)
                        TABLE 157 NORTH AMERICA: FINGERPRINT SENSOR MARKET, BY END-USE APPLICATION, 2024–2029 (USD MILLION)
                        TABLE 158 NORTH AMERICA: FINGERPRINT SENSOR MARKET, BY COUNTRY, 2020–2023 (USD MILLION)
                        TABLE 159 NORTH AMERICA: FINGERPRINT SENSOR MARKET, BY COUNTRY, 2024–2029 (USD MILLION)
                        TABLE 160 NORTH AMERICA: CAPACITIVE FINGERPRINT SENSOR MARKET, BY COUNTRY, 2020–2023 (USD MILLION)
                        TABLE 161 NORTH AMERICA: CAPACITIVE FINGERPRINT SENSOR MARKET, BY COUNTRY, 2024–2029 (USD MILLION)
                        TABLE 162 NORTH AMERICA: OPTICAL FINGERPRINT SENSOR MARKET, BY COUNTRY, 2020–2023 (USD MILLION)
                        TABLE 163 NORTH AMERICA: OPTICAL FINGERPRINT SENSOR MARKET, BY COUNTRY, 2024–2029 (USD MILLION)
                        TABLE 164 NORTH AMERICA: THERMAL FINGERPRINT SENSOR MARKET, BY COUNTRY, 2020–2023 (USD MILLION)
                        TABLE 165 NORTH AMERICA: THERMAL FINGERPRINT SENSOR MARKET, BY COUNTRY, 2024–2029 (USD MILLION)
                        TABLE 166 NORTH AMERICA: ULTRASONIC FINGERPRINT SENSOR MARKET, BY COUNTRY, 2020–2023 (USD MILLION)
                        TABLE 167 NORTH AMERICA: ULTRASONIC FINGERPRINT SENSOR MARKET, BY COUNTRY, 2024–2029 (USD MILLION)
             12.2.2 US
                        12.2.2.1 Growing adoption of fingerprint sensors in consumer electronics and banking & finance applications to offer lucrative growth opportunities for players
             12.2.3 CANADA
                        12.2.3.1 Rising number of immigrant students and workers to drive market
             12.2.4 MEXICO
                        12.2.4.1 Growing adoption of biometric cards in banking & finance and travel & immigration applications to augment market growth
     12.3 EUROPE 
             12.3.1 EUROPE: RECESSION IMPACT
                        FIGURE 46 EUROPE: FINGERPRINT SENSOR MARKET SNAPSHOT
                        FIGURE 47 GERMANY TO HOLD LARGEST SHARE OF EUROPEAN FINGERPRINT SENSOR MARKET IN 2029
                        TABLE 168 EUROPE: FINGERPRINT SENSOR MARKET, BY TECHNOLOGY, 2020–2023 (USD MILLION)
                        TABLE 169 EUROPE: FINGERPRINT SENSOR MARKET, BY TECHNOLOGY, 2024–2029 (USD MILLION)
                        TABLE 170 EUROPE: FINGERPRINT SENSOR MARKET, BY END-USE APPLICATION, 2020–2023 (USD MILLION)
                        TABLE 171 EUROPE: FINGERPRINT SENSOR MARKET, BY END-USE APPLICATION, 2024–2029 (USD MILLION)
                        TABLE 172 EUROPE: FINGERPRINT SENSOR MARKET, BY COUNTRY, 2020–2023 (USD MILLION)
                        TABLE 173 EUROPE: FINGERPRINT SENSOR MARKET, BY COUNTRY, 2024–2029 (USD MILLION)
                        TABLE 174 EUROPE: CAPACITIVE FINGERPRINT SENSOR MARKET, BY COUNTRY, 2020–2023 (USD MILLION)
                        TABLE 175 EUROPE: CAPACITIVE FINGERPRINT SENSOR MARKET, BY COUNTRY, 2024–2029 (USD MILLION)
                        TABLE 176 EUROPE: OPTICAL FINGERPRINT SENSOR MARKET, BY COUNTRY, 2020–2023 (USD MILLION)
                        TABLE 177 EUROPE: OPTICAL FINGERPRINT SENSOR MARKET, BY COUNTRY, 2024–2029 (USD MILLION)
                        TABLE 178 EUROPE: THERMAL FINGERPRINT SENSOR MARKET, BY COUNTRY, 2020–2023 (USD MILLION)
                        TABLE 179 EUROPE: THERMAL FINGERPRINT SENSOR MARKET, BY COUNTRY, 2024–2029 (USD MILLION)
                        TABLE 180 EUROPE: ULTRASONIC FINGERPRINT SENSOR MARKET, BY COUNTRY, 2020–2023 (USD MILLION)
                        TABLE 181 EUROPE: ULTRASONIC FINGERPRINT SENSOR MARKET, BY COUNTRY, 2024–2029 (USD MILLION)
             12.3.2 GERMANY
                        12.3.2.1 Rising adoption of fingerprint-based in-car digital payment services to drive market
             12.3.3 UK
                        12.3.3.1 Growing demand for fingerprint-based biometric solutions in law enforcement agencies to accelerate market growth
             12.3.4 FRANCE
                        12.3.4.1 Government and law enforcement and banking & finance applications to contribute to market growth
             12.3.5 ITALY
                        12.3.5.1 Rapid deployment of biometrics in airports and borders to support market growth
             12.3.6 REST OF EUROPE
     12.4 ASIA PACIFIC 
             12.4.1 ASIA PACIFIC: RECESSION IMPACT
                        FIGURE 48 ASIA PACIFIC: FINGERPRINT SENSOR MARKET SNAPSHOT
                        FIGURE 49 CHINA TO HOLD LARGEST SHARE OF ASIA PACIFIC FINGERPRINT SENSOR MARKET IN 2029
                        TABLE 182 ASIA PACIFIC: FINGERPRINT SENSOR MARKET, BY TECHNOLOGY, 2020–2023 (USD MILLION)
                        TABLE 183 ASIA PACIFIC: FINGERPRINT SENSOR MARKET, BY TECHNOLOGY, 2024–2029 (USD MILLION)
                        TABLE 184 ASIA PACIFIC: FINGERPRINT SENSOR MARKET, BY END-USE APPLICATION, 2020–2023 (USD MILLION)
                        TABLE 185 ASIA PACIFIC: FINGERPRINT SENSOR MARKET, BY END-USE APPLICATION, 2024–2029 (USD MILLION)
                        TABLE 186 ASIA PACIFIC: FINGERPRINT SENSOR MARKET, BY COUNTRY, 2020–2023 (USD MILLION)
                        TABLE 187 ASIA PACIFIC: FINGERPRINT SENSOR MARKET, BY COUNTRY, 2024–2029 (USD MILLION)
                        TABLE 188 ASIA PACIFIC: CAPACITIVE FINGERPRINT SENSOR MARKET, BY COUNTRY, 2020–2023 (USD MILLION)
                        TABLE 189 ASIA PACIFIC: CAPACITIVE FINGERPRINT SENSOR MARKET, BY COUNTRY, 2024–2029 (USD MILLION)
                        TABLE 190 ASIA PACIFIC: OPTICAL FINGERPRINT SENSOR MARKET, BY COUNTRY, 2020–2023 (USD MILLION)
                        TABLE 191 ASIA PACIFIC: OPTICAL FINGERPRINT SENSOR MARKET, BY COUNTRY, 2024–2029 (USD MILLION)
                        TABLE 192 ASIA PACIFIC: THERMAL FINGERPRINT SENSOR MARKET, BY COUNTRY, 2020–2023 (USD MILLION)
                        TABLE 193 ASIA PACIFIC: THERMAL FINGERPRINT SENSOR MARKET, BY COUNTRY, 2024–2029 (USD MILLION)
                        TABLE 194 ASIA PACIFIC: ULTRASONIC FINGERPRINT SENSOR MARKET, BY COUNTRY, 2020–2023 (USD MILLION)
                        TABLE 195 ASIA PACIFIC: ULTRASONIC FINGERPRINT SENSOR MARKET, BY COUNTRY, 2024–2029 (USD MILLION)
             12.4.2 CHINA
                        12.4.2.1 Robust presence of leading smartphone manufacturers to boost market growth
             12.4.3 JAPAN
                        12.4.3.1 Dominance in automotive manufacturing and fingerprint-based biometric cards to drive market
             12.4.4 INDIA
                        12.4.4.1 Higher adoption of fingerprint scanners under Aadhaar initiative to boost demand for fingerprint sensors
             12.4.5 SOUTH KOREA
                        12.4.5.1 Thriving electronics industry to accelerate market growth
             12.4.6 REST OF ASIA PACIFIC
     12.5 ROW 
             12.5.1 ROW: RECESSION IMPACT
                        TABLE 196 ROW: FINGERPRINT SENSOR MARKET, BY TECHNOLOGY, 2020–2023 (USD MILLION)
                        TABLE 197 ROW: FINGERPRINT SENSOR MARKET, BY TECHNOLOGY, 2024–2029 (USD MILLION)
                        TABLE 198 ROW: FINGERPRINT SENSOR MARKET, BY END-USE APPLICATION, 2020–2023 (USD MILLION)
                        TABLE 199 ROW: FINGERPRINT SENSOR MARKET, BY END-USE APPLICATION, 2024–2029 (USD MILLION)
                        TABLE 200 ROW: FINGERPRINT SENSOR MARKET, BY REGION, 2020–2023 (USD MILLION)
                        TABLE 201 ROW: FINGERPRINT SENSOR MARKET, BY REGION, 2024–2029 (USD MILLION)
                        TABLE 202 ROW: CAPACITIVE FINGERPRINT SENSOR MARKET, BY REGION, 2020–2023 (USD MILLION)
                        TABLE 203 ROW: CAPACITIVE FINGERPRINT SENSOR MARKET, BY REGION, 2024–2029 (USD MILLION)
                        TABLE 204 ROW: OPTICAL FINGERPRINT SENSOR MARKET, BY REGION, 2020–2023 (USD MILLION)
                        TABLE 205 ROW: OPTICAL FINGERPRINT SENSOR MARKET, BY REGION, 2024–2029 (USD MILLION)
                        TABLE 206 ROW: THERMAL FINGERPRINT SENSOR MARKET, BY REGION, 2020–2023 (USD MILLION)
                        TABLE 207 ROW: THERMAL FINGERPRINT SENSOR MARKET, BY REGION, 2024–2029 (USD MILLION)
                        TABLE 208 ROW: ULTRASONIC FINGERPRINT SENSOR MARKET, BY REGION, 2020–2023 (USD MILLION)
                        TABLE 209 ROW: ULTRASONIC FINGERPRINT SENSOR MARKET, BY REGION, 2024–2029 (USD MILLION)
             12.5.2 SOUTH AMERICA
                        12.5.2.1 Banking & finance applications to provide attractive growth opportunities
             12.5.3 MIDDLE EAST
                        12.5.3.1 Substantial government investments in smart city initiatives to support market growth
                                     TABLE 210 MIDDLE EAST: FINGERPRINT SENSOR MARKET, BY COUNTRY, 2020–2023 (USD MILLION)
                                     TABLE 211 MIDDLE EAST: FINGERPRINT SENSOR MARKET, BY COUNTRY, 2024–2029 (USD MILLION)
                                     TABLE 212 MIDDLE EAST: CAPACITIVE FINGERPRINT SENSOR MARKET, BY COUNTRY, 2020–2023 (USD MILLION)
                                     TABLE 213 MIDDLE EAST: CAPACITIVE FINGERPRINT SENSOR MARKET, BY COUNTRY, 2024–2029 (USD MILLION)
                                     TABLE 214 MIDDLE EAST: OPTICAL FINGERPRINT SENSOR MARKET, BY COUNTRY, 2020–2023 (USD MILLION)
                                     TABLE 215 MIDDLE EAST: OPTICAL FINGERPRINT SENSOR MARKET, BY COUNTRY, 2024–2029 (USD MILLION)
                                     TABLE 216 MIDDLE EAST: THERMAL FINGERPRINT SENSOR MARKET, BY COUNTRY, 2020–2023 (USD MILLION)
                                     TABLE 217 MIDDLE EAST: THERMAL FINGERPRINT SENSOR MARKET, BY COUNTRY, 2024–2029 (USD MILLION)
                                     TABLE 218 MIDDLE EAST: ULTRASONIC FINGERPRINT SENSOR MARKET, BY COUNTRY, 2020–2023 (USD MILLION)
                                     TABLE 219 MIDDLE EAST: ULTRASONIC FINGERPRINT SENSOR MARKET, BY COUNTRY, 2024–2029 (USD MILLION)
                        12.5.3.2 GCC countries
                        12.5.3.3 Rest of Middle East
             12.5.4 AFRICA
                        12.5.4.1 Growing internet penetration to support market expansion
 
13 COMPETITIVE LANDSCAPE (Page No. - 191)
     13.1 OVERVIEW 
     13.2 KEY PLAYER STRATEGIES/RIGHT TO WIN, 2021–2024 
             TABLE 220 FINGERPRINT SENSOR MARKET: OVERVIEW OF STRATEGIES DEPLOYED BY KEY PLAYERS
     13.3 REVENUE ANALYSIS, 2021–2023 
             FIGURE 50 FINGERPRINT SENSOR MARKET: REVENUE ANALYSIS OF TOP FIVE PLAYERS, 2021–2023
     13.4 MARKET SHARE ANALYSIS, 2023 
             FIGURE 51 FINGERPRINT SENSOR MARKET SHARE ANALYSIS FOR TOP FIVE PLAYERS, 2023
             TABLE 221 FINGERPRINT SENSOR MARKET SHARE ANALYSIS FOR TOP FIVE PLAYERS, 2023
             FIGURE 52 RANKING OF TOP FIVE PLAYERS IN FINGERPRINT SENSOR MARKET, 2023
     13.5 COMPANY VALUATION AND FINANCIAL METRICS 
             FIGURE 53 COMPANY VALUATION (USD BILLION), 2024
             FIGURE 54 FINANCIAL METRICS (ENTERPRISE VALUE/EBITDA), 2024
     13.6 BRAND/PRODUCT COMPARISON 
           FIGURE 55 FINGERPRINT SENSOR MARKET: BRAND/PRODUCT COMPARISON
     13.7 COMPANY EVALUATION MATRIX: KEY PLAYERS, 2023 
             13.7.1 STARS
             13.7.2 EMERGING LEADERS
             13.7.3 PERVASIVE PLAYERS
             13.7.4 PARTICIPANTS
                        FIGURE 56 FINGERPRINT SENSOR MARKET: COMPANY EVALUATION MATRIX (KEY COMPANIES), 2023
             13.7.5 COMPANY FOOTPRINT: KEY PLAYERS, 2023
                        FIGURE 57 FINGERPRINT SENSOR MARKET: COMPANY FOOTPRINT
                        13.7.5.1 End-use application footprint
                                     TABLE 222 FINGERPRINT SENSOR MARKET: END-USE APPLICATION FOOTPRINT
                        13.7.5.2 Technology footprint
                                      TABLE 223 FINGERPRINT SENSOR MARKET: TECHNOLOGY FOOTPRINT
                        13.7.5.3 Sensor technology footprint
                                     TABLE 224 FINGERPRINT SENSOR MARKET: SENSOR TECHNOLOGY FOOTPRINT
                        13.7.5.4 Type footprint
                                     TABLE 225 FINGERPRINT SENSOR MARKET: TYPE FOOTPRINT
                        13.7.5.5 Region footprint
                                     TABLE 226 FINGERPRINT SENSOR MARKET: REGION FOOTPRINT
     13.8 COMPANY EVALUATION MATRIX: STARTUPS/SMES, 2023 
             13.8.1 PROGRESSIVE COMPANIES
             13.8.2 RESPONSIVE COMPANIES
             13.8.3 DYNAMIC COMPANIES
             13.8.4 STARTING BLOCKS
                        FIGURE 58 FINGERPRINT SENSOR MARKET: COMPANY EVALUATION MATRIX (STARTUPS/SMES), 2023
             13.8.5 COMPETITIVE BENCHMARKING, STARTUPS/SMES, 2023
                        13.8.5.1 Detailed list of key startups/SMEs
                                     TABLE 227 FINGERPRINT SENSOR MARKET: KEY STARTUPS/SMES
                        13.8.5.2 Competitive benchmarking of key startups/SMEs
                                     TABLE 228 FINGERPRINT SENSOR MARKET: COMPETITIVE BENCHMARKING OF KEY STARTUPS/SMES
     13.9 COMPETITIVE SCENARIO AND TRENDS 
             13.9.1 PRODUCT LAUNCHES
                        TABLE 229 FINGERPRINT SENSOR MARKET: PRODUCT LAUNCHES, JANUARY 2021–MARCH 2024
             13.9.2 DEALS
                        TABLE 230 FINGERPRINT SENSOR MARKET: DEALS, MARCH 2021–FEBRUARY 2024
 
14 COMPANY PROFILES (Page No. - 213)
     14.1 KEY PLAYERS 
(Business overview, Services offered, Recent developments, Product launches, MnM view, Key strengths, Strategic choices, and Weaknesses and Competitive threats)*  
             14.1.1 SHENZHEN GOODIX TECHNOLOGY CO., LTD.
                        TABLE 231 SHENZHEN GOODIX TECHNOLOGY CO., LTD.: COMPANY OVERVIEW
                        FIGURE 59 SHENZHEN GOODIX TECHNOLOGY CO., LTD.: COMPANY SNAPSHOT
                        TABLE 232 SHENZHEN GOODIX TECHNOLOGY CO., LTD.: PRODUCTS OFFERED
                        TABLE 233 SHENZHEN GOODIX TECHNOLOGY CO., LTD.: PRODUCT LAUNCHES
                        TABLE 234 SHENZHEN GOODIX TECHNOLOGY CO., LTD.: DEALS
             14.1.2 FINGERPRINTS
                        TABLE 235 FINGERPRINTS: COMPANY OVERVIEW
                        FIGURE 60 FINGERPRINTS: COMPANY SNAPSHOT
                        TABLE 236 FINGERPRINTS: PRODUCTS OFFERED
                        TABLE 237 FINGERPRINTS: PRODUCT LAUNCHES
                        TABLE 238 FINGERPRINTS: DEALS
             14.1.3 SYNAPTICS INCORPORATED
                        TABLE 239 SYNAPTICS INCORPORATED: COMPANY OVERVIEW
                        FIGURE 61 SYNAPTICS INCORPORATED: COMPANY SNAPSHOT
                        TABLE 240 SYNAPTICS INCORPORATED: PRODUCTS OFFERED
                        TABLE 241 SYNAPTICS INCORPORATED: PRODUCT LAUNCHES
                        TABLE 242 SYNAPTICS INCORPORATED: DEALS
             14.1.4 EGIS TECHNOLOGY INC
                        TABLE 243 EGIS TECHNOLOGY INC: COMPANY OVERVIEW
                        FIGURE 62 EGIS TECHNOLOGY INC: COMPANY SNAPSHOT
                        TABLE 244 EGIS TECHNOLOGY INC: PRODUCTS OFFERED
                        TABLE 245 EGIS TECHNOLOGY INC: DEALS
             14.1.5 QUALCOMM TECHNOLOGIES, INC.
                        TABLE 246 QUALCOMM TECHNOLOGIES, INC.: COMPANY OVERVIEW
                        FIGURE 63 QUALCOMM TECHNOLOGIES, INC.: COMPANY SNAPSHOT
                        TABLE 247 QUALCOMM TECHNOLOGIES, INC.: PRODUCTS OFFERED
                        TABLE 248 QUALCOMM TECHNOLOGIES, INC.: PRODUCT LAUNCHES
                        TABLE 249 QUALCOMM TECHNOLOGIES, INC.: DEALS
             14.1.6 APPLE INC.
                        TABLE 250 APPLE INC.: COMPANY OVERVIEW
                        FIGURE 64 APPLE INC.: COMPANY SNAPSHOT
                        TABLE 251 APPLE INC.: PRODUCTS OFFERED
                        TABLE 252 APPLE INC.: PRODUCT LAUNCHES
                        TABLE 253 APPLE INC.: DEALS
             14.1.7 CRUCIALTEC
                        TABLE 254 CRUCIALTEC: COMPANY OVERVIEW
                        FIGURE 65 CRUCIALTEC: COMPANY SNAPSHOT
                        TABLE 255 CRUCIALTEC: PRODUCTS OFFERED
             14.1.8 NEXT BIOMETRICS
                        TABLE 256 NEXT BIOMETRICS: COMPANY OVERVIEW
                        FIGURE 66 NEXT BIOMETRICS: COMPANY SNAPSHOT
                        TABLE 257 NEXT BIOMETRICS: PRODUCTS OFFERED
                        TABLE 258 NEXT BIOMETRICS: DEALS
             14.1.9 NOVATEK MICROELECTRONICS CORP.
                        TABLE 259 NOVATEK MICROELECTRONICS CORP.: COMPANY OVERVIEW
                        FIGURE 67 NOVATEK MICROELECTRONICS CORP.: COMPANY SNAPSHOT
                        TABLE 260 NOVATEK MICROELECTRONICS CORP.: PRODUCTS OFFERED
             14.1.10 Q TECHNOLOGY
                        TABLE 261 Q TECHNOLOGY: COMPANY OVERVIEW
                        FIGURE 68 Q TECHNOLOGY: COMPANY SNAPSHOT
                        TABLE 262 Q TECHNOLOGY: PRODUCTS OFFERED
     14.2 OTHER COMPANIES 
             14.2.1 VICHARAK
                        TABLE 263 VICHARAK: COMPANY OVERVIEW
             14.2.2 INVIXIUM
                        TABLE 264 INVIXIUM: COMPANY OVERVIEW
             14.2.3 M2SYS TECHNOLOGY
                        TABLE 265 M2SYS TECHNOLOGY: COMPANY OVERVIEW
             14.2.4 PARALLAX INC.
                        TABLE 266 PARALLAX INC.: COMPANY OVERVIEW
             14.2.5 MANTRA SOFTECH (INDIA) PVT. LTD.
                        TABLE 267 MANTRA SOFTECH (INDIA) PVT. LTD.: COMPANY OVERVIEW
             14.2.6 CMOS SENSOR INC.
                        TABLE 268 CMOS SENSOR INC.: COMPANY OVERVIEW
             14.2.7 ELAN MICROELECTRONICS CORP.
                        TABLE 269 ELAN MICROELECTRONICS CORP.: COMPANY OVERVIEW
             14.2.8 FOCALTECH SYSTEMS CO., LTD.
                        TABLE 270 FOCALTECH SYSTEMS CO., LTD.: COMPANY OVERVIEW
             14.2.9 ID3 TECHNOLOGIES
                        TABLE 271 ID3 TECHNOLOGIES: COMPANY OVERVIEW
             14.2.10 IDEX BIOMETRICS
                        TABLE 272 IDEX BIOMETRICS: COMPANY OVERVIEW
             14.2.11 JAPAN DISPLAY INC.
                        TABLE 273 JAPAN DISPLAY INC.: COMPANY OVERVIEW
             14.2.12 OXI TECHNOLOGY
                        TABLE 274 OXI TECHNOLOGY: COMPANY OVERVIEW
             14.2.13 SONAVATION INC.
                        TABLE 275 SONAVATION INC.: COMPANY OVERVIEW
             14.2.14 TOUCH BIOMETRIX
                        TABLE 276 TOUCH BIOMETRIX: COMPANY OVERVIEW
             14.2.15 VKANSEE
                        TABLE 277 VKANSEE: COMPANY OVERVIEW
*Details on Business overview, Services offered, Recent developments, Product launches, MnM view, Key strengths, Strategic choices, and Weaknesses and Competitive threats might not be captured in case of unlisted companies.  
 
15 APPENDIX (Page No. - 257)
     15.1 DISCUSSION GUIDE 
     15.2 KNOWLEDGESTORE: MARKETSANDMARKETS’ SUBSCRIPTION PORTAL 
     15.3 CUSTOMIZATION OPTIONS 
     15.4 RELATED REPORTS 
     15.5 AUTHOR DETAILS 


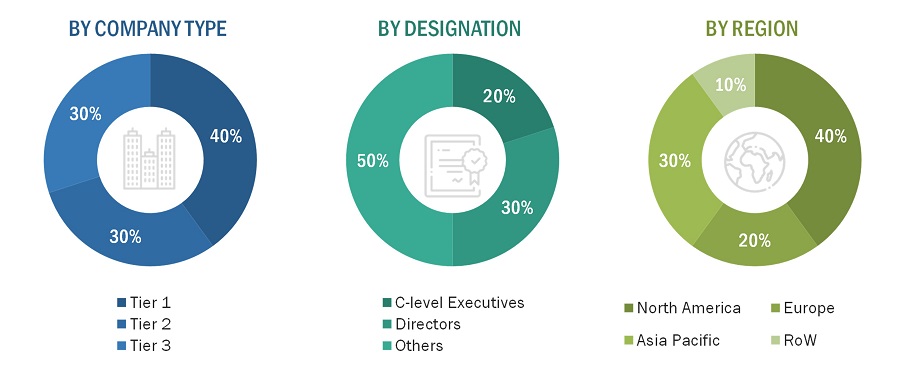
The research process for this study included systematic gathering, recording, and analysis of data about customers and companies operating in the fingerprint sensor market. This process involved the extensive use of secondary sources, directories, and databases (Factiva, Oanda, and OneSource) for identifying and collecting valuable information for the comprehensive, technical, market-oriented, and commercial study of the fingerprint sensor market. In-depth interviews were conducted with primary respondents, including experts from core and related industries and preferred manufacturers, to obtain and verify critical qualitative and quantitative information as well as to assess growth prospects. Key players in the fingerprint sensor market were identified through secondary research, and their market rankings were determined through primary and secondary research. This research included studying annual reports of top players and interviewing key industry experts such as CEOs, directors, and marketing executives.

Secondary Research

In the secondary research process, various sources were used to identify and collect information important for this study. These include annual reports, press releases & investor presentations of companies, white papers, technology journals, certified publications, articles by recognized authors, directories, and databases.

Secondary research was mainly used to obtain key information about the industry's value chain, the total pool of market players, the classification of the market according to industry trends to the bottom-most level, regional markets, and key developments from the market and technology-oriented perspectives.

Primary Research

Primary research was also conducted to identify the segmentation types, key players, competitive landscape, and key market dynamics, such as drivers, restraints, opportunities, challenges, and industry trends, along with key strategies adopted by players operating in the fingerprint sensor market. Extensive qualitative and quantitative analyses were performed on the complete market engineering process to list key information and insights throughout the report.

Extensive primary research has been conducted after acquiring knowledge about the fingerprint sensor market scenario through secondary research. Several primary interviews have been conducted with experts from both demand (end-use application, and region) and supply side (technology, sensor technology, type) across four major geographic regions: North America, Europe, Asia Pacific, and RoW. Approximately 80% and 20% of the primary interviews were conducted from the supply and demand side, respectively. These primary data have been collected through questionnaires, emails, and telephonic interviews.
Fingerprint Sensor Market
 Size, and Share

To know about the assumptions considered for the study, download the pdf brochure

Market Size Estimation

In the complete market engineering process, both top-down and bottom-up approaches were implemented, along with several data triangulation methods, to estimate and validate the size of the fingerprint sensor market and various other dependent submarkets. Key players in the market were identified through secondary research, and their market share in the respective regions was determined through primary and secondary research. This entire research methodology included the study of annual and financial reports of the top players, as well as interviews with experts (such as CEOs, VPs, directors, and marketing executives) for key insights (quantitative and qualitative).

All percentage shares, splits, and breakdowns were determined using secondary sources and verified through primary sources. All the possible parameters that affect the markets covered in this research study were accounted for, viewed in detail, verified through primary research, and analyzed to obtain the final quantitative and qualitative data. This data was consolidated and supplemented with detailed inputs and analysis from MarketsandMarkets and presented in this report.

Fingerprint Sensor Market: Bottom-Up Approach

Fingerprint Sensor Market
 Size, and Bottom-Up Approach

Fingerprint Sensor Market: Top-Down Approach

Fingerprint Sensor Market
 Size, and Top-Down Approach

Data Triangulation

After arriving at the overall market size from the market size estimation process, as explained above, the total market has been split into several segments and subsegments. To complete the overall market engineering process and arrive at the exact statistics for all segments and subsegments, market breakdown and data triangulation procedures have been employed, wherever applicable. The data have been triangulated by studying various factors and trends from both the demand and supply sides. Along with this, the market has been validated using top-down and bottom-up approaches.

Market Definition

A fingerprint sensor is an electronic component used to capture a digital image of the fingerprint pattern of a person, i.e., the ridges and valleys (minutiae) found on the surface tips of a human finger to identify an individual. The captured image is called a live scan, and live scans are digitally processed to create a biometric template stored and used for matching the patterns. Since every person’s fingerprint is unique and different from any other in the world, it has become an ideal and popular identification method.

Key Stakeholders

  • Smartphone OEMs, access control system providers, fingerprint scanner providers, IoT device manufacturers
  • Sensor manufacturers
  • Smartcard providers
  • Integrated device manufacturers
  • Research organizations and consulting companies
  • Subcomponent manufacturers
  • Technology providers
  • Sensor chip traders and distributors
  • Electronic hardware equipment manufacturers
  • Research institutes and organizations

Report Objectives

  • To define, describe, and forecast the fingerprint sensor market, in terms of value, by technology, sensor technology, type, end-use application, and region.
  • To describe and forecast the fingerprint sensor market, by end-use application, in terms of volume.
  • To forecast the size of the market segments for four major regions—North America, Europe, Asia Pacific, and the Rest of the World (RoW).
  • To explain the different materials used in fingerprint sensors, key standards for fingerprint sensors, and various products that use fingerprint sensors
  • To provide detailed information regarding the major factors influencing the growth of the market (drivers, restraints, opportunities, and challenges)
  • To offer an ecosystem analysis, case study analysis, patent analysis, technology analysis, pricing analysis, Porter’s Five Forces analysis, and regulations pertaining to the market.
  • To give a detailed overview of the value chain of the fingerprint sensor market ecosystem
  • To strategically analyze micro markets with respect to individual growth trends, prospects, and contributions to the total market
  • To strategically profile the key players and comprehensively analyze their market shares and core competencies
  • To analyze the opportunities in the market for stakeholders and describe the competitive landscape of the market
  • To study competitive developments such as collaborations, partnerships, product developments, and acquisitions in the market
  • To understand the impact of the recession on the fingerprint sensor market

Available Customizations

With the given market data, MarketsandMarkets offers customizations according to the company’s specific needs. The following customization options are available for the report:

Company Information

  • Detailed analysis and profiling of additional market players (up to 5)
Custom Market Research Services

We will customize the research for you, in case the report listed above does not meet with your exact requirements. Our custom research will comprehensively cover the business information you require to help you arrive at strategic and profitable business decisions.

Request Customization

Instant Answers with GPT - Ask Now!

Ask real questions. Get complete answers !
Report Code
SE 3536
Published ON
May, 2024
Choose License Type
BUY NOW
  • SHARE
X
Request Customization
Speak to Analyst
Speak to Analyst
OR FACE-TO-FACE MEETING
PERSONALIZE THIS RESEARCH
  • Triangulate with your Own Data
  • Get Data as per your Format and Definition
  • Gain a Deeper Dive on a Specific Application, Geography, Customer or Competitor
  • Any level of Personalization
REQUEST A FREE CUSTOMIZATION
LET US HELP YOU!
  • What are the Known and Unknown Adjacencies Impacting the Fingerprint Sensor Market
  • What will your New Revenue Sources be?
  • Who will be your Top Customer; what will make them switch?
  • Defend your Market Share or Win Competitors
  • Get a Scorecard for Target Partners
CUSTOMIZED WORKSHOP REQUEST
+1-888-600-6441
  • Call Us
  • +1-888-600-6441 (Corporate office hours)
  • +1-888-600-6441 (US/Can toll free)
  • +44-800-368-9399 (UK office hours)
CONNECT WITH US
ABOUT TRUST ONLINE
©2024 MarketsandMarkets Research Private Ltd. All rights reserved
DMCA.com Protection Status Website Feedback