
Biometric System Market Size, Share & Growth

Biometric System Market by Authentication (Fingerprint, Iris, Face, Voice, Vein, Palm, Signature, Multi-factor, Gait, Keystrokes), Offering (Sensor, Camera, Reader, Scanner, Software, Service), Contact, Contactless, Mobility - Global Forecast to 2030


BIOMETRIC SYSTEM MARKET OVERVIEW
Source: Secondary Research, Interviews with Experts, MarketsandMarkets Analysis
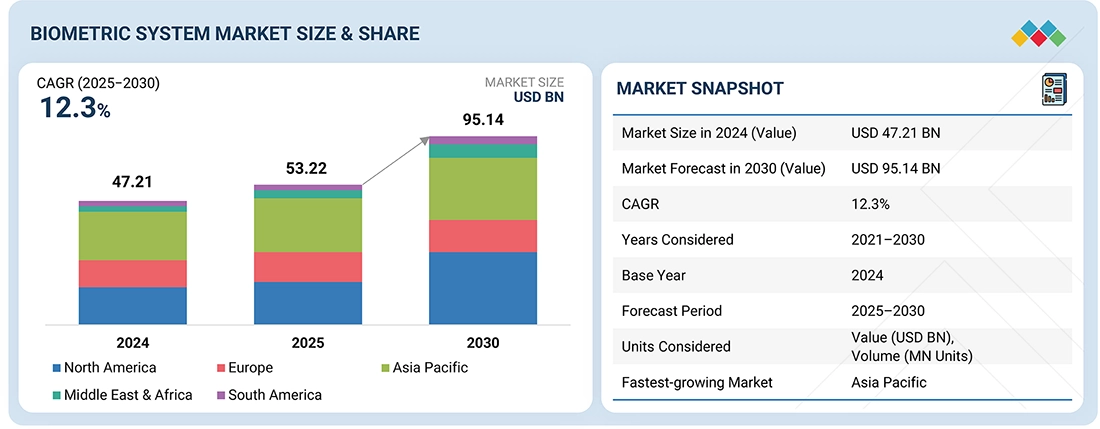
The biometric system market is projected to grow from USD 53.22 billion in 2025 to USD 95.14 billion by 2030, at a CAGR of 12.3% from 2025 to 2030. The market is experiencing significant growth due to the increasing need for secure and seamless authentication across various industries, including government, banking, healthcare, and consumer electronics. In the government and law enforcement sectors, the rising implementation of national ID programs and border control systems accelerates the demand for fingerprint and facial recognition technologies.
The Biometric System Market is witnessing significant expansion as organizations increasingly adopt advanced identity verification technologies to enhance security and user authentication. According to MarketsandMarkets, the Biometric System Market size was valued at approximately USD 53.22 billion in 2025 and is projected to reach USD 95.14 billion by 2030, registering a CAGR of about 12.3% during the forecast period. The rising demand for secure authentication across sectors such as banking, healthcare, government, and consumer electronics is a key factor driving Biometric System Market growth. As digital transformation accelerates globally, the Biometric Technology Market continues to gain momentum due to its ability to provide accurate, fast, and contactless identity verification compared to traditional passwords or PIN-based systems. The integration of artificial intelligence and machine learning is also reshaping Biometric System Market trends, enabling more reliable and scalable authentication solutions.
In terms of Biometric System Market share, government and public security sectors hold a substantial portion due to large-scale national ID programs, border control systems, and law enforcement applications. Contactless solutions such as facial recognition, iris scanning, and voice biometrics are rapidly gaining adoption, further strengthening Biometric System Market trends worldwide. Regionally, North America especially the US Biometric System Market is a major contributor due to strong investments in cybersecurity, digital identity systems, and advanced surveillance technologies. Additionally, increasing smartphone penetration, digital banking adoption, and the emergence of cloud-based biometric platforms are supporting continuous Biometric System Market growth. As organizations prioritize identity protection and fraud prevention, the Biometric Technology Market is expected to expand further, creating new opportunities for software providers, sensor manufacturers, and authentication service vendors in the coming years.
BIOMETRIC SYSTEM Market Size & Forecast
KEY TAKEAWAYS
- The Asia Pacific biometric system market accounted 38.9% revenue share in 2024
- By offering, software is expected to register highest CAGR of 12.8%
- By authentication, the single-factor authentication segment is expected to hold a share of 86.6% of the biometric system market in 2025.
- By type,contact-less segment is projected to grow fastest during the forecast period.
- By deployment mode, On-premises deployment holds a significant market share during forecast period
- By mobility, portable segment is projected to grow fastest during the forecast perod
- By vertical, the government segment is expected to hold a share largest share of the biometric system market in 2025.
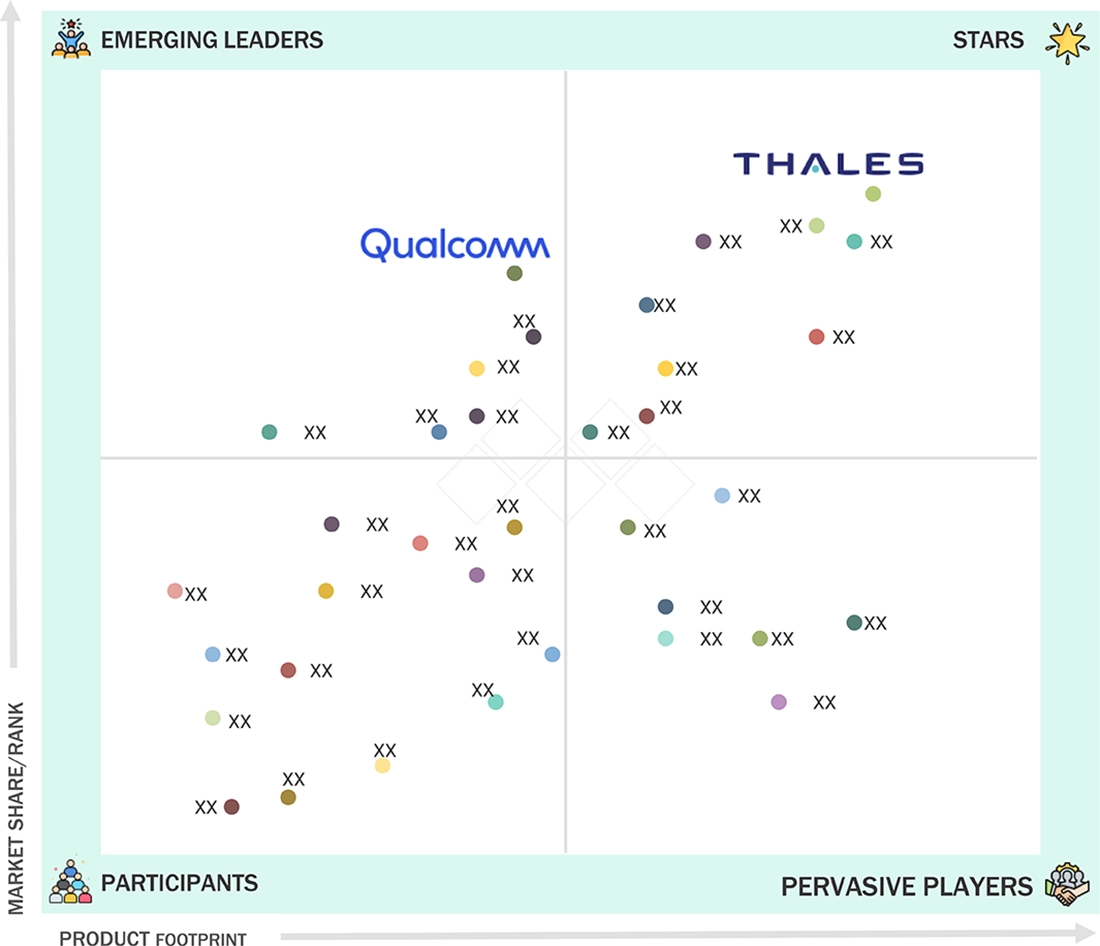
- The companies such Thales, Assa Abloy and IDEMIA were identified as Star players in the biometric system market, given their broad industry coverage and strong operational & financial strength.
- The companies such as Qualcomm, Aware,Inc and Daon, Inc among others have distinguished themselves among SMEs due to their well-developed marketing channels and extensive funding to build their product portfolios
The biometric system market is projected to grow steadily over the next decade, driven by the increasing need for secure, convenient, and contactless identity verification across public and private sectors. Rising adoption in government, BFSI, healthcare, and consumer electronics fuels the market expansion as organizations prioritize data security and user authentication. Biometric systems, encompassing fingerprint, facial, iris, and voice recognition, offer superior accuracy and resistance to fraud compared to traditional password-based systems.
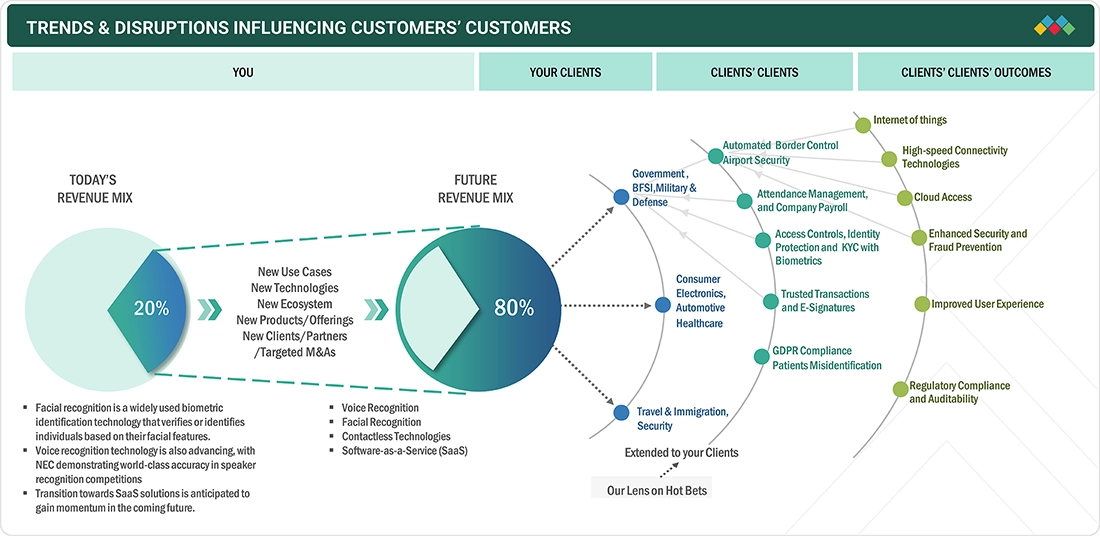
TRENDS & DISRUPTIONS IMPACTING CUSTOMERS' CUSTOMERS
The rapid deployment of contactless technologies has paved the way for deploying biometric systems in multiple sectors, such as government, BFSI, military & defense, and consumer electronics. Major use cases include General Data Protection Regulation (GDPR) compliance, attendance management, identity protection, border control, and airport security. The integration of sophisticated software has brought about new changes. A few applications deemed impossible, such as automotive and travel & immigration, to be handled by the biometric system have now become possible.
Source: Secondary Research, Interviews with Experts, MarketsandMarkets Analysis
BIOMETRIC SYSTEM MARKET DYNAMICS
Level
-
Surging demand for biometric technology-enabled consumer electronics

-
Elevating use of biometrics in government projects to enhance security and efficiency

Level
-
High costs associated with biometric systems

-
Stringent regulations related to biometric data collection, storage, and processing

Level
-
Development of Al- and ML-based biometric solutions

-
Collaborative strategies among participants in supply chain

Level
-
Data security concerns and shortage of technical knowledge

-
Complexities in detecting authorized and unauthorized users

Source: Secondary Research, Interviews with Experts, MarketsandMarkets Analysis
Driver: Surging demand for biometric technology-enabled consumer electronics
The growing integration of biometric authentication in smartphones, laptops, and wearables is a major driver for the biometric system market. Consumers increasingly prefer fingerprint, facial, and voice recognition for secure and seamless access, pushing manufacturers to embed advanced biometric sensors into everyday devices for enhanced user convenience and data protection.
Restraint: High costs associated with biometric systems
The high initial cost of biometric hardware, software integration, and system maintenance limits adoption, especially among small enterprises and developing regions. Complex installation, specialized calibration, and ongoing upgrades contribute to the overall expense, posing challenges for large-scale deployment of advanced biometric authentication technologies.
Opportunity: Development of Al- and ML-based biometric solutions
Advancements in artificial intelligence and machine learning are creating new opportunities for more accurate and adaptive biometric systems. These technologies enhance recognition precision, enable real-time threat detection, and reduce false positives, supporting the development of intelligent, scalable biometric platforms for applications in security, healthcare, and digital identity verification.
Challenge: Data security concerns and shortage of technical knowledge
Data privacy risks, including identity theft and unauthorized access, remain a major challenge in biometric adoption. Additionally, the lack of technical expertise in system integration, encryption, and algorithm training hampers widespread implementation, highlighting the need for stronger cybersecurity frameworks and skilled workforce development in the biometric industry.
Biometric System Market: COMMERCIAL USE CASES ACROSS INDUSTRIES
| COMPANY | USE CASE DESCRIPTION | BENEFITS |
|---|---|---|
 |
Provides advanced biometric identity management systems for e-passports, border control, and government ID programs | Enhanced national security | Accelerated citizen verification | Secure digital identity infrastructure |
 |
Develops biometric access control and smart locking solutions for enterprise, residential, and commercial facilities | Improved physical security | Seamless access management | Reduced dependency on physical keys and cards |
 |
Offers AI-driven multimodal biometric systems integrating facial, fingerprint, and iris recognition for public safety and enterprise security | High-speed authentication | Accurate identification in crowds | Strengthened law enforcement and surveillance efficiency |
 |
Specializes in biometric authentication for digital identity, financial services, and border management through fingerprint and facial recognition | Fraud prevention | Secure digital transactions | Enhanced customer onboarding experience |
 |
Provides palm vein and facial recognition systems for healthcare, banking, and enterprise applications | Contactless authentication | Improved patient and customer verification | Increased privacy and hygiene compliance |
Logos and trademarks shown above are the property of their respective owners. Their use here is for informational and illustrative purposes only.
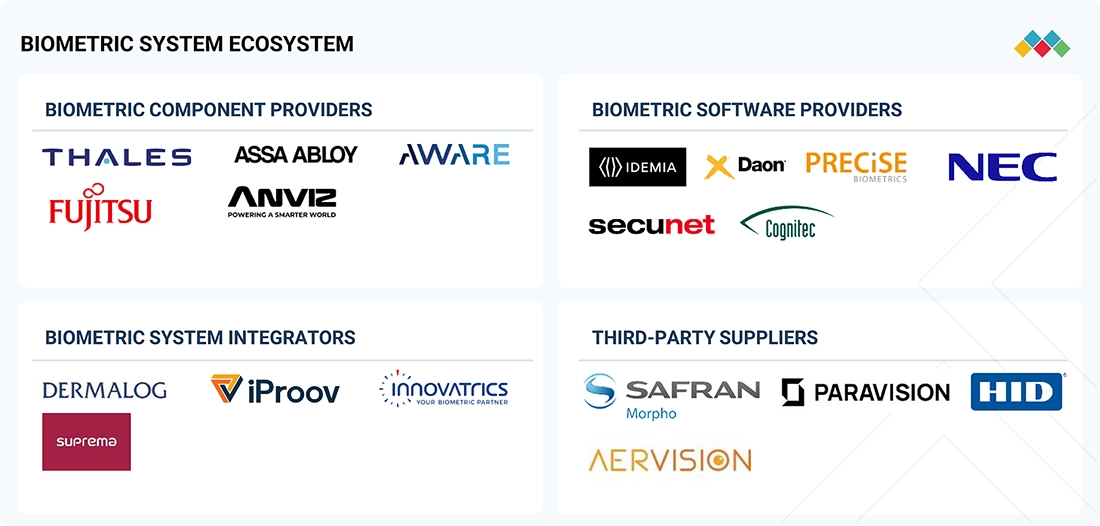
BIOMETRIC SYSTEM MARKET ECOSYSTEM
The biometric system market ecosystem demonstrates a complex, interdependent network where specialized providers collaborate to deliver end-to-end authentication solutions. Biometric component providers supply fingerprint scanners, iris readers, and facial recognition cameras, while biometric software providers create algorithms for pattern matching and data encryption. Biometric system integrators bridge the gap between components and end users, customizing deployments for specific industry requirements. Third-party suppliers enhance the ecosystem with complementary technologies like secure credential management and access control systems.
Logos and trademarks shown above are the property of their respective owners. Their use here is for informational and illustrative purposes only.
BIOMETRIC SYSTEM MARKET SEGMENTS
Source: Secondary Research, Interviews with Experts, MarketsandMarkets Analysis
Biometric System Market, By Authentication Type
Multi-factor authentication is expected to record the highest CAGR as organizations increasingly adopt layered security frameworks. Combining biometrics with PINs, smart cards, or tokens enhances protection against spoofing and cyberattacks, making it essential for high-security environments such as banking, defense, and digital identity management systems.
Biometric System Market, By Offering
Software exhibits the highest CAGR, driven by the growing shift toward cloud-based biometric platforms and subscription models. The rise of multimodal authentication, mobile SDK integration, and continuous model updates is accelerating the demand for scalable, intelligent, and adaptive biometric software solutions worldwide.
Biometric System Market, By Mobility
Mobile biometric systems are projected to grow at the highest CAGR as the demand surges for mobile and field-deployable identity solutions. Their compact design and connectivity enable remote authentication for law enforcement, healthcare, and border control, supporting real-time identification in decentralized and on-the-go environments.
Biometric System Market, By Type
Contactless systems are anticipated to witness the highest CAGR as advancements in AI and sensor technologies enhance precision and response time. The adoption of 3D facial recognition, iris scanning, and voice biometrics in mobile devices and access control systems is rapidly expanding global deployment opportunities.
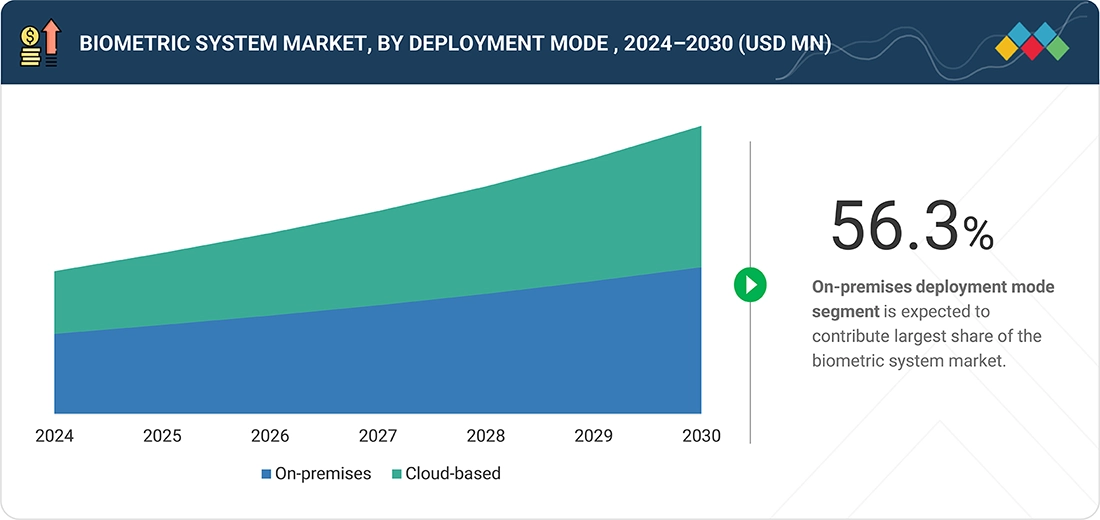
Biometric System Market, By Deployment Mode
Cloud-based biometric solutions are projected to register the highest CAGR owing to their scalability, cost efficiency, and flexibility. Growing demand for remote identity verification, SaaS-based authentication, and integration with digital platforms accelerates the adoption of cloud-hosted biometric services across multiple industries.
Biometric System Market, By Vertical
The healthcare sector is expected to exhibit the highest CAGR as hospitals and clinics adopt biometrics for patient identification, secure access, and electronic health record management. The shift toward contactless authentication and regulatory emphasis on data security are accelerating biometric integration in healthcare workflows globally.
REGION
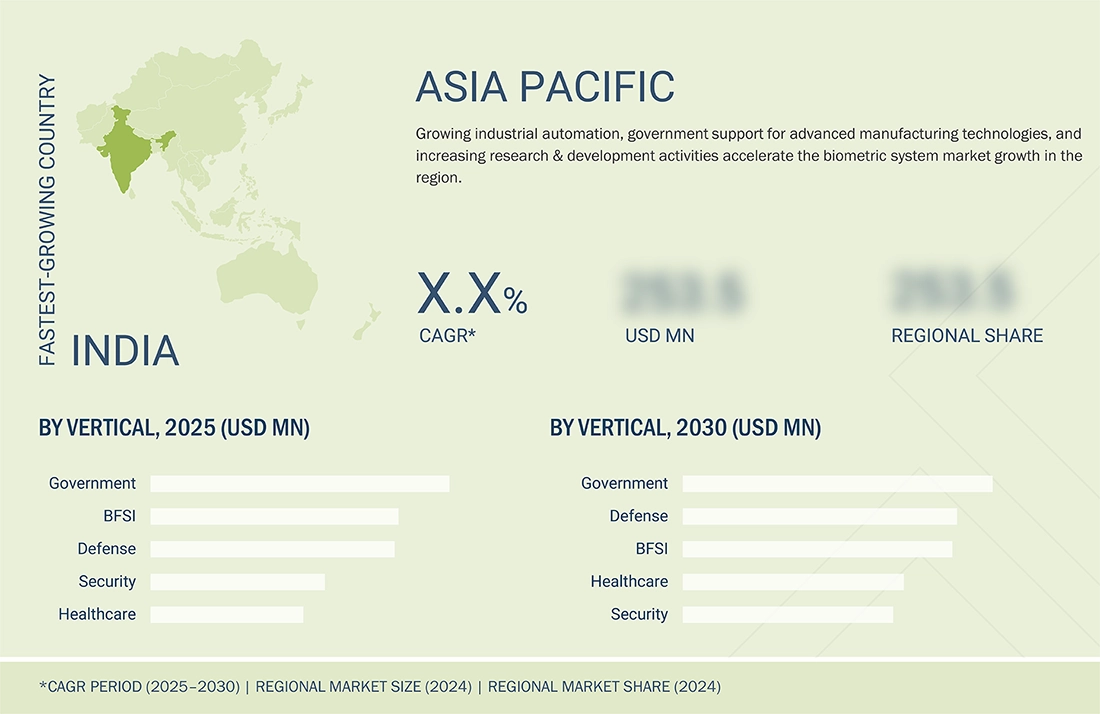
Asia Pacific to grow at the fastest rate in the global biometric system market during the forecast period
Asia Pacific is projected to register the highest CAGR from 2025 to 2030, driven by rapid digital transformation, expanding e-governance initiatives, and rising adoption of contactless authentication technologies. Increasing investment in smart cities, border management, and healthcare digitization continue to accelerate the biometric system adoption and technological advancements.
BIOMETRIC SYSTEM MARKET : COMPANY EVALUATION MATRIX
In the biometric systems market matrix, Thales (Star) leads with a strong global presence and a comprehensive biometric portfolio spanning fingerprint, facial, and iris recognition technologies. Its extensive integration in government ID programs, border control, and digital identity initiatives drives widespread adoption and market leadership. Qualcomm Technologies, Inc. (Emerging Leader) is rapidly gaining momentum through its innovative in-display fingerprint sensors and AI-powered mobile authentication solutions.
Source: Secondary Research, Interviews with Experts, MarketsandMarkets Analysis
BIOMETRIC SYSTEM MARKET KEY PLAYERS
BIOMETRIC SYSTEM MARKET SCOPE
| REPORT METRIC | DETAILS |
|---|---|
| Market Size in 2024 (Value) | USD 47.21 Billion |
| Market Forecast in 2030 (Value) | USD 95.14 Billion |
| Growth Rate | CAGR of 12.3% from 2025-2030 |
| Years Considered | 2021-2024 |
| Base Year | 2024 |
| Forecast Period | 2025-2030 |
| Units Considered | Value (USD Billion/Million) and Volume (Million Units) |
| Report Coverage | Revenue forecast, company ranking, competitive landscape, growth factors, and trends |
| Segments Covered |
|
| Regions Covered | North America, Europe, Asia Pacific, and RoW |
WHAT IS IN IT FOR YOU: Biometric System Market REPORT CONTENT GUIDE
DELIVERED CUSTOMIZATIONS
We have successfully delivered the following deep-dive customizations:
| CLIENT REQUEST | CUSTOMIZATION DELIVERED | VALUE ADDS |
|---|---|---|
| US-based Biometric Software Provider | Detailed competitor profiles in facial and iris recognition | End-user adoption mapping in consumer electronics and finance sectors |
| European-based Biometric Hardware Manufacturer | Benchmarking of industry applications across security and access control | Competitive portfolio analysis (10+ regional suppliers) |
| Asian-based Biometric Component Supplier | Global & regional production capacity | Pipelines of capacity expansions & new entrants |
| Government & Law Enforcement Biometric Integrator | Patent landscape & IP strength mapping in surveillance applications | Assessment of OEM adoption roadmaps |
| Banking & Financial Services Biometric Customer | Volume-demand forecasts across APAC | Competitive portfolio analysis (10+ regional suppliers) |
RECENT DEVELOPMENTS
- May 2024 : Precise Biometrics launched the next generation of Precise Biglive, featuring enhanced Al-driven liveness and anti-tempering capabilities with up to 50X performance and security improvement. This upgraded product strengthens security measures for high-risk environments by detecting spoofing attempts across fingerprint and palm modalities, complementing the existing BioMatch solution. The release expanded Precise Biometrics biometric system portfolio by offering advanced protection against identity theft and unauthorized access, catering to mobile devices, laptops, smart locks, and automotive applications.
- May 2024 : Aware's launch of the Awarel plug-in for WooCommerce enhanced biometric authentication capabilities in the online casino gambling and sports betting industries. This plug-in offers geofencing, age verification, and fraud prevention features, enabling quick implementation and a seamless user experience. It significantly strengthened compliance and security measures for online gaming platforms.
- April 2024 : Arxiz, Global Inc. launched Anxiz One, en All-in-One Intelligent Security Solution, at ISC West 2024. It is tailored for small and medium-sized businesses in sectors such as retail, education, and gyms. It integrates Al cameras, intelligent analytics, and edge and cloud infrastructure for enhanced security, cost-effective deployment, and simplified management. Key benefits include advanced threat detection, lower investment costs, and faster response times, setting a new standard for SMB security solutions.
- March 2024 : Precise Biometrics launched a new palm recognition product, expanding its biometric modality alongside fingerprint and facial recognition. This addition enhances their product suite, catering to broader customer needs and use cases across verticals. Integrating palm recognition into YOUNIQ Access and YOUΝΙΩ Visit strengthens Precise Biometrics portfolio by offering comprehensive biometric solutions, potentially increasing market adoption and sales.
- January 2024 : IDEMIA introduced Vision Pass SP, a new facial recognition access control solution that offers accurate and fair matching in under a second, even in various lighting conditions. The compact, eco-friendly device integrates advanced Al and facial recognition algorithms and robust security measures to prevent cyber-attacks. VisionBass SP maintains high-security standards while enhancing user experience.
Table of Contents
 Exclusive indicates content/data unique to MarketsandMarkets and not available with any competitors.
Methodology
The research process for this study included systematic gathering, recording, and analysis of data about customers and companies operating in the biometric system market. This process involved the extensive use of secondary sources, directories, and databases (Factiva and Oanda) to identify and collect valuable information for the comprehensive, technical, market-oriented, and commercial study of the Biometric systems market.
In-depth interviews were conducted with primary respondents, including experts from core and related industries and preferred manufacturers, to gather and verify critical qualitative and quantitative information and assess growth prospects. Key players in the biometric system market were identified through secondary research, and their market rankings were determined through primary and secondary research. This research involved studying the annual reports of top players and conducting interviews with key industry experts, including CEOs, directors, and marketing executives.
Secondary Research
Various sources were used in the secondary research process to identify and collect information crucial for this study. These include company annual reports, press releases, investor presentations, white papers, technology journals, certified publications, articles by recognized authors, directories, and databases. Secondary research was primarily used to gather key information about the industry’s value chain, the total pool of market players, market classification according to industry trends at the most detailed level, regional markets, and key developments from market and technology-oriented perspectives.
Primary Research
Primary research was conducted to identify the segmentation types, key players, competitive landscape, and key market dynamics, such as drivers, restraints, opportunities, challenges, and industry trends, along with key strategies adopted by players operating in the biometric system market. Extensive qualitative and quantitative analyses were performed on the complete market engineering process to list key information and insights throughout the report.
Extensive primary research has been conducted after acquiring knowledge about the biometric system market scenarios through secondary research. Several primary interviews have been conducted with experts from the demand and supply sides across four major geographic regions: North America, Europe, Asia Pacific, and RoW. Approximately 60% and 40% of the primary interviews were conducted from the supply and demand sides. These primary data have been collected through questionnaires, emails, and telephonic interviews.

Note: The three tiers of the companies have been defined based on their total/segmental revenue as of 2024: Tier 1 = >USD 1 billion, Tier 2 = USD 1 billion–USD 500 million, and Tier 3 = USD 500 million. ‘Others’ include sales, marketing, and product managers.
To know about the assumptions considered for the study, download the pdf brochure
Market Size Estimation
In the comprehensive market engineering process, the top-down and bottom-up approaches and several data triangulation methods were implemented to estimate and validate the size of the biometric system market and various other dependent submarkets. Key players in the market were identified through secondary research, and their market share in the respective regions was determined through primary and secondary research. This entire research methodology included the study of annual and financial reports of the top players and interviews with experts (CEOs, VPs, directors, and marketing executives) for key insights (quantitative and qualitative).
All percentage shares, splits, and breakdowns were determined using secondary sources and verified through primary sources. All the possible parameters that affect the markets covered in this research study were accounted for, viewed in detail, verified through primary research, and analyzed to obtain the final quantitative and qualitative data. This data was consolidated and supplemented with detailed inputs and analysis from MarketsandMarkets and presented in this report.
Biometric System Market: Top-Down and Bottom-Up Approach

Data Triangulation
After determining the overall market size through the market size estimation process, as explained above, the total market has been divided into several segments and subsegments. Market breakdown and data triangulation procedures have been employed to complete the overall market engineering process and obtain precise statistics for all segments and subsegments. The data have been triangulated by studying various factors and trends from the demand and supply sides. Along with this, the market has been validated using top-down and bottom-up approaches.
Market Definition
A biometric system is designed to authenticate or identify individuals based on their unique physiological or behavioral characteristics. These systems use biometric traits, such as fingerprints, facial features, iris patterns, voice, or behavioral patterns, to verify identity. By analyzing these traits, biometric systems provide a secure and reliable method for access control, identity verification, and data protection, enhancing security across various applications.
Key Stakeholders
- Hardware system integrators
- Software providers
- Raw material suppliers
- Original equipment manufacturers (OEMs) and systems integrators
- Research organizations and consulting companies
- Government bodies, such as regulating authorities and policymakers
- Venture capitalists and private equity firms
- Associations, organizations, and alliances
- End users (government, defense, healthcare, BFSI, consumer electronics, travel & immigration, automotive, and security)
Report Objectives
- To describe and forecast the size of the biometric system market, by authentication type, offering, mobility, type, deployment mode, and vertical, in terms of value
- To estimate the size of the biometric system market, by fingerprint sensor technology, in terms of volume
- To forecast the market for various segments with regard to four main regions: North America, Europe, Asia Pacific, and RoW, along with their respective countries, in terms of value
- To provide detailed information regarding the major factors, such as drivers, restraints, opportunities, and challenges, influencing the growth of the biometric system market
- To analyze the micromarkets with respect to individual growth trends, prospects, and contributions to the total market
- To study the complete supply chain and allied industry segments, and perform a value chain analysis of the biometric system landscape
- To strategically analyze the regulatory landscape, tariffs, standards, patents, Porter’s Five Forces, import and export scenarios, trade values, and case studies pertaining to the market under study
- To analyze the impact of AI/Gen AI and the 2025 US tariff impact and the macroeconomic outlook for regions covered under the study
- To analyze the opportunities in the market for various stakeholders by identifying the high-growth segments of the biometric system market
- To profile key players and comprehensively analyze their market position in terms of ranking and core competencies, along with detailing the competitive landscape for market leaders
- To analyze competitive developments, such as product launches, acquisitions, partnerships, and expansions, in the biometric system market
Customization Options
With the given market data, MarketsandMarkets offers customizations according to the company’s specific needs. The following customization options are available for the report:
Key Questions Addressed by the Report
1. What is the biometric system market?
The biometric system market refers to technologies that identify or authenticate individuals using unique biological or behavioral traits such as fingerprints, facial recognition, iris scans, voice patterns, and palm veins. These systems are widely used for identity verification, security, and access control across industries including government, banking, healthcare, and consumer electronics.
2. What is the expected growth of the biometric system market?
The global biometric system market is projected to grow from USD 53.22 billion in 2025 to USD 95.14 billion by 2030, at a CAGR of about 12.3%. This growth is driven by increasing demand for secure authentication solutions and rising adoption of digital identity technologies worldwide.
3. What are the key technologies used in biometric systems?
Biometric systems use several authentication technologies, including fingerprint recognition, facial recognition, iris scanning, voice recognition, palm vein scanning, signature recognition, gait analysis, and keystroke dynamics. These technologies enable accurate identification and help reduce identity fraud in digital and physical environments.
4. Which industries are adopting biometric technologies the most?
Major industries adopting biometric technologies include government, banking and financial services (BFSI), healthcare, consumer electronics, travel and immigration, automotive, and security sectors. Government and law enforcement agencies particularly use biometrics in national ID programs, border control, and law enforcement applications.
5. What are the key drivers of the biometric system market?
Key growth drivers include the increasing demand for secure digital identity verification, rising adoption of biometric-enabled smartphones and devices, and government initiatives for identity management and border security. The need for fraud prevention and secure authentication also contributes to market expansion.
Need a Tailored Report?
Customize this report to your needs
Get 10% FREE Customization
Customize This ReportPersonalize This Research
- Triangulate with your Own Data
- Get Data as per your Format and Definition
- Gain a Deeper Dive on a Specific Application, Geography, Customer or Competitor
- Any level of Personalization
Let Us Help You
- What are the Known and Unknown Adjacencies Impacting the Biometric System Market
- What will your New Revenue Sources be?
- Who will be your Top Customer; what will make them switch?
- Defend your Market Share or Win Competitors
- Get a Scorecard for Target Partners

Custom Market Research Services
We Will Customise The Research For You, In Case The Report Listed Above Does Not Meet With Your Requirements
Get 10% Free CustomisationTESTIMONIALS

Tetsuya Ohhira
Business Development Manager-Technology Business
Nikon Corporation,
Leading Japanese MNC specializing in optics and imaging productswww.nikon.com
MarketsandMarkets™ response
is quick. Their attitude is flexible and positive. Analyst Insights are globally considered and
significant. Client Services quickly respond to our inquiry and demand. Their wide range of global
surveys help us make our strategic plan.
We hope Knowledge Store will be easier to search
for a report.
VP - Marketing & Business Development
Leading Provider of Process Control Solutions
We engaged with MarketsandMarkets on a study to perform an analysis and recommend a Go-To-Market strategy for metrology and process control in the semiconductor market. The study was tailored to our targets and needs with well-defined milestones. Our overall experience with the MarketsandMarkets team was very good throughout the project in all aspects including the analysis methodologies used, the quality and depth of primary and secondary data sets, the professionalism and flexibility of the team and the ability to meet the target schedule and milestones. We want to thank MarketsandMarkets team for a job well done.
Growth opportunities and latent adjacency in Biometric System Market


Henri
Jul, 2019
I would like to understand the overall market scenario of biometric system market.
Daniel
Jul, 2014
With the inclusion of biometric authentication across various applications, there are various key revenue pockets that are emerging to further expand the biometric industry. Foe instance, biometric identification as a service is significantly growing with the inclusion of more smart devices and cloud based intelligence platform. Does the scope of the report covers biometric as a service market and further break it down with respect to the applications?.
Christopher
Apr, 2026
How are enterprises balancing ease of use versus security risks when relying heavily on single-factor authentication?.
Gary
Apr, 2026
What are the typical procurement cycles and decision criteria for government biometric projects?.
Gary
Apr, 2026
What are the typical procurement cycles and decision criteria for government biometric projects?.
Gary
Apr, 2026
What are the typical procurement cycles and decision criteria for government biometric projects?.
Sreekanth
Nov, 2017
Does this report provide detail analysis of India market including the usage of Indian data base to incorporate various applications and software.
Minkyung
Jan, 2017
"Software play a significant role in ensuring the interoperability and compatibility of biometric devices, particularly with feasibility to integrate add-on features in existing hardware by updating the software. So depending upon the usage with respect to different authentication technologies and applications we may further classify the software segment. I would like to understand wheather this report include different types of software used in biometric solutions an the market sizing for the same?".
Carl-Johan
May, 2016
Doe this report covers industry specific competitive analysis.
Sumeet
Mar, 2017
Although the market of biometric system is huge, it still projected to grow significantly as there is continuous shift towards implementing stringent security methods that replaces traditional identification methods with biometrics. At the same time, market can be distinguish on the basis of various parameters such as various modalities, applications, and offering. I would like to understand, how does this report help in launching a new business in biometric space by identifying most attractive hotbets..
User
Sep, 2019
Biometric authentication solution has tremendous demand in APAC. Growing adoption is largely attributed to increasing use cases, such as implementing facial recognition cameras and growing number of airports with biometric security chechpoints, in China for public safety. So, I would like to understnd the market in China for biometric solutions and how we can cater to it? Further, what are some of the hot bets in China where we can expand our business?.
John
Nov, 2016
I would like to understand the scope of the report.
Lori
Dec, 2018
Government agencies across the globe are increasingly using social media as a primary communication channel from communicating crisis to policy changes. For instance, US Department of State using YouTube to share press briefings or updating the citizens about a new regulation. Social media has made communication between citizens and government much easier. The government worldwide follows measures for data privacy such as high-tech encryption and multi-layered authentication. However, there are no stringent rules that prevent officials at government agencies from publishing the sensitive information online or data misuse. Does the report include data breaches and potential abuse of biometrics databases crossed against social media accounts by certain governments?.
Sam
Jun, 2015
Does this report covers in-depth analysis of companies involved in the biometric space along with detailed segmentation with respect to technology and application.
User
Sep, 2019
Software plays a significant role in ensuring interoperability and compatibility of biometric devices, particulary in terms of the feasibility to integrate add-on features in existing hardware by updating the software. So, depending upon usage, with respect to different authentication technologies and applications, we may further classify the software segment. I would like to understand whether this report includes different types of software used in bioetric solutions and the market sizing for the same..
Ravikanth
Sep, 2014
How does this report cover market for IT / ITES / BPO segment to position 2 Factor Authentication, Server Access Management and Single Sign-ON using biometric .
heidi
Sep, 2019
I would like to understand the commercial drivers and challenges associated with biometric system..
Maurice
Mar, 2016
I would like to understand the adoption of smart locks and biometrics in the space.
User
Sep, 2019
With the inclusion of biometric authentication across various applications, there are various key revenue pockets that are emerging in the biometric space. For instance, biometric identification as a service is witnessing significanlt growth, with the inclusion of more smart devices and cloud-based intelligence platform. Does the scope of the report cover bioetric as a service market? Also, can it further be broken down with respect to applications?.
Sergio
Oct, 2014
What�s difference of "Single User License" and "Corporate License"?.
Ben
Sep, 2018
Does the report include biometric system market for Middle East and Pakistan.
User
Sep, 2019
Government agencies across the globe are increasingly using social media as a primary communication channel�from communicating crisis to policy changes. For instance, the US Department of State using YouTube to share press briefings or updating the citizens about a new regulation. Social media has made communication between citizens and government much easier. The government worldwide follows measures for data privacy, such as hi-tech encryption and multi-layered authentication. However, there are no stringent rules that prevent data misuse or officials at government agencies from publishing sensitive information online. Does the report inculde data breaches and potential abuse of biometrics databases against social media accounts by certain governments?.
Alex
Jun, 2017
I would like to understand the market trends in biometric industry.
User
May, 2019
The market for biometric systems is huge and the continuous shift toward implementing strigent security methods to replace traditional identifoication methods with biometrics is expected to further propel the market. The market can be distinguished by parameters such as various modalities, applications, and offering. I would like to understand, how does this report help in launching a new business in the biometrics space by identifying most attractive hotbets?.
Claudia
May, 2015
Does this report provide specifics about next generation biometric .
Slobodan
Apr, 2015
I would like to understand the distinction of market based on single factor authentication .
Calvin
Apr, 2019
Biometric authentication solution has a tremendous demand in APAC countries. Growing adoption is largely attributed to the increasing use cases in China for public safety such as implementing facial recognition cameras and growing number of airports with biometric security checkpoints. So, I would like to understand the market in China for biometric solutions and how we can cater to it. Further, what are some of the hot bets in China where we can expand our business..
Kathleen
Feb, 2019
I would like to understand the used cases of biometric solutions for law and enforcement.