Aerogel Market

Aerogel Market by Type (Silica, Polymer, and Carbon), Form (Blanket, Panel, Particle, and Monolith), Processing (Virgin, Composites, and Additives), Application (Oil & Gas, Construction, Transportation, and Performance Coating) - Global Forecast to 2025

Report Code: CH 2967 Dec, 2020, by marketsandmarkets.com

Aerogel Market

The global aerogel market size was valued at USD 638 million in 2020 and is projected to reach USD 1045 million by 2025, growing at 10.4% cagr during the forecast period. The market is mainly driven by the rising demand for aerogel from the applications oil & gas, construction, transportation, performance coating, day-lightning & LVHS, and others. Factors such as super thermal resistance, thinner and lighter alternative will drive the aerogel market. North America is the key market for aerogel, globally, followed by Europe and Asia Pacific, in terms of volume and value.

Aerogel Market

To know about the assumptions considered for the study, Request for Free Sample Report

Impact of COVID-19 on Aerogel Market

In 2020, the outbreak of COVID-19 has impacted the global economy and demand scenario in major industries across the globe. The pandemic scenario has resulted in global lockdown and restriction in industrial operations, trade activities, disruption in supply-chain, and so on. The major end-use industries of aerogel, such as oil & gas, construction, transportation, and others, were also impacted during this scenario. Slump in oil price and delay in new installation in pipelines, less demand from the automotive sector, and a temporary halt in construction activities across the globe for a few months in 2020 have impacted the market. The high growth aerogel market is expected to witness relatively slower growth in 2020 as an outcome of slow demand from end-use industries. However, the market is recovering, and industries have started operations with reduced capacity and following government guidelines. All the end-use industries are expected to be fully operational from the beginning of 2021 and generate high demand for aerogel. Hence, the market is projected to record a high CAGR during the forecast period.

Aerogel Market Dynamics

Driver: Thinner and Lighter Alternative

Traditional insulation materials, such as polyurethane foam, mineral wool, rock wool, and stone wool have certain drawbacks. For example, thick layers of these materials are required to achieve the desired R-value, which result in loss of valuable floor space in case of new construction. For old buildings, it is even tougher to introduce high insulation level, as extra layers lead to changes in the esthetic appearance of a house. Hence, to fulfill energy standards set by various regulatory bodies and to avoid structural compromises in new constructions, aerogels are projected to be an ideal replacement for traditional insulation materials. Owing to their low thermal conductivity and less thickness, aerogel materials can save a substantial amount of energy, which otherwise would have been used for heating and cooling purposes. Aerogels are used for apparels in cold region, due to their properties, such as low weight and low thermal conductivity. They are also widely used for industrial insulation.

Restraints: High Manufacturing Cost

The high production cost of aerogel is one of the major restraints that affects the growth of the aerogel market. The production cost of silica aerogels is primarily linked to 3 main factors - high cost of raw materials (for alkoxide-based precursor materials), cumbersome process technologies (solvent exchange steps, long reaction times limited by diffusion), and the installation of relatively small production capacities of companies. The manufacturing of aerogel materials requires extensive R&D, which makes the entire process costly. Synthetic methods used to manufacture aerogel materials are not as versatile. Aerogel manufacturing requires a sophisticated facility, as the production mechanisms are highly specialized. The most expensive step in the aerogel manufacturing process is supercritical drying.

Opportunities: Potential Substitute for conventional Insulation material

Aerogels have significantly lower thermal conductivity (0.0004 W/m. K), which is 10 times lower than conventional insulation materials. The conduction through aerogels is made minimal by the solid structure and air molecules it possesses. Thus, the same insulation level (R-value) can be reached with a lesser volume of aerogel material than a conventional product, which results in valuable space savings. Usually, pores within the conventional insulation materials are found to be over 1mm in width and transfer energy via convection, but aerogel on the other side has pores as small as 20-40 nm.

Silica based aerogel is estimated to be the largest type in 2019.”

The method of synthesizing silica aerogel is economical, and the process is very versatile. Silica aerogels are best known for tremendously combining low thermal conductivity with high optical transparency. They are transparent; however, due to the Rayleigh scattering effect, they appear to be blue and are hence commonly called frozen smoke or blue smoke. The high insulating properties, low cost, abundant raw material availability, and the versatile process of manufacturing are driving the silica-based aerogel market. Silica is the first type of aerogel to be made commercially available. Silica aerogel materials are particularly intriguing due to their ultra-low weight and transparency. A visibly transparent super-insulating material is compatible for many applications.

Aerogel in blanket form is estimated to be the largest market in 2019

The blanket form is the largest segment of the aerogel market. It was the first form of commercial aerogel for various applications. The blanket material has a clear value proposition, as it is super insulating and two to three times better than particle material in terms of thermal properties. Blanket materials are used for a broad range of applications, such as oil & gas, construction, automotive, and marine and aerospace, as these can be cut and modified as per specific requirements due to their flexible physical structure.

Virgin aerogel is estimated to be the largest market in processing segment in 2019.”

As manufactured aerogels are called virgin aerogels - the original form of aerogel, which is not loaded with any other material or chemically treated to enhance its physical structure. The only drawback of virgin aerogels is that they are extremely brittle. Virgin aerogels are used in several applications, owing to their commercial availability in comparison to fabricated aerogels. Aerogel materials in the as manufactured segment are used directly in their original forms for applications, such as the use of silica aerogel in R&D. These aerogels are functional for industrial applications without any further processing or alterations and are used in the same form produced by aerogel manufacturers. Materials in this segment do not require additional manufacturing, compounding, coating, modification, or subsequent processing to be used in applications.

The oil & gas application is projected to account for the largest share, in terms of volume and value, of the overall aerogel market between 2020 and 2025.”

Fossil fuels play a vital role in meeting the ever-increasing demand for energy. Right from generating electricity to working of automobiles, fuels such as diesel and petrol are required in one or the other way. The oil & gas segment involves exploration, extraction, refining, and selling of products obtained from crude oil. The segment generates huge revenue making it one of the important components of the world’s economy. The investments required in this segment are also quite high, considering the lead times for finding and extracting hydrocarbons. The output needs to be carefully transported to the regasification sites through long pipelines. The whole procedure takes place in challenging environments, such as subsea pipelines and rigs in Arctic waters. For the uninterrupted flow of hydrocarbons, maintaining the temperature of these pipelines is important. Hence, the oil & gas industry heavily depends on insulation.

“North America is expected to be the largest aerogel market during the forecast period, in terms of value and volume.”

North America is the largest region in terms of production and consumption of aerogel materials. Globally, it is the leading aerogel market in terms of product innovation, quality, and application development. The North American aerogel market is largely driven by the oil & gas application, where the demand for advanced solutions is extremely high due to its reduced thickness, superior insulating properties, and low thermal conductivity. The growing use of aerogel materials in the automotive, marine, and aerospace applications in North America is expected to drive the aerogel market.


Aerogel Market by Region

To know about the assumptions considered for the study, download the pdf brochure

Europe is expected to be the second largest aerogel market during the forecast period.

The demand for aerogel in Europe is estimated to increase with the on-going recovery initiatives, energy efficiency, and insulation regulations in the region. The demand is mainly driven by Western European countries, such as Germany, the UK, France, and Sweden. Stringent energy conservation regulations in various industries, such as oil & gas, construction, and residential housings, are fueling the demand for advanced insulation materials, thus driving the demand for aerogels in the region. Lightweight and high-performance materials are required for high-end automotive and other industrial sectors that also contribute to the growing aerogel market. The European aerogel market is mainly led by Cabot Corporation’s operations in the region.

Aerogel Market by Region

Aerogel Market Players

The key market players profiled in the report include Aspen Aerogels (US), Cabot Corporation (US), Aerogel Technologies (US), Nano tech Co. Ltd. (China), Armacell (Germany), Guangdong Alison Hi-Tech (China), Active Aerogels (Portugal), Enersens (France), JIOS Aerogel (South Korea), and BASF (Germany).

The Aerogel Technologies (US) is also one of the leading suppliers of aerogel. It caters to the demand for aerogel products in North America, Europe, and APAC. It has a strong foothold in the markets in APAC, North America, and Europe. It The company has developed a new manufacturing technology that enables the production of aerogels with the durability of plastics in theoretically unlimited dimensions. This technology can enable aerogels to be used as a lightweight structural material for a wide variety of application. Armacell (Germany) launched its industrial-scale aerogel line at its new plant in Cheonan, South Korea. This development can increase the annual production of aerogel-based insulation products from 250,000 m2 to 750,000 m2.

Aerogel Market Report Scope

Report Metric

Details

Market Size Value in 2020

USD 638 million

Revenue Forecast in 2025

USD 1,045 million

CAGR

10.4%

Years considered for the study

2018-2025

Base Year

2019

Forecast period

2020–2025

Units considered

Volume (Tons); Value (USD Million)

Segments

Type, Form, Processing, Application, and Region

Regions

APAC, North America, Europe, Middle East & Africa, and South America

Companies

Aspen Aerogels (US), Cabot Corporation (US), Aerogel Technologies (US), Nano tech Co. Ltd. (China), Armacell (Germany), Guangdong Alison Hi-Tech (China), Active Aerogels (Portugal), Enersens (France), JIOS Aerogel (South Korea), and BASF (Germany)

This report categorizes the global aerogel market based on type, form, processing, application, and region.

Based on Type:

  • Silica
  • Polymer
  • Carbon
  • Others
    • Metals
    • Metal Oxide
    • Metal Chalcogenides

Based on Form:

  • Blanket
  • Panel
  • Particle
  • Monolith

Based on Processing:

  • As Manufactured (Virgin)
  • Composites
  • Additives

Based on Application:

  • Oil & Gas
  • Construction
  • Transportation
    • Automotive
    • Marine
    • Aerospace
  • Performance Coating
  • Day-Lighting & LVHS
  • Others
    • Pharmaceuticals
    • Industrial & Cryogenics

Based on region:

  • APAC
  • North America
  • Europe
  • Middle East & Arica
  • South America

Frequently Asked Questions (FAQ):

To speak to our analyst for a discussion on the above findings, click Speak to Analyst


TABLE OF CONTENTS

1 INTRODUCTION (Page No. - 27)
    1.1 OBJECTIVES OF THE STUDY
    1.2 MARKET DEFINITION
           1.2.1 AEROGEL MARKET: INCLUSIONS & EXCLUSIONS
           1.2.2 AEROGEL: MARKET DEFINITION AND INCLUSIONS, BY TYPE
           1.2.3 AEROGEL: MARKET DEFINITION AND INCLUSIONS, BY FORM
           1.2.4 AEROGEL: MARKET DEFINITION AND INCLUSIONS, BY PROCESSING
           1.2.5 AEROGEL: MARKET DEFINITION AND INCLUSIONS, BY APPLICATION
    1.3 MARKET SCOPE
           1.3.1 YEARS CONSIDERED FOR THE STUDY
    1.4 CURRENCY
    1.5 UNIT CONSIDERED
    1.6 STAKEHOLDERS
    1.7 SUMMARY OF CHANGES

2 RESEARCH METHODOLOGY (Page No. - 32)
    2.1 BASE NUMBER CALCULATION
           2.1.1 SUPPLY-SIDE APPROACH
           2.1.2 DEMAND-SIDE APPROACH
    2.2 FORECAST NUMBER CALCULATION
           2.2.1 SUPPLY SIDE
           2.2.2 DEMAND SIDE
    2.3 RESEARCH DATA
           2.3.1 SECONDARY DATA
           2.3.2 PRIMARY DATA
                    2.3.2.1 Primary interviews – demand and supply side
                    2.3.2.2 Breakdown of primary interviews
                    2.3.2.3 Key industry insights
    2.4 MARKET SIZE ESTIMATION
           2.4.1 BOTTOM-UP APPROACH
                    FIGURE 1 AEROGEL MARKET: BOTTOM-UP APPROACH
           2.4.2 TOP-DOWN APPROACH
                    FIGURE 2 AEROGEL MARKET: TOP-DOWN APPROACH
    2.5 DATA TRIANGULATION
          FIGURE 3 AEROGEL MARKET: DATA TRIANGULATION
    2.6 FACTOR ANALYSIS
          FIGURE 4 COVID-19 FACTORS IMPACTING GROWTH OF AEROGEL MARKET
    2.7 ASSUMPTIONS
    2.8 LIMITATIONS & RISKS ASSOCIATED WITH AEROGEL MARKET

3 EXECUTIVE SUMMARY (Page No. - 40)
    FIGURE 5 SILICA SEGMENT TO LEAD AEROGEL MARKET
    FIGURE 6 OIL & GAS TO DOMINATE AEROGEL MARKET DURING FORECAST PERIOD
    FIGURE 7 PARTICLE TO BE THE FASTEST-GROWING SEGMENT OF AEROGEL MARKET DURING FORECAST PERIOD
    FIGURE 8 ASIA PACIFIC TO BE FASTEST-GROWING AEROGEL MARKET BETWEEN 2020 AND 2025

4 PREMIUM INSIGHTS (Page No. - 44)
    4.1 ATTRACTIVE OPPORTUNITIES IN THE AEROGEL MARKET
          FIGURE 9 AEROGEL MARKET TO REGISTER HIGH CAGR BETWEEN 2020 AND 2025
    4.2 AEROGEL MARKET, BY PROCESSING
          FIGURE 10 COMPOSITE TO BE FASTEST-GROWING SEGMENT DURING THE FORECAST PERIOD
    4.3 NORTH AMERICA: AEROGEL MARKET, BY APPLICATION AND COUNTRY
          FIGURE 11 US ACCOUNTED FOR THE LARGEST SHARE IN NORTH AMERICAN AEROGEL MARKET IN 2019
    4.4 AEROGEL MARKET SHARE, BY APPLICATION
          FIGURE 12 OIL & GAS SEGMENT ACCOUNTED FOR LARGEST MARKET SHARE IN 2019
    4.5 AEROGEL MARKET GROWTH, BY REGION
          FIGURE 13 ASIA PACIFIC TO WITNESS HIGHEST CAGR DURING FORECAST PERIOD
    4.6 AEROGEL MARKET ATTRACTIVENESS, BY KEY COUNTRIES
          FIGURE 14 COUNTRIES IN ASIA PACIFIC REGION TO WITNESS HIGH GROWTH BETWEEN 2020 AND 2025

5 MARKET OVERVIEW (Page No. - 47)
    5.1 INTRODUCTION
    5.2 MARKET DYNAMICS
          FIGURE 15 DRIVERS, RESTRAINTS, AND OPPORTUNITIES IN AEROGEL MARKET
           5.2.1 DRIVERS
                    5.2.1.1 Superior thermal resistance
                                TABLE 1 THERMAL CONDUCTIVITY OF DIFFERENT INSULATION MATERIALS
                    5.2.1.2 Thinner and lighter alternative
                    5.2.1.3 Environment-friendly material
                    5.2.1.4 Demand from construction application
           5.2.2 RESTRAINTS
                    5.2.2.1 High manufacturing costs
                    5.2.2.2 Poor mechanical strength
           5.2.3 OPPORTUNITIES
                    5.2.3.1 Potential substitute for conventional insulation materials
                    5.2.3.2 New applications in apparel market
                    5.2.3.3 Growing applications in day-lighting segment
                                TABLE 2 DAY-LIGHTING: SYSTEMS AND BENEFITS OF AEROGEL
                    5.2.3.4 Growing demand from aviation industry
                    5.2.3.5 Enormous demand from LVHS segment
    5.3 PORTER’S FIVE FORCES ANALYSIS
          FIGURE 16 PORTER’S FIVE FORCES ANALYSIS
           5.3.1 THREAT OF NEW ENTRANTS
           5.3.2 THREAT OF SUBSTITUTES
           5.3.3 BARGAINING POWER OF SUPPLIERS
           5.3.4 BARGAINING POWER OF BUYERS
           5.3.5 INTENSITY OF COMPETITIVE RIVALRY
    5.4 SUPPLY CHAIN ANALYSIS
          FIGURE 17 AEROGEL MARKET: SUPPLY CHAIN ANALYSIS
    5.5 PRICE ANALYSIS OF AEROGEL
          FIGURE 18 PRICE ANALYSIS OF AEROGEL
    5.6 AEROGEL MARKET SCENARIOS, 2018-2025
          FIGURE 19 AEROGEL MARKET: REALISTIC, OPTIMISTIC, AND PESSIMISTIC SCENARIOS
    5.7 PATENT ANALYSIS
           5.7.1 APPROACH
           5.7.2 DOCUMENT TYPE
                    FIGURE 20 PATENTS REGISTERED FOR AEROGEL, 2015-2020
                    FIGURE 21 PATENTS PUBLICATION TRENDS FOR AEROGEL, 2015-2020
           5.7.3 JURISDICTION ANALYSIS
                    FIGURE 22 MAXIMUM PATENTS FILED BY COMPANIES IN CHINA
           5.7.4 TOP APPLICANTS
                    FIGURE 23 LG CHEMICAL LTD. REGISTERED MAXIMUM NUMBER OF PATENTS BETWEEN 2015 AND 2020
    5.8 AEROGEL: ECOSYSTEM
          FIGURE 24 AEROGEL MARKET ECOSYSTEM
    5.9 CHANGE IN INDUSTRY SHIFT IMPACTING FUTURE REVENUE MIX
    5.10 MACROECONOMIC OVERVIEW
           5.10.1 OIL & GAS
                     TABLE 3 OIL PRODUCTION IN ASIA PACIFIC, 2019 (000’BARREL/DAY)
                     TABLE 4 OIL PRODUCTION IN NORTH AMERICA, 2019 (000’BARREL/DAY)
                     TABLE 5 OIL PRODUCTION IN EUROPE, 2019 (000’BARREL/DAY)
                     TABLE 6 OIL PRODUCTION IN SOUTH AMERICA, 2019 (000’BARREL/DAY)
                     TABLE 7 OIL PRODUCTION IN MIDDLE EAST & AFRICA, 2019 (000’BARREL/DAY)
           5.10.2 AUTOMOTIVE
                     TABLE 8 MOTOR VEHICLE PRODUCTION, 2019 (UNITS)
    5.11 CASE STUDIES
    5.12 REGULATORY FRAMEWORK
           5.12.1 COMPLIANCE IMPOSED ON AEROGEL PRODUCTS IMPORTED FROM CHINA BY US
           5.12.2 ADVISORY CIRCULAR FROM FEDERAL AVIATION ADMIRATION, US
           5.12.3 EU REACH CHEMICAL POLICY: AEROGEL
    5.13 TRADE DATA STATISTICS
           5.13.1 IMPORT OF AEROGEL: INDIA
           5.13.2 IMPORT OF AEROGEL: BRAZIL
    5.14 TECHNOLOGY ANALYSIS
           5.14.1 SOL-GEL PROCESS
           5.14.2 NANO COMPOSITING
           5.14.3 SUPER CRITICAL DRYING
           5.14.4 STELMOR PROCESS
    5.15 COVID-19 IMPACT
           5.15.1 INTRODUCTION
           5.15.2 COVID-19 HEALTH ASSESSMENT
                     FIGURE 25 COUNTRY-WISE SPREAD OF COVID-19
           5.15.3 COVID-19 ECONOMIC ASSESSMENT
                     FIGURE 26 REVISED GDP FORECASTS FOR SELECT G20 COUNTRIES IN 2020
                    5.15.3.1 Impact of COVID-19 on economy—scenario assessment
                                 FIGURE 27 CRITERIA IMPACTING GLOBAL ECONOMY
                                 FIGURE 28 SCENARIOS OF COVID-19 IMPACT

6 AEROGEL MARKET, BY TYPE (Page No. - 75)
    6.1 INTRODUCTION
          FIGURE 29 SILICA SEGMENT TO DOMINATE AEROGEL MARKET DURING THE FORECAST PERIOD
          TABLE 9 AEROGEL MARKET SIZE, BY TYPE, 2016-2019 (USD MILLION)
          TABLE 10 AEROGEL MARKET SIZE, BY TYPE, 2020–2025 (USD MILLION)
          TABLE 11 AEROGEL MARKET SIZE, BY TYPE, 2016-2019 (TON)
          TABLE 12 AEROGEL MARKET SIZE, BY TYPE, 2020–2025 (TON)
    6.2 SILICA AEROGEL
          TABLE 13 PROPERTIES OF SILICA AEROGEL
    6.3 POLYMER AEROGEL
          TABLE 14 PROPERTIES OF ORGANIC POLYMER AEROGEL
          TABLE 15 BENEFITS AND APPLICATIONS OF POLYIMIDE AEROGEL
    6.4 CARBON AEROGEL
          TABLE 16 PROPERTIES OF CARBON AEROGEL
    6.5 OTHERS
          TABLE 17 OTHER TYPES OF AEROGEL
           6.5.1 METAL OXIDE AEROGEL
                    TABLE 18 COLORS OF METAL OXIDE AEROGELS
                    TABLE 19 PROPERTIES OF METAL OXIDE AEROGEL
           6.5.2 METAL CHALCOGENIDES AEROGELS
                    TABLE 20 PROPERTIES OF METAL CHALCOGENIDE AEROGEL
           6.5.3 METAL AEROGEL
                    TABLE 21 PROPERTIES OF METAL AEROGEL

7 AEROGEL MARKET, BY FORM (Page No. - 83)
    7.1 INTRODUCTION
          FIGURE 30 PARTICLE SEGMENT TO WITNESS HIGHEST CAGR DURING THE FORECAST PERIOD
          TABLE 22 AEROGEL MARKET SIZE, BY FORM, 2016-2019 (USD MILLION)
          TABLE 23 AEROGEL MARKET SIZE, BY FORM, 2020–2025 (USD MILLION)
          TABLE 24 AEROGEL MARKET SIZE, BY FORM, 2016-2019 (TON)
          TABLE 25 AEROGEL MARKET SIZE, BY FORM, 2020–2025 (TON)
    7.2 BLANKET
          TABLE 26 ADVANTAGES OF AEROGEL BLANKET FORM
    7.3 PARTICLE
    7.4 PANEL
          TABLE 27 ADVANTAGES OF AEROGEL PANEL FORM
    7.5 MONOLITH

8 AEROGEL MARKET, BY PROCESSING (Page No. - 88)
    8.1 INTRODUCTION
          FIGURE 31 AS MANUFACTURED (VIRGIN AEROGEL) SEGMENT TO ACCOUNT FOR LARGEST SHARE DURING THE FORECAST PERIOD
          TABLE 28 AEROGEL MARKET SIZE, BY PROCESSING, 2016-2019 (USD MILLION)
          TABLE 29 AEROGEL MARKET SIZE, BY PROCESSING, 2020–2025 (USD MILLION)
          TABLE 30 AEROGEL MARKET SIZE, BY PROCESSING, 2016-2019 (TON)
          TABLE 31 AEROGEL MARKET SIZE, BY PROCESSING, 2020–2025 (TON)
    8.2 AS MANUFACTURED (VIRGIN AEROGELS)
    8.3 COMPOSITES
    8.4 ADDITIVES

9 AEROGEL MARKET, BY APPLICATION (Page No. - 92)
    9.1 INTRODUCTION
          FIGURE 32 OIL & GAS APPLICATION TO DOMINATE THE AEROGEL MARKET DURING THE FORECAST PERIOD
          TABLE 32 AEROGEL MARKET SIZE, BY APPLICATION, 2016-2019 (USD MILLION)
          TABLE 33 AEROGEL MARKET SIZE, BY APPLICATION, 2020–2025 (USD MILLION)
          TABLE 34 AEROGEL MARKET SIZE, BY APPLICATION, 2016-2019 (TON)
          TABLE 35 AEROGEL MARKET SIZE, BY APPLICATION, 2020–2025 (TON)
    9.2 OIL & GAS
          TABLE 36 ADVANTAGES OF AEROGEL IN OIL & GAS APPLICATION
          FIGURE 33 NORTH AMERICA TO BE THE LARGEST AEROGEL MARKET IN OIL & GAS APPLICATION DURING THE FORECAST PERIOD
          TABLE 37 AEROGEL MARKET SIZE IN OIL & GAS, BY REGION, 2016-2019 (USD MILLION)
          TABLE 38 AEROGEL MARKET SIZE IN OIL & GAS, BY REGION, 2020–2025 (USD MILLION)
          TABLE 39 AEROGEL MARKET SIZE IN OIL & GAS, BY REGION, 2016-2019 (TON)
          TABLE 40 AEROGEL MARKET SIZE IN OIL & GAS, BY REGION, 2020–2025 (TON)
    9.3 CONSTRUCTION
          TABLE 41 ADVANTAGES OF AEROGEL IN CONSTRUCTION APPLICATION
          FIGURE 34 ASIA PACIFIC TO BE THE FASTEST-GROWING AEROGEL MARKET IN CONSTRUCTION APPLICATION
          TABLE 42 AEROGEL MARKET SIZE IN CONSTRUCTION, BY REGION, 2016-2019 (USD MILLION)
          TABLE 43 AEROGEL MARKET SIZE IN CONSTRUCTION, BY REGION, 2020–2025 (USD MILLION)
          TABLE 44 AEROGEL MARKET SIZE IN CONSTRUCTION, BY REGION, 2016-2019 (TON)
          TABLE 45 AEROGEL MARKET SIZE IN CONSTRUCTION, BY REGION, 2020–2025 (TON)
    9.4 TRANSPORTATION
           9.4.1 AEROSPACE
           9.4.2 AUTOMOTIVE
           9.4.3 MARINE
                    TABLE 46 AEROGEL APPLICATIONS IN TRANSPORTATION
                    FIGURE 35 EUROPE TO BE SECOND-LARGEST AEROGEL MARKET IN TRANSPORTATION APPLICATION DURING
                    TABLE 47 AEROGEL MARKET SIZE IN TRANSPORTATION, BY REGION, 2016-2019 (USD MILLION)
                    TABLE 48 AEROGEL MARKET SIZE IN TRANSPORTATION, BY REGION, 2020–2025 (USD MILLION)
                    TABLE 49 AEROGEL MARKET SIZE IN TRANSPORTATION, BY REGION, 2016-2019 (TON)
                    TABLE 50 AEROGEL MARKET SIZE IN TRANSPORTATION, BY REGION, 2020–2025 (TON)
    9.5 PERFORMANCE COATING
          FIGURE 36 NORTH AMERICA TO ACCOUNT FOR LARGEST SHARE IN AEROGEL MARKET IN PERFORMANCE COATING APPLICATION
          TABLE 51 AEROGEL MARKET SIZE IN PERFORMANCE COATING, BY REGION, 2016-2019 (USD MILLION)
          TABLE 52 AEROGEL MARKET SIZE IN PERFORMANCE COATING, BY REGION, 2020–2025 (USD MILLION)
          TABLE 53 AEROGEL MARKET SIZE IN PERFORMANCE COATING, BY REGION, 2016-2019 (TON)
          TABLE 54 AEROGEL MARKET SIZE IN PERFORMANCE COATING, BY REGION, 2020–2025 (TON)
    9.6 DAY-LIGHTING & LVHS
          FIGURE 37 EUROPE TO BE SECOND-LARGEST AEROGEL MARKET IN DAY-LIGHTING & LVHS APPLICATION
          TABLE 55 AEROGEL MARKET SIZE IN DAY-LIGHTING & LVHS, BY REGION, 2016-2019 (USD MILLION)
          TABLE 56 AEROGEL MARKET SIZE IN DAY-LIGHTING & LVHS, BY REGION, 2020–2025 (USD MILLION)
          TABLE 57 AEROGEL MARKET SIZE IN DAY-LIGHTING & LVHS, BY REGION, 2016-2019 (TON)
          TABLE 58 AEROGEL MARKET SIZE IN DAY-LIGHTING & LVHS, BY REGION, 2020–2025 (TON)
    9.7 OTHERS
          FIGURE 38 EUROPE ACCOUNTED FOR SECOND LARGEST SHARE IN AEROGEL MARKET FOR OTHER APPLICATIONS
          TABLE 59 AEROGEL MARKET SIZE IN OTHER APPLICATIONS, BY REGION, 2016-2019 (USD MILLION)
          TABLE 60 AEROGEL MARKET SIZE IN OTHER APPLICATIONS, BY REGION, 2020–2025 (USD MILLION)
          TABLE 61 AEROGEL MARKET SIZE IN OTHER APPLICATIONS, BY REGION, 2016-2019 (TON)
          TABLE 62 AEROGEL MARKET SIZE IN OTHER APPLICATIONS, BY REGION, 2020–2025 (TON)

10 AEROGEL MARKET, BY REGION (Page No. - 110)
     10.1 INTRODUCTION
             FIGURE 39 NORTH AMERICA TO DOMINATE AEROGEL MARKET DURING THE FORECAST PERIOD
             TABLE 63 AEROGEL MARKET SIZE, BY REGION, 2016-2019 (USD MILLION)
             TABLE 64 AEROGEL MARKET SIZE, BY REGION, 2020–2025 (USD MILLION)
             TABLE 65 AEROGEL MARKET SIZE, BY REGION, 2016-2019 (TON)
             TABLE 66 AEROGEL MARKET SIZE, BY REGION, 2020–2025 (TON)
     10.2 NORTH AMERICA
             FIGURE 40 NORTH AMERICA AEROGEL MARKET: SNAPSHOT
             TABLE 67 NORTH AMERICA AEROGEL MARKET SIZE, BY COUNTRY, 2016-2019 (USD MILLION)
             TABLE 68 NORTH AMERICA AEROGEL MARKET SIZE, BY COUNTRY, 2020–2025 (USD MILLION)
             TABLE 69 NORTH AMERICA AEROGEL MARKET SIZE, BY COUNTRY, 2016-2019 (TON)
             TABLE 70 NORTH AMERICA AEROGEL MARKET SIZE, BY COUNTRY, 2020–2025 (TON)
             TABLE 71 NORTH AMERICA AEROGEL MARKET SIZE, BY APPLICATION, 2016-2019 (USD MILLION)
             TABLE 72 NORTH AMERICA AEROGEL MARKET SIZE, BY APPLICATION, 2020–2025 (USD MILLION)
             TABLE 73 NORTH AMERICA AEROGEL MARKET SIZE, BY APPLICATION, 2016-2019 (TON)
             TABLE 74 NORTH AMERICA AEROGEL MARKET SIZE, BY APPLICATION, 2020–2025 (TON)
             10.2.1 US
                        10.2.1.1 Emergence of electric vehicle to increase demand for aerogels
                                     TABLE 75 US AEROGEL MARKET SIZE, BY APPLICATION, 2016-2019 (USD THOUSAND)
                                     TABLE 76 US AEROGEL MARKET SIZE, BY APPLICATION, 2020–2025 (USD THOUSAND)
                                     TABLE 77 US AEROGEL MARKET SIZE, BY APPLICATION, 2016-2019 (TON)
                                     TABLE 78 US AEROGEL MARKET SIZE, BY APPLICATION, 2020–2025 (TON)
             10.2.2 CANADA
                        10.2.2.1 Cold climatic condition to support market growth in different applications
                                     TABLE 79 CANADA AEROGEL MARKET SIZE, BY APPLICATION, 2016-2019 (USD THOUSAND)
                                     TABLE 80 CANADA AEROGEL MARKET SIZE, BY APPLICATION, 2020–2025 (USD THOUSAND)
                                     TABLE 81 CANADA AEROGEL MARKET SIZE, BY APPLICATION, 2016-2019 (TON)
                                     TABLE 82 CANADA AEROGEL MARKET SIZE, BY APPLICATION, 2020–2025 (TON)
             10.2.3 MEXICO
                        10.2.3.1 Developing automotive industry to propel aerogel market
                                     TABLE 83 MEXICO AEROGEL MARKET SIZE, BY APPLICATION, 2016-2019 (USD THOUSAND)
                                     TABLE 84 MEXICO AEROGEL MARKET SIZE, BY APPLICATION, 2020–2025 (USD THOUSAND)
                                     TABLE 85 MEXICO AEROGEL MARKET SIZE, BY APPLICATION, 2016-2019 (TON)
                                     TABLE 86 MEXICO AEROGEL MARKET SIZE, BY APPLICATION, 2020–2025 (TON)
     10.3 ASIA PACIFIC
             FIGURE 41 ASIA PACIFIC AEROGEL MARKET: SNAPSHOT
             TABLE 87 ASIA PACIFIC AEROGEL MARKET SIZE, BY COUNTRY, 2016-2019 (USD MILLION)
             TABLE 88 ASIA PACIFIC AEROGEL MARKET SIZE, BY COUNTRY, 2020–2025 (USD MILLION)
             TABLE 89 ASIA PACIFIC AEROGEL MARKET SIZE, BY COUNTRY, 2016-2019 (TON)
             TABLE 90 ASIA PACIFIC AEROGEL MARKET SIZE, BY COUNTRY, 2020–2025 (TON)
             TABLE 91 ASIA PACIFIC AEROGEL MARKET SIZE, BY APPLICATION, 2016-2019 (USD MILLION)
             TABLE 92 ASIA PACIFIC AEROGEL MARKET SIZE, BY APPLICATION, 2020–2025 (USD MILLION)
             TABLE 93 ASIA PACIFIC AEROGEL MARKET SIZE, BY APPLICATION, 2016-2019 (TON)
             TABLE 94 ASIA PACIFIC AEROGEL MARKET SIZE, BY APPLICATION, 2020–2025 (TON)
             10.3.1 CHINA
                        10.3.1.1 Increasing investment in oil & gas companies to boost demand
                                     TABLE 95 CHINA AEROGEL MARKET SIZE, BY APPLICATION, 2016-2019 (USD THOUSAND)
                                     TABLE 96 CHINA AEROGEL MARKET SIZE, BY APPLICATION, 2020–2025 (USD THOUSAND)
                                     TABLE 97 CHINA AEROGEL MARKET SIZE, BY APPLICATION, 2016-2019 (TON)
                                     TABLE 98 CHINA AEROGEL MARKET SIZE, BY APPLICATION, 2020–2025 (TON)
             10.3.2 JAPAN
                        10.3.2.1 Established automotive sector to augment market growth
                                     TABLE 99 JAPAN AEROGEL MARKET SIZE, BY APPLICATION, 2016-2019 (USD THOUSAND)
                                     TABLE 100 JAPAN AEROGEL MARKET SIZE, BY APPLICATION, 2020–2025 (USD THOUSAND)
                                     TABLE 101 JAPAN AEROGEL MARKET SIZE, BY APPLICATION, 2016-2019 (TON)
                                     TABLE 102 JAPAN AEROGEL MARKET SIZE, BY APPLICATION, 2020–2025 (TON)
             10.3.3 SOUTH KOREA
                        10.3.3.1 Oil & gas sector to offer opportunities for aerogel manufacturers
                                     TABLE 103 SOUTH KOREA AEROGEL MARKET SIZE, BY APPLICATION, 2016-2019 (USD THOUSAND)
                                     TABLE 104 SOUTH KOREA AEROGEL MARKET SIZE, BY APPLICATION, 2020–2025 (USD THOUSAND)
                                     TABLE 105 SOUTH KOREA AEROGEL MARKET SIZE, BY APPLICATION, 2016-2019 (TON)
                                     TABLE 106 SOUTH KOREA AEROGEL MARKET SIZE, BY APPLICATION, 2020–2025 (TON)
             10.3.4 INDIA
                        10.3.4.1 Rapid industrialization to drive market
                                     FIGURE 42 INDIA: AEROGEL MARKET SIZE, 2016–2025
             10.3.5 AUSTRALIA
                        10.3.5.1 Increasing awareness of advantages over traditional insulation materials
                                     FIGURE 43 AUSTRALIA: AEROGEL MARKET SIZE, 2016–2025
     10.4 EUROPE
             FIGURE 44 EUROPE AEROGEL MARKET: SNAPSHOT
             TABLE 107 EUROPE AEROGEL MARKET SIZE, BY COUNTRY, 2016-2019 (USD MILLION)
             TABLE 108 EUROPE AEROGEL MARKET SIZE, BY COUNTRY, 2020–2025 (USD MILLION)
             TABLE 109 EUROPE AEROGEL MARKET SIZE, BY COUNTRY, 2016-2019 (TON)
             TABLE 110 EUROPE AEROGEL MARKET SIZE, BY COUNTRY, 2020–2025 (TON)
             TABLE 111 EUROPE AEROGEL MARKET SIZE, BY APPLICATION, 2016-2019 (USD MILLION)
             TABLE 112 EUROPE AEROGEL MARKET SIZE, BY APPLICATION, 2020–2025 (USD MILLION)
             TABLE 113 EUROPE AEROGEL MARKET SIZE, BY APPLICATION, 2016-2019 (TON)
             TABLE 114 EUROPE AEROGEL MARKET SIZE, BY APPLICATION, 2020–2025 (TON)
             10.4.1 GERMANY
                        10.4.1.1 Established automotive industry to support market growth
                                     TABLE 115 GERMANY AEROGEL MARKET SIZE, BY APPLICATION, 2016-2019 (USD THOUSAND)
                                     TABLE 116 GERMANY AEROGEL MARKET SIZE, BY APPLICATION, 2020–2025 (USD THOUSAND)
                                     TABLE 117 GERMANY AEROGEL MARKET SIZE, BY APPLICATION, 2016-2019 (TON)
                                     TABLE 118 GERMANY AEROGEL MARKET SIZE, BY APPLICATION, 2020–2025 (TON)
             10.4.2 UK
                        10.4.2.1 Regulations in construction industry to generate more demand
                                     TABLE 119 UK AEROGEL MARKET SIZE, BY APPLICATION, 2016-2019 (USD THOUSAND)
                                     TABLE 120 UK AEROGEL MARKET SIZE, BY APPLICATION, 2020–2025 (USD THOUSAND)
                                     TABLE 121 UK AEROGEL MARKET SIZE, BY APPLICATION, 2016-2019 (TON)
                                     TABLE 122 UK AEROGEL MARKET SIZE, BY APPLICATION, 2020–2025 (TON)
             10.4.3 SWEDEN
                        10.4.3.1 Regulatory insulation standards to drive the market
                                     TABLE 123 SWEDEN AEROGEL MARKET SIZE, BY APPLICATION, 2016-2019 (USD THOUSAND)
                                     TABLE 124 SWEDEN AEROGEL MARKET SIZE, BY APPLICATION, 2020–2025 (USD THOUSAND)
                                     TABLE 125 SWEDEN AEROGEL MARKET SIZE, BY APPLICATION, 2016-2019 (TON)
                                     TABLE 126 SWEDEN AEROGEL MARKET SIZE, BY APPLICATION, 2020–2025 (TON)
             10.4.4 FRANCE
                        10.4.4.1 Growth in transportation and construction industry to drive the market
                                     FIGURE 45 FRANCE: AEROGEL MARKET SIZE, 2016–2025
             10.4.5 ITALY
                        10.4.5.1 Growth in construction industry to drive the aerogel market in the country
                                     FIGURE 46 ITALY: AEROGEL MARKET SIZE, 2016–2025
     10.5 MIDDLE EAST & AFRICA
             TABLE 127 MIDDLE EAST & AFRICA AEROGEL MARKET SIZE, BY COUNTRY, 2016-2019 (USD MILLION)
             TABLE 128 MIDDLE EAST & AFRICA AEROGEL MARKET SIZE, BY COUNTRY, 2020–2025 (USD MILLION)
             TABLE 129 MIDDLE EAST & AFRICA AEROGEL MARKET SIZE, BY COUNTRY, 2016-2019 (TON)
             TABLE 130 MIDDLE EAST & AFRICA AEROGEL MARKET SIZE, BY COUNTRY, 2020–2025 (TON)
             TABLE 131 MIDDLE EAST & AFRICA AEROGEL MARKET SIZE, BY APPLICATION, 2016-2019 (USD MILLION)
             TABLE 132 MIDDLE EAST & AFRICA AEROGEL MARKET SIZE, BY APPLICATION, 2020–2025 (USD MILLION)
             TABLE 133 MIDDLE EAST & AFRICA AEROGEL MARKET SIZE, BY APPLICATION, 2016-2019 (TON)
             TABLE 134 MIDDLE EAST & AFRICA AEROGEL MARKET SIZE, BY APPLICATION, 2020–2025 (TON)
             10.5.1 SAUDI ARABIA
                        10.5.1.1 Established oil & gas companies to increase demand
                                     TABLE 135 SAUDI ARABIA AEROGEL MARKET SIZE, BY APPLICATION, 2016-2019 (USD THOUSAND)
                                     TABLE 136 SAUDI ARABIA AEROGEL MARKET SIZE, BY APPLICATION, 2020–2025 (USD THOUSAND)
                                     TABLE 137 SAUDI ARABIA AEROGEL MARKET SIZE, BY APPLICATION, 2016-2019 (TON)
                                     TABLE 138 SAUDI ARABIA AEROGEL MARKET SIZE, BY APPLICATION, 2020–2025 (TON)
             10.5.2 UAE
                        10.5.2.1 Oil exports to generate demand for aerogels
                                     TABLE 139 UAE AEROGEL MARKET SIZE, BY APPLICATION, 2016-2019 (USD THOUSAND)
                                     TABLE 140 UAE AEROGEL MARKET SIZE, BY APPLICATION, 2020–2025 (USD THOUSAND)
                                     TABLE 141 UAE AEROGEL MARKET SIZE, BY APPLICATION, 2016-2019 (TON)
                                     TABLE 142 UAE AEROGEL MARKET SIZE, BY APPLICATION, 2020–2025 (TON)
             10.5.3 IRAN
                        10.5.3.1 Growing construction industry to drive market
                                     TABLE 143 IRAN AEROGEL MARKET SIZE, BY APPLICATION, 2016-2019 (USD THOUSAND)
                                     TABLE 144 IRAN AEROGEL MARKET SIZE, BY APPLICATION, 2020–2025 (USD THOUSAND)
                                     TABLE 145 IRAN AEROGEL MARKET SIZE, BY APPLICATION, 2016-2019 (TON)
                                     TABLE 146 IRAN AEROGEL MARKET SIZE, BY APPLICATION, 2020–2025 (TON)
             10.5.4 EGYPT
                        10.5.4.1 Infrastructure development in the country to increase demand
                                     FIGURE 47 EGYPT: AEROGEL MARKET SIZE, 2016–2025
     10.6 SOUTH AMERICA
             TABLE 147 SOUTH AMERICA AEROGEL MARKET SIZE, BY COUNTRY, 2016-2019 (USD MILLION)
             TABLE 148 SOUTH AMERICA AEROGEL MARKET SIZE, BY COUNTRY, 2020–2025 (USD MILLION)
             TABLE 149 SOUTH AMERICA AEROGEL MARKET SIZE, BY COUNTRY, 2016-2019 (TON)
             TABLE 150 SOUTH AMERICA AEROGEL MARKET SIZE, BY COUNTRY, 2020–2025 (TON)
             TABLE 151 SOUTH AMERICA AEROGEL MARKET SIZE, BY APPLICATION, 2016-2019 (USD MILLION)
             TABLE 152 SOUTH AMERICA AEROGEL MARKET SIZE, BY APPLICATION, 2020–2025 (USD MILLION)
             TABLE 153 SOUTH AMERICA AEROGEL MARKET SIZE, BY APPLICATION, 2016-2019 (TON)
             TABLE 154 SOUTH AMERICA AEROGEL MARKET SIZE, BY APPLICATION, 2020–2025 (TON)
             10.6.1 BRAZIL
                        10.6.1.1 Emerging industries in the country to offer lucrative opportunities
                                     TABLE 155 BRAZIL AEROGEL MARKET SIZE, BY APPLICATION, 2016-2019 (USD THOUSAND)
                                     TABLE 156 BRAZIL AEROGEL MARKET SIZE, BY APPLICATION, 2020–2025 (USD THOUSAND)
                                     TABLE 157 BRAZIL AEROGEL MARKET SIZE, BY APPLICATION, 2016-2019 (TON)
                                     TABLE 158 BRAZIL AEROGEL MARKET SIZE, BY APPLICATION, 2020–2025 (TON)
             10.6.2 VENEZUELA
                        10.6.2.1 Demand from oil & gas industry to generate high demand
                                     TABLE 159 VENEZUELA AEROGEL MARKET SIZE, BY APPLICATION, 2016-2019 (USD THOUSAND)
                                     TABLE 160 VENEZUELA AEROGEL MARKET SIZE, BY APPLICATION, 2020–2025 (USD THOUSAND)
                                     TABLE 161 VENEZUELA AEROGEL MARKET SIZE, BY APPLICATION, 2016-2019 (TON)
                                     TABLE 162 VENEZUELA AEROGEL MARKET SIZE, BY APPLICATION, 2020–2025 (TON)
             10.6.3 COLOMBIA
                        10.6.3.1 Need for high performance insulation in construction industry
                                      FIGURE 48 COLOMBIA: AEROGEL MARKET SIZE, 2016–2025
             10.6.4 ARGENTINA
                        10.6.4.1 Developing industries in the country to boost market growth
                                      FIGURE 49 ARGENTINA: AEROGEL MARKET SIZE, 2016–2025

11 COMPETITIVE LANDSCAPE (Page No. - 158)
     11.1 INTRODUCTION
             FIGURE 50 COMPANIES ADOPTED CONTRACT & AGREEMENT AS KEY GROWTH STRATEGY BETWEEN 2015 AND 2019
     11.2 MARKET EVALUATION FRAMEWORK
             FIGURE 51 MARKET EVALUATION FRAMEWORK
     11.3 MARKET SHARE OF KEY PLAYERS
             FIGURE 52 MARKET SHARE ANALYSIS, 2019
     11.4 RANKING OF KEY MARKET PLAYERS, 2019
             FIGURE 53 RANKING OF KEY MARKET PLAYERS, 2019
     11.5 REVENUE ANALYSIS OF TOP FIVE MARKET PLAYERS, 2019
     11.6 COMPANY EVALUATION MATRIX DEFINITIONS AND METHODOLOGY
             11.6.1 STAR
             11.6.2 EMERGING LEADERS
             11.6.3 PERVASIVE
             11.6.4 PARTICIPANTS
                        FIGURE 54 AEROGEL MARKET COMPANY EVALUATION MATRIX, 2019
     11.7 STARTUP & SMALL AND MEDIUM-SIZE ENTERPRISES (SMES) MATRIX, 2019
             FIGURE 55 AEROGEL MARKET: STARTUP & SMES MATRIX, 2019
     11.8 PRODUCT PORTFOLIO ANALYSIS OF TOP PLAYERS, 2019
             FIGURE 56 PRODUCT PORTFOLIO ANALYSIS OF TOP PLAYERS IN THE AEROGEL MARKET
     11.9 BUSINESS STRATEGY EXCELLENCE OF TOP PLAYERS, 2019
             FIGURE 57 BUSINESS STRATEGY EXCELLENCE OF TOP PLAYERS IN THE AEROGEL MARKET
     11.10 COMPETITIVE SCENARIO
             11.10.1 CONTRACT & AGREEMENT
                         TABLE 163 CONTRACT & AGREEMENT, 2016–2019
             11.10.2 EXPANSION
                         TABLE 164 EXPANSION, 2016–2019
             11.10.3 INNOVATION & NEW PRODUCT LAUNCH
                         TABLE 165 INNOVATION & NEW PRODUCT LAUNCH, 2016–2019
             11.10.4 PARTNERSHIP & JOINT VENTURE
                         TABLE 166 PARTNERSHIP & JOINT VENTURE, 2016–2019

12 COMPANY PROFILES (Page No. - 169)
(Business Overview, Products Offered, Recent Developments, Winning Imperatives, Current Focus and Strategies, Threat from Competition, Right to Win)*
     12.1 ASPEN AEROGELS
             FIGURE 58 ASPEN AEROGELS: COMPANY SNAPSHOT
             FIGURE 59 ASPEN AEROGELS: WINNING IMPERATIVES
     12.2 CABOT CORPORATION
             FIGURE 60 CABOT CORPORATION: COMPANY SNAPSHOT
             FIGURE 61 CABOT CORPORATION: WINNING IMPERATIVES
     12.3 AEROGEL TECHNOLOGIES
             FIGURE 62 AEROGEL TECHNOLOGIES: WINNING IMPERATIVES
     12.4 NANO TECH CO. LTD.
             FIGURE 63 NANO TECH CO. LTD.: WINNING IMPERATIVES
     12.5 ARMACELL
             FIGURE 64 ARMACELL: COMPANY SNAPSHOT
             FIGURE 65 ARMACELL: WINNING IMPERATIVES
     12.6 GUANGDONG ALISON HI-TECH
     12.7 ACTIVE AEROGELS
     12.8 ENERSENS
     12.9 JIOS AEROGEL
     12.10 BASF
              FIGURE 66 BASF: COMPANY SNAPSHOT
     12.11 OTHER KEY PLAYERS
             12.11.1 AEROGEL UK
             12.11.2 INTELLIGENT INSULATION
             12.11.3 SURNANO AEROGEL
             12.11.4 DOW CORNING
             12.11.5 BLUESHIFT INTERNATIONAL MATERIALS
             12.11.6 GREEN EARTH AEROGEL TECHNOLOGIES
             12.11.7 OCELLUS
             12.11.8 TAASI CORPORATION
             12.11.9 GELANGGANG KENCANA
             12.11.10 AEROGEL INSULATION INDIA
             12.11.11 PROTECTIVE POLYMERS

*Details on Business Overview, Products Offered, Recent Developments, Winning Imperatives, Current Focus and Strategies, Threat from Competition, Right to Win might not be captured in case of unlisted companies.

13 ADJACENT & RELATED MARKETS (Page No. - 191)
     13.1 INTRODUCTION
     13.2 LIMITATION
     13.3 PIPE INSULATION MARKET
             13.3.1 MARKET DEFINITION
             13.3.2 MARKET OVERVIEW
     13.4 PIPE INSULATION MARKET, BY REGION
             TABLE 167 PIPE INSULATION MARKET SIZE, BY REGION, 2016–2023 (USD MILLION)
             13.4.1 ASIA PACIFIC
                        13.4.1.1 By country
                                     TABLE 168 ASIA PACIFIC: PIPE INSULATION MARKET SIZE, BY COUNTRY, 2016–2023 (USD MILLION)
                        13.4.1.2 By application
                                     TABLE 169 ASIA PACIFIC: PIPE INSULATION MARKET SIZE, BY APPLICATION, 2016–2023 (USD MILLION)
             13.4.2 WESTERN EUROPE
                        13.4.2.1 By country
                                     TABLE 170 WESTERN EUROPE: PIPE INSULATION MARKET SIZE, BY COUNTRY, 2016–2023 (USD MILLION)
                        13.4.2.2 By application
                                     TABLE 171 WESTERN EUROPE: PIPE INSULATION MARKET SIZE, BY APPLICATION, 2016–2023 (USD MILLION)
             13.4.3 CENTRAL & EASTERN EUROPE
                        13.4.3.1 By country
                                     TABLE 172 CENTRAL & EASTERN EUROPE: PIPE INSULATION MARKET SIZE, BY COUNTRY, 2016–2023 (USD MILLION)
                        13.4.3.2 By country
                                     TABLE 173 CENTRAL & EASTERN EUROPE: PIPE INSULATION MARKET SIZE, BY APPLICATION, 2016–2023 (USD MILLION)
             13.4.4 NORTH AMERICA
                        13.4.4.1 By country
                                     TABLE 174 NORTH AMERICA: PIPE INSULATION MARKET SIZE, BY COUNTRY, 2016–2023 (USD MILLION)
                        13.4.4.2 By application
                                     TABLE 175 NORTH AMERICA: PIPE INSULATION MARKET SIZE, BY APPLICATION, 2016–2023 (USD MILLION)
             13.4.5 SOUTH AMERICA
                        13.4.5.1 By country
                                     TABLE 176 SOUTH AMERICA: PIPE INSULATION MARKET SIZE, BY COUNTRY, 2016–2023 (USD MILLION)
                        13.4.5.2 By application
                                     TABLE 177 SOUTH AMERICA: PIPE INSULATION MARKET SIZE, BY APPLICATION, 2016–2023 (USD MILLION)
             13.4.6 MIDDLE EAST & AFRICA
                        13.4.6.1 By country
                                     TABLE 178 MIDDLE EAST & AFRICA: PIPE INSULATION MARKET SIZE, BY COUNTRY, 2016–2023 (USD MILLION)
                        13.4.6.2 By application
                                     TABLE 179 MIDDLE EAST & AFRICA: PIPE INSULATION MARKET SIZE, BY APPLICATION, 2016–2023 (USD MILLION)

14 APPENDIX (Page No. - 199)
     14.1 DISCUSSION GUIDE
     14.2 KNOWLEDGE STORE: MARKETSANDMARKETS SUBSCRIPTION PORTAL
     14.3 AVAILABLE CUSTOMIZATIONS
     14.4 RELATED REPORTS
     14.5 AUTHOR DETAILS


The study involved four major activities to estimate the market size for aerogel. Exhaustive secondary research was done to collect information on the market, the peer market, and the parent market. The next step was to validate these findings, assumptions, and sizing with industry experts across the value chain through primary research. Both top-down and bottom-up approaches were employed to estimate the complete market size. Thereafter, the market breakdown and data triangulation procedures were used to estimate the market size of the segments and subsegments.

Secondary Research

Secondary sources used in this study included annual reports, press releases, and investor presentations of companies; white papers; certified publications; articles from recognized authors; and gold standard & silver standard websites such as Factiva, ICIS, Bloomberg, and others. Findings of this study were verified through primary research by conducting extensive interviews with key officials such as CEOs, VPs, directors, and other executives.

Primary Research

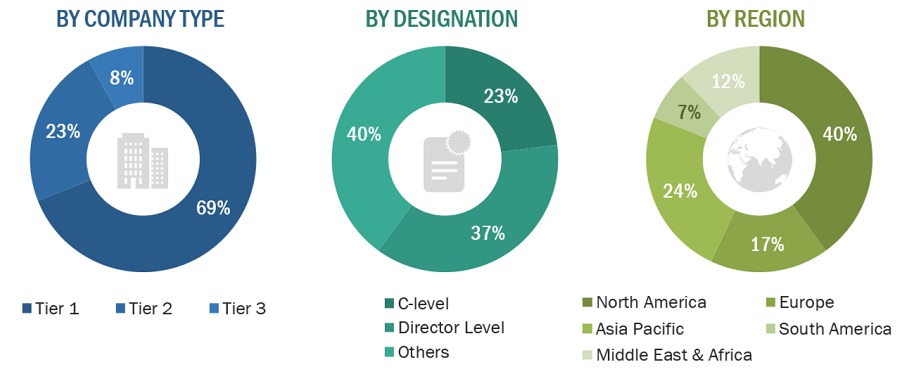
The aerogel market comprises several stakeholders such as raw material suppliers, end-product manufacturers, and regulatory organizations in the supply chain. The demand side of this market is characterized by the development of oil & gas, construction, transportation, performance coating, and day-lighting & LVHS application. The supply side is characterized by advancements in technology and diverse application industries. Various primary sources from both the supply and demand sides of the market were interviewed to obtain qualitative and quantitative information. The breakdown of profiles of the primary interviewees is illustrated in the figure below:

Aerogel Market Size, and Share

To know about the assumptions considered for the study, download the pdf brochure

Market Size Estimation

Both top-down and bottom-up approaches were used to estimate and validate the total size of the aerogel market. These methods were also used extensively to estimate the size of various subsegments in the market. The research methodology used to estimate the market size includes the following:

The key players in the industry have been identified through extensive secondary research.

  • The industry’s supply chain and market size, in terms of volume and value, were determined through primary and secondary research processes.
  • All percentage shares, splits, and breakdowns were determined using secondary sources and verified through primary sources.

Data Triangulation

After arriving at the overall market size—using the market size estimation processes as explained above—the market was split into several segments and subsegments. To complete the overall market engineering process and arrive at the exact statistics of each market segment and subsegment, the data triangulation, and market breakdown procedures were employed, wherever applicable. The data was triangulated by studying various factors and trends from both the demand and supply sides in oil & gas, construction, transportation, performance coating, and day-lighting & LVHS applications.

Report Objectives

  • To analyze and forecast the size of the aerogel market, in terms of volume and value
  • To provide detailed information regarding key factors, such as drivers, restraints, and opportunities influencing the growth of the market
  • To define, describe, and segment the aerogel market on the basis of type, form, processing and application
  • To forecast the size of the market segments for regions such as APAC, North America, Europe, South America, and the Middle East & Africa
  • To strategically analyze the segmented markets with respect to individual growth trends, prospects, and contribution to the overall market
  • To identify and analyze opportunities for stakeholders in the market
  • To analyze competitive developments such as expansion, new product launch, merger & acquisition, and agreement in the aerogel market
  • To strategically profile key players and comprehensively analyze their core competencies

Available Customizations

Along with the given market data, MarketsandMarkets offers customizations according to the company’s specific needs. The following customization options are available for the report:

Regional Analysis

  • Further breakdown of a region with respect to a particular country or additional end-use industry

Company Information

  • Detailed analysis and profiles of additional market players (up to five)
Custom Market Research Services

We will customize the research for you, in case the report listed above does not meet with your exact requirements. Our custom research will comprehensively cover the business information you require to help you arrive at strategic and profitable business decisions.

Request Customization
Report Code
CH 2967
Published ON
Dec, 2020
Choose License Type
BUY NOW
  • SHARE
X
Request Customization
Speak to Analyst
Speak to Analyst
OR FACE-TO-FACE MEETING
PERSONALIZE THIS RESEARCH
  • Triangulate with your Own Data
  • Get Data as per your Format and Definition
  • Gain a Deeper Dive on a Specific Application, Geography, Customer or Competitor
  • Any level of Personalization
REQUEST A FREE CUSTOMIZATION
LET US HELP YOU!
  • What are the Known and Unknown Adjacencies Impacting the Aerogel Market
  • What will your New Revenue Sources be?
  • Who will be your Top Customer; what will make them switch?
  • Defend your Market Share or Win Competitors
  • Get a Scorecard for Target Partners
CUSTOMIZED WORKSHOP REQUEST
+1-888-600-6441
  • Call Us
  • +1-888-600-6441 (Corporate office hours)
  • +1-888-600-6441 (US/Can toll free)
  • +44-800-368-9399 (UK office hours)
CONNECT WITH US
ABOUT TRUST ONLINE
©2024 MarketsandMarkets Research Private Ltd. All rights reserved
DMCA.com Protection Status Website Feedback