AI Code Tools Market

AI Code Tools Market by Offering (Tools (Deployment Mode) and Services), Technology (ML, NLP, Generative AI), Application (Data Science & Machine Learning, Cloud Services & DevOps, Web Development), Vertical and Region - Global Forecast to 2028

Report Code: TC 8823 Oct, 2023, by marketsandmarkets.com

The global market for AI Code Tools Market is projected to grow from USD 4.3 billion in 2023 to USD 12.6 billion by 2028, at a CAGR of 24.0% during the forecast period. The AI code tools market is fueled by several key factors, including rapid advancements in generative Al is revolutionizing software development. These tools are instrumental in enhancing efficiency and productivity for developers, as they address the challenges of handling intricate coding tasks. The need to assist developers in tackling complex coding tasks and enhance scalability and transformative shift in the roles of software developers propels the AI code tools market.

AI Code Tools Market

To know about the assumptions considered for the study, Request for Free Sample Report

AI Code Tools Market

To know about the assumptions considered for the study, Request for Free Sample Report

Market Dynamics

Driver: Need to assist developers in tackling complex coding tasks

AI code tools provide invaluable assistance to software developers when facing complex coding tasks, and this has emerged as a compelling driver for their adoption in the software development landscape. One significant aspect of this assistance lies in the ability of AI coding tools to simplify code translation, particularly when dealing with legacy source code or multiple programming languages. A study at the 2021 International Conference on Intelligent User Interfaces highlighted how generative AI offered developers a skeletal framework to translate source code into Python. In a 2022 study published in the Proceedings of the Association for Computing Machinery on Programming Languages (PACMPL), it was observed that these tools, like GitHub Copilot, facilitated faster coding by offering end-of-line suggestions for function calls and argument completions.

Restraint: Overreliance on AI code tools to hinder the problem solving abilities

Overreliance on AI code tools represents a critical restraint in the software development landscape. While these AI-driven tools offer efficiency and productivity, they can inadvertently hinder developers' creative problem-solving capabilities and critical thinking. Developers are often drawn to AI code tools because of their convenience and the ability to expedite coding tasks. However, this convenience can lead to a situation where developers become overly dependent on AI-generated code suggestions. This overreliance may manifest in several ways, including developers bypassing manual coding, overlooking innovative problem-solving, and adopting a more passive role in the development process. Rather than proactively engaging with code challenges and devising unique solutions, developers may turn to AI tools as a one-stop solution. The consequence of such overreliance is a potential stifling of creative thinking and the development of skills that are crucial in software engineering.

Opportunity: Emergence of Prompt Engineering in software industry

The emergence of Prompt Engineering is a significant opportunity for the software development industry.  This approach recognizes the importance of effective communication with AI systems, treating it as a form of meta-programming. Developers will need to convey their intentions to AI systems using well-structured prompts, ensuring that the AI co-developers generate code that aligns with their objectives. In the face of increasing App Development workloads and the need for improved productivity, Prompt Engineering and AI and Human Collaboration offer a solution to navigate the future of software development effectively, providing a more efficient, rewarding, and collaborative environment for developers while enhancing software quality and speed.

Challenge: Legal and ethical complexities in AI code tools

Legal and ethical complexities are inherent challenges in the use of AI code tools, primarily due to the rapidly evolving landscape of artificial intelligence and its interaction with established legal frameworks and ethical standards. These complexities encompass a range of issues, including intellectual property rights, liability, data privacy, and ethical considerations. One significant concern relates to intellectual property, particularly in the case of AI-generated code. Determining the ownership of code created by AI tools can be convoluted, as it involves questions about whether AI-generated code can be copyrighted, patented, or owned at all.

AI code tools Market Ecosystem

The AI code tools market ecosystem is a dynamic landscape consisting of various key components, each playing a distinct role in advancing the field of artificial intelligence and software development. These components include AI code tool providers, service providers, integrators, end users, and regulatory bodies.

AI Code Tools Market

By Vertical, BFSI segment accounts for the largest market size during the forecast period

Artificial Intelligence (AI) has transformed the BFSI sector by introducing a wide array of code tools designed to streamline operations, enhance customer experiences, and improve risk management. These AI code tools are helping banks, financial institutions, and insurance companies become more efficient, agile, and competitive in a rapidly evolving industry. One prominent application is the use of Natural Language Processing (NLP) and Machine Learning (ML) algorithms to automate document processing and analysis. By parsing large volumes of unstructured data from sources such as loan applications, financial statements, and customer queries, AI code tools can quickly extract key information, assess risk profiles, and make data-driven decisions.

Managed Services segment is projected to grow at the highest CAGR during the forecast period

Managed services offer a comprehensive approach to AI implementation, transforming the way organizations harness the power of artificial intelligence. These services, often provided by third-party experts, encompass end-to-end management of AI systems, from planning and development to ongoing operations and support. Managed services relieve organizations of the complexities associated with AI, allowing them to focus on their core competencies while benefiting from expert guidance. Managed service providers oversee tasks such as data preparation, model training, deployment, and continuous monitoring, ensuring the seamless and optimal functioning of AI solutions.

North America to account for the largest market size during the forecast period

The AI code tools market in North America stands as a global powerhouse, shaped by the innovation and technological prowess of both the United States and Canada. The United States has long maintained its position as a global leader in AI, driven by an innovation ecosystem that fosters collaboration between industry, academia, and government. With substantial investments, a concentration of top-tier AI researchers, and tech giants like IBM and Microsoft, the U.S. dominates AI startup funding deals and patents, reinforcing its readiness to implement AI in the public sector. Similarly, Canada boasts a thriving tech industry, marked by an emphasis on research and development, access to highly skilled talent, and strong tech ecosystems in major cities. The nation's commitment to STEM education and collaborative research has established it as a significant player in the global software market, with thriving AI hubs that attract global companies.

AI Code Tools Market Size, and Share

Key Market Players

The major AI code tools and service providers include IBM (US), Microsoft (US), Google (US), AWS (US), Salesforce (US), Meta (US), OpenAI (US), Tabnine (Israel), Replit (US), Sourcegraph (US), Moolya (India), Synk (US), CircleCI (US), JetBrains (Czech Republic), Adacore (France), WingWare (US), Datadog (US), Lightning AI (US), Kodezi (US), Sourcery (England), CodeWP (US),  SQLAI.ai (Germany) , SinCode AB (Sweden), Seek AI (US), Enzyme (US), Assistive.ai (Germany), CodiumAI (Israel), Mutable AI (US),  Judini (US) and Safurai (Italy).  These companies have used both organic and inorganic growth strategies such as product launches, acquisitions, and partnerships to strengthen their position in the AI code tools market.

Get online access to the report on the World's First Market Intelligence Cloud

  • Easy to Download Historical Data & Forecast Numbers
  • Company Analysis Dashboard for high growth potential opportunities
  • Research Analyst Access for customization & queries
  • Competitor Analysis with Interactive dashboard
  • Latest News, Updates & Trend analysis
Request Sample

Scope of the Report

Report Metrics

Details

Market size available for years

2017–2028

Base year considered

2022

Forecast period

2023–2028

Forecast units

USD Billion

Segments covered

Offering (Tools (Deployment Mode) and Services), Technology (ML, NLP, Generative AI), Application (Data Science & Machine Learning, Cloud Services & DevOps, Web Development), Vertical, and Region

Geographies covered

North America, Europe, Asia Pacific, Middle East & Africa, and Latin America

Companies covered

IBM (US), Microsoft (US), Google (US), AWS (US), Salesforce (US), Meta (US), OpenAI (US), Tabnine (Israel), Replit (US), Sourcegraph (US), Moolya (India), Synk (US), CircleCI (US), JetBrains (Czech Republic), Adacore (France), WingWare (US), Datadog (US), Lightning AI (US), Kodezi (US), Sourcery (England), CodeWP (US),  SQLAI.ai (Germany) , SinCode AB (Sweden), Seek AI (US), Enzyme (US), Assistive.ai (Germany), CodiumAI (Israel), Mutable AI (US),  Judini (US), Safurai (Italy)

This research report categorizes the AI code tools market based on Offering, Application, Vertical, and Region.

By Offering:
  • Tools
    • Deployment Mode
      • Cloud
      • On Premises
  • Services
    • Professional Services
      • Consulting
      • Training
      • System Integration & Implementation
      •  Support & Maintenance
    • Managed Services
By Technology:
  • Machine Learning
    • Deep Learning
      • Recurrent neural networks
      • Long short-term memory (LSTM)
  • Natural Language Processing
    • Natural language understanding (NLU)
    • Natural language interface for code
  • Generative AI
    • Large language models (LLMs)
    • Code generation models
By Application:
  • Data Science & Machine Learning
  • Cloud Services &  DevOps
  • Web Development
  • Mobile App Development
  • Gaming Development
  • Embedded Systems
  • Other Applications
By Vertical:
  • BFSI
  • IT&ITeS
  • Healthcare & Life Sciences
  • Manufacturing
  • Retail & eCommerce
  • Telecommunications
  • Government & Public Sector
  • Media & Entertainment
  • Others (Education, Automotive, and Energy & Utilities)
By Region:
  • North America
  • Europe
  • Asia Pacific
  • Middle East & Africa
  • Latin America

Recent Developments:

  • In July 2023, Meta announced the release of Llama 2, the next iteration of its open-source large language model. This development is part of an expanded partnership between Microsoft and Meta, with Microsoft being designated as the preferred partner for Llama 2.
  • In May 2023, IBM introduced WatsonX, a new AI and data platform enabling enterprises to scale and accelerate the impact of the most advanced AI with trusted data. WatsonX was designed to be a comprehensive platform with an AI development studio, a data store, and an AI governance toolkit.
  • In March 2023, Replit, a prominent cloud software development platform, announced a partnership with Google Cloud. This partnership introduces the latest Large Language Model (LLM) chat applications capable of generating complete code for entire programs based on straightforward natural language prompts.
  • In March 2023, Baidu unveiled ERNIE Bot, its latest innovation in generative AI, featuring a knowledge-enhanced LLM. This cutting-edge technology can understand human intentions and provide precise, coherent, and fluent responses that approach human-level comprehension and communication.
  • In December 2022, DeepMind launched AlphaCode, a code generation system that can write computer programs at a competitive level. It was trained on a massive dataset of code and text and can generate code in a variety of programming languages, including Python, Java, C++, and C#.
  • In March 2022, CircleCI announced the acquisition of Ponicode, a Paris-based AI engine specializing in source code analysis, aiming to assist developers in enhancing their code quality within their local development environments. Ponicode's unique emphasis on alleviating developers from their less favored tasks, particularly the repetitive aspects of code creation such as test writing, code commenting, and code quality analysis, captured CircleCI's interest and aligns with its mission to support developers in producing superior code.

Frequently Asked Questions (FAQ):

To speak to our analyst for a discussion on the above findings, click Speak to Analyst

TABLE OF CONTENTS
 
1 INTRODUCTION (Page No. - 29)
    1.1 STUDY OBJECTIVES 
    1.2 MARKET DEFINITION 
           1.2.1 INCLUSIONS AND EXCLUSIONS
    1.3 MARKET SCOPE 
           1.3.1 MARKET SEGMENTATION
           1.3.2 REGIONS COVERED
           1.3.3 YEARS CONSIDERED
    1.4 CURRENCY CONSIDERED 
    1.5 STAKEHOLDERS 
 
2 RESEARCH METHODOLOGY (Page No. - 33)
    2.1 RESEARCH DATA 
           FIGURE 1 AI CODE TOOLS MARKET: RESEARCH DESIGN
           2.1.1 SECONDARY DATA
           2.1.2 PRIMARY DATA
                    TABLE 1 PRIMARY INTERVIEWS
                    2.1.2.1 Breakup of primary profiles
                    2.1.2.2 Key industry insights
    2.2 DATA TRIANGULATION 
           FIGURE 2 DATA TRIANGULATION
    2.3 MARKET SIZE ESTIMATION 
           FIGURE 3 AI CODE TOOLS MARKET: TOP-DOWN AND BOTTOM-UP APPROACHES
           2.3.1 TOP-DOWN APPROACH
           2.3.2 BOTTOM-UP APPROACH
                    FIGURE 4 MARKET SIZE ESTIMATION METHODOLOGY - APPROACH 1 (SUPPLY-SIDE): FLOWCHART USING REVENUE FROM AI CODE TOOLS/SERVICES
                    FIGURE 5 MARKET SIZE ESTIMATION METHODOLOGY - APPROACH 2, BOTTOM-UP (SUPPLY-SIDE): COLLECTIVE REVENUE FROM ALL AI CODE TOOLS / SERVICE COMPANIES
                    FIGURE 6 MARKET SIZE ESTIMATION METHODOLOGY - APPROACH 3, BOTTOM-UP (SUPPLY-SIDE): REVENUES OF TOP PLAYERS AND SOURCES OF DATA
                    FIGURE 7 MARKET SIZE ESTIMATION METHODOLOGY - APPROACH 4, BOTTOM-UP (DEMAND-SIDE): OVERALL AI CODE TOOLS SPENDING
    2.4 MARKET FORECAST 
           TABLE 2 FACTOR ANALYSIS
    2.5 RESEARCH ASSUMPTIONS 
    2.6 LIMITATIONS 
    2.7 IMPLICATIONS OF RECESSION ON AI CODE TOOLS MARKET 
           TABLE 3 IMPACT OF RECESSION ON GLOBAL MARKET
 
3 EXECUTIVE SUMMARY (Page No. - 47)
    TABLE 4 AI CODE TOOLS MARKET SIZE AND GROWTH RATE, 2017–2022 (USD MILLION, Y-O-Y) 
    TABLE 5 MARKET SIZE AND GROWTH RATE, 2023–2028 (USD MILLION, Y-O-Y) 
    FIGURE 8 TOOLS SEGMENT TO ACCOUNT FOR LARGER SHARE IN 2023 
    FIGURE 9 MACHINE LEARNING TECHNOLOGY TO ACCOUNT FOR LARGEST MARKET SHARE IN 2023 
    FIGURE 10 CLOUD DEPLOYMENT TO ACCOUNT FOR LARGER SHARE IN 2023 
    FIGURE 11 PROFESSIONAL SERVICES TO ACCOUNT FOR LARGER MARKET SIZE IN 2023 
    FIGURE 12 CONSULTING SERVICES TO ACCOUNT FOR LARGEST SHARE IN 2023 
    FIGURE 13 DATA SCIENCE & MACHINE LEARNING TO ACCOUNT FOR LARGEST APPLICATION IN 2023 
    FIGURE 14 BFSI VERTICAL TO ACCOUNT FOR LARGEST MARKET SHARE IN 2023 
    FIGURE 15 ASIA PACIFIC TO GROW AT HIGHEST CAGR IN MARKET 
 
4 PREMIUM INSIGHTS (Page No. - 53)
    4.1 ATTRACTIVE OPPORTUNITIES IN AI CODE TOOLS MARKET 
           FIGURE 16 INCREASING DEMAND FOR AUTOMATION AND EFFICIENCY IN SOFTWARE DEVELOPMENT TO PROPEL ADOPTION OF AI CODE TOOLS
    4.2 MARKET: TOP THREE APPLICATIONS 
           FIGURE 17 DATA SCIENCE & MACHINE LEARNING APPLICATION EXPECTED TO HOLD LARGEST MARKET DURING FORECAST PERIOD
    4.3 MARKET, BY OFFERING & VERTICAL 
           FIGURE 18 TOOLS AND BFSI VERTICAL TO ACCOUNT FOR LARGEST SHARES IN 2023
    4.4 MARKET, BY REGION 
           FIGURE 19 NORTH AMERICA TO ACCOUNT FOR LARGEST SHARE IN 2023
 
5 MARKET OVERVIEW AND INDUSTRY TRENDS (Page No. - 55)
    5.1 INTRODUCTION 
    5.2 MARKET DYNAMICS 
           FIGURE 20 MARKET DRIVERS, RESTRAINTS, OPPORTUNITIES, AND CHALLENGES
           5.2.1 DRIVERS
                    5.2.1.1 Rapid advancements in generative AI revolutionizing software development
                    5.2.1.2 Increased efficiency and productivity with AI code tools
                    5.2.1.3 Need to assist developers in tackling complex coding tasks
                    5.2.1.4 Transformative shift in roles of software developers
           5.2.2 RESTRAINTS
                    5.2.2.1 Presence of inaccuracies and limitations in AI-generated codes
                    5.2.2.2 Overreliance on AI code tools hinder problem-solving abilities
           5.2.3 OPPORTUNITIES
                    5.2.3.1 Evolution of application development with AI-powered virtual developers
                    5.2.3.2 Unlocking innovation through augmented software development (ASD)
                    5.2.3.3 Emergence of prompt engineering in software industry
           5.2.4 CHALLENGES
                    5.2.4.1 Legal and ethical complexities in AI code tools
                    5.2.4.2 Security challenges faced in AI coding tools
                    5.2.4.3 Concerns for biases in generated code
    5.3 INDUSTRY TRENDS 
           5.3.1 AI CODE TOOLS: ARCHITECTURE
                    FIGURE 21 AI CODE TOOLS ARCHITECTURE
           5.3.2 AI CODE TOOLS: EVOLUTION
                    FIGURE 22 AI CODE TOOLS MARKET EVOLUTION
           5.3.3 VALUE CHAIN ANALYSIS
                    FIGURE 23 AI CODE TOOLS MARKET: VALUE CHAIN ANALYSIS
           5.3.4 ECOSYSTEM ANALYSIS
                    FIGURE 24 MARKET ECOSYSTEM
                    TABLE 6 MARKET: AI CODE TOOL PROVIDERS
                    TABLE 7 MARKET: SERVICE PROVIDERS
                    TABLE 8 MARKET: INTEGRATORS
                    TABLE 9 MARKET: END USERS
                    TABLE 10 MARKET: REGULATORY BODIES
           5.3.5 PRICING ANALYSIS
                    5.3.5.1 Selling prices of key players, by application
                               FIGURE 25 SELLING PRICES OF KEY PLAYERS FOR TOP THREE APPLICATIONS
                               TABLE 11 SELLING PRICES OF KEY PLAYERS FOR TOP THREE APPLICATIONS (USD)
                    5.3.5.2 Indicative pricing analysis of AI code tools
                               TABLE 12 AI CODE TOOLS: PRICING LEVELS
           5.3.6 PORTER’S FIVE FORCES ANALYSIS
                    FIGURE 26 PORTER’S FIVE FORCES ANALYSIS
                    TABLE 13 AI CODE TOOLS MARKET: PORTER’S FIVE FORCES ANALYSIS
                    5.3.6.1 Threat of new entrants
                    5.3.6.2 Threat of substitutes
                    5.3.6.3 Bargaining power of suppliers
                    5.3.6.4 Bargaining power of buyers
                    5.3.6.5 Intensity of competitive rivalry
           5.3.7 TRENDS/DISRUPTIONS IMPACTING BUYERS/CLIENTS OF MARKET
                    FIGURE 27 MARKET: TRENDS/DISRUPTIONS IMPACTING BUYERS/CLIENTS
           5.3.8 TECHNOLOGY ANALYSIS
                    FIGURE 28 AI CODE TOOLS MARKET: TECHNOLOGY ANALYSIS
                    5.3.8.1 Key technologies
                               5.3.8.1.1 Machine learning
                               5.3.8.1.2 Natural language processing
                               5.3.8.1.3 Generative AI
                               5.3.8.1.4 Containerization and microservices
                    5.3.8.2 Adjacent technologies
                               5.3.8.2.1 Big data
                               5.3.8.2.2 Predictive analytics
                               5.3.8.2.3 Cloud computing
                               5.3.8.2.4 Cybersecurity
                               5.3.8.2.5 Graph databases
           5.3.9 CASE STUDY ANALYSIS
           5.3.10 IT & ITES
                    5.3.10.1 Case study 1: AI-powered coding assistant, Tabnine, increased productivity at CI&T
                    5.3.10.2 Case study 2: Nutanix addressed Log4j vulnerability using Sourcegraph
           5.3.11 BANKING, FINANCIAL SERVICES, AND INSURANCE
                    5.3.11.1 Case study 3: Neo Financial transformed developer productivity and codebase management with Sourcegraph
                    5.3.11.2 Case study 4: PayPay achieved scalability and reliability with CircleCI for CI/CD solutions
           5.3.12 HEALTHCARE & LIFE SCIENCES
                    5.3.12.1 Case study 5: Baracoda accelerated health-related IoT products with CircleCI
                    5.3.12.2 Case study 6: HealthLabs.com achieved enhanced developer productivity and well-being with CircleCI
           5.3.13 RETAIL & ECOMMERCE
                    5.3.13.1 Case study 7: CircleCI helped Bolt optimize and streamline its build pipelines
                    5.3.13.2 Case study 8: CircleCI helped BRIKL meet customer demands, maintain competitive edge, and drive future growth
           5.3.14 TRANSPORTATION & LOGISTICS
                    5.3.14.1 Case study 9: Lyft achieved successful transition from monolithic PHP application to microservices architecture with Sourcegraph
           5.3.15 EDUCATION
                    5.3.15.1 Case study 10: MagicSchool revolutionized education by seamlessly integrating AI into daily workflow of teachers
           5.3.16 PATENT ANALYSIS
                    5.3.16.1 Methodology
                    5.3.16.2 Document Type
                               TABLE 14 PATENTS FILED, 2013–2023
                    5.3.16.3 Innovation and patent applications
                               FIGURE 29 TOTAL NUMBER OF PATENTS GRANTED, 2013–2023
                               5.3.16.3.1 Top applicants
                               FIGURE 30 TOP TEN COMPANIES WITH HIGHEST NUMBER OF PATENT APPLICATIONS, 2013–2023
                               TABLE 15 TOP 20 PATENT OWNERS, 2013–2023
                               TABLE 16 LIST OF PATENTS IN AI CODE TOOLS MARKET, 2021–2023
           5.3.17 KEY CONFERENCES & EVENTS, 2023–2024
                    TABLE 17 DETAILED LIST OF CONFERENCES & EVENTS, 2023–2024
           5.3.18 TARIFFS AND REGULATORY LANDSCAPE
                    5.3.18.1 REGULATORY BODIES, GOVERNMENT AGENCIES, AND OTHER ORGANIZATIONS
                               TABLE 18 NORTH AMERICA: LIST OF REGULATORY BODIES, GOVERNMENT AGENCIES, AND OTHER ORGANIZATIONS
                               TABLE 19 EUROPE: LIST OF REGULATORY BODIES, GOVERNMENT AGENCIES, AND OTHER ORGANIZATIONS
                               TABLE 20 ASIA PACIFIC: LIST OF REGULATORY BODIES, GOVERNMENT AGENCIES, AND OTHER ORGANIZATIONS
                               TABLE 21 ROW: LIST OF REGULATORY BODIES, GOVERNMENT AGENCIES, AND OTHER ORGANIZATIONS
                    5.3.18.2 North America
                               5.3.18.2.1 US
                               5.3.18.2.2 Canada
                    5.3.18.3 Europe
                    5.3.18.4 Asia Pacific
                               5.3.18.4.1 South Korea
                               5.3.18.4.2 China
                               5.3.18.4.3 India
                    5.3.18.5 Middle East & Africa
                               5.3.18.5.1 UAE
                               5.3.18.5.2 KSA
                               5.3.18.5.3 Bahrain
                    5.3.18.6 Latin America
                               5.3.18.6.1 Brazil
                               5.3.18.6.2 Mexico
           5.3.19 KEY STAKEHOLDERS AND BUYING CRITERIA
                    5.3.19.1 Key stakeholders in buying process
                               FIGURE 31 INFLUENCE OF STAKEHOLDERS IN BUYING PROCESS FOR TOP THREE VERTICALS
                               TABLE 22 INFLUENCE OF STAKEHOLDERS ON BUYING PROCESS FOR TOP THREE VERTICALS
                    5.3.19.2 Buying criteria
                               FIGURE 32 KEY BUYING CRITERIA FOR TOP THREE VERTICALS
                               TABLE 23 KEY BUYING CRITERIA FOR TOP THREE APPLICATIONS
           5.3.20 BEST PRACTICES IN AI CODE TOOLS MARKET
           5.3.21 TECHNOLOGY ROADMAP OF MARKET
                    TABLE 24 SHORT-TERM ROADMAP, 2023–2025
                    TABLE 25 MID-TERM ROADMAP, 2026–2028
                    TABLE 26 LONG-TERM ROADMAP, 2029–2030
           5.3.22 BUSINESS MODELS OF MARKET
                    5.3.22.1 Subscription-based services
                    5.3.22.2 Pay-per-use or pay-per-query
                    5.3.22.3 Enterprise licensing and customization
                    5.3.22.4 Open source with premium features
                    5.3.22.5 API and Platform as a Service (PaaS)
           5.3.23 KEY FUNCTIONALITIES OF AI CODE TOOLS
                    5.3.23.1 Code autocompletion and suggestions
                    5.3.23.2 Code optimization and refactoring
                    5.3.23.3 Code generation
                    5.3.23.4 Automated testing and test generation
                    5.3.23.5 Code review and quality analysis
                    5.3.23.6 Code analytics
                    5.3.23.7 Bug detection and prevention
                    5.3.23.8 Version control
                    5.3.23.9 Documentation generation
 
6 AI CODE TOOLS MARKET, BY OFFERING (Page No. - 108)
    6.1 INTRODUCTION 
           6.1.1 OFFERING: MARKET DRIVERS
                    FIGURE 33 SERVICES SEGMENT TO WITNESS HIGHER CAGR DURING FORECAST PERIOD
                    TABLE 27 MARKET, BY OFFERING, 2017–2022 (USD MILLION)
                    TABLE 28 MARKET, BY OFFERING, 2023–2028 (USD MILLION)
    6.2 TOOLS 
           6.2.1 AI CODE TOOLS TO EMPOWER DEVELOPERS CREATE PREDICTIVE MODELS AND DATA-DRIVEN APPLICATIONS
                    TABLE 29 TOOLS: MARKET, BY REGION, 2017–2022 (USD MILLION)
                    TABLE 30 TOOLS: MARKET, BY REGION, 2023–2028 (USD MILLION)
           6.2.2 DEPLOYMENT MODE
                    6.2.2.1 Cloud deployment mode to offer scalability, easy availability, and reduced expenditure
                               FIGURE 34 CLOUD SEGMENT TO WITNESS HIGHER CAGR DURING FORECAST PERIOD
                               TABLE 31 MARKET, BY DEPLOYMENT MODE, 2017–2022 (USD MILLION)
                               TABLE 32 MARKET, BY DEPLOYMENT MODE, 2023–2028 (USD MILLION)
                    6.2.2.2 Cloud
                               6.2.2.2.1 Cloud solutions to facilitate development of AI applications that can adapt to changing workloads and data demands
                               TABLE 33 CLOUD: AI CODE TOOLS MARKET, BY REGION, 2017–2022 (USD MILLION)
                               TABLE 34 CLOUD: MARKET, BY REGION, 2023–2028 (USD MILLION)
                    6.2.2.3 On-premises
                               6.2.2.3.1 On-premises AI code tools to provide high level of security and compliance adherence
                               TABLE 35 ON-PREMISES: MARKET, BY REGION, 2017–2022 (USD MILLION)
                               TABLE 36 ON-PREMISES: MARKET, BY REGION, 2023–2028 (USD MILLION)
    6.3 SERVICES 
           6.3.1 SERVICES TO SUSTAIN PERFORMANCE OF AI SYSTEMS, MINIMIZE DOWNTIME, AND RESOLVE ISSUES PROMPTLY
                    FIGURE 35 PROFESSIONAL SERVICES SEGMENT TO HOLD LARGEST MARKET DURING FORECAST PERIOD
                    TABLE 37 MARKET, BY SERVICE, 2017–2022 (USD MILLION)
                    TABLE 38 MARKET, BY SERVICE, 2023–2028 (USD MILLION)
           6.3.2 PROFESSIONAL SERVICES
                    6.3.2.1 Professional services to drive innovation, automation, and data-driven decision-making across diverse industries
                               FIGURE 36 SUPPORT & MAINTENANCE SEGMENT TO WITNESS HIGHEST CAGR DURING FORECAST PERIOD
                               TABLE 39 PROFESSIONAL SERVICES: MARKET, BY TYPE, 2017–2022 (USD MILLION)
                               TABLE 40 PROFESSIONAL SERVICES: MARKET, BY TYPE, 2023–2028 (USD MILLION)
                               TABLE 41 PROFESSIONAL SERVICES: MARKET, BY REGION, 2017–2022 (USD MILLION)
                               TABLE 42 PROFESSIONAL SERVICES: MARKET, BY REGION, 2023–2028 (USD MILLION)
                    6.3.2.2 Consulting
                               TABLE 43 CONSULTING: AI CODE TOOLS MARKET, BY REGION, 2017–2022 (USD MILLION)
                               TABLE 44 CONSULTING: MARKET, BY REGION, 2023–2028 (USD MILLION)
                    6.3.2.3 Training
                               TABLE 45 TRAINING: MARKET, BY REGION, 2017–2022 (USD MILLION)
                               TABLE 46 TRAINING: MARKET, BY REGION, 2023–2028 (USD MILLION)
                    6.3.2.4 System integration & implementation
                               TABLE 47 SYSTEM INTEGRATION & IMPLEMENTATION: MARKET, BY REGION, 2017–2022 (USD MILLION)
                               TABLE 48 SYSTEM INTEGRATION & IMPLEMENTATION: MARKET, BY REGION, 2023–2028 (USD MILLION)
                    6.3.2.5 Support & maintenance
                               TABLE 49 SUPPORT & MAINTENANCE: MARKET, BY REGION, 2017–2022 (USD MILLION)
                               TABLE 50 SUPPORT & MAINTENANCE: MARKET, BY REGION, 2023–2028 (USD MILLION)
           6.3.3 MANAGED SERVICES
                    6.3.3.1 Managed services to offer comprehensive approach to AI implementation
                               TABLE 51 MANAGED SERVICES: MARKET, BY REGION, 2017–2022 (USD MILLION)
                               TABLE 52 MANAGED SERVICES: MARKET, BY REGION, 2023–2028 (USD MILLION)
 
7 AI CODE TOOLS MARKET, BY TECHNOLOGY (Page No. - 124)
    7.1 INTRODUCTION 
           7.1.1 TECHNOLOGY: MARKET DRIVERS
                    FIGURE 37 MACHINE LEARNING SEGMENT TO HOLD LARGEST MARKET DURING FORECAST PERIOD
                    TABLE 53 TOOLS: MARKET, BY TECHNOLOGY, 2017–2022 (USD MILLION)
                    TABLE 54 TOOLS: MARKET, BY TECHNOLOGY, 2023–2028 (USD MILLION)
    7.2 MACHINE LEARNING 
           7.2.1 MACHINE LEARNING TECHNIQUES TO ENABLE DATA-DRIVEN DECISION-MAKING
                    TABLE 55 MACHINE LEARNING: MARKET, BY REGION, 2017–2022 (USD MILLION)
                    TABLE 56 MACHINE LEARNING: MARKET, BY REGION, 2023–2028 (USD MILLION)
           7.2.2 DEEP LEARNING
                    7.2.2.1 Recurrent neural networks
                    7.2.2.2 Long short-term memory (LSTM)
    7.3 NATURAL LANGUAGE PROCESSING 
           7.3.1 NLP-BASED AI CODE TOOLS TO TRANSFORM CUSTOMER SERVICE, CONTENT GENERATION, AND INFORMATION RETRIEVAL
                    TABLE 57 NATURAL LANGUAGE PROCESSING: MARKET, BY REGION, 2017–2022 (USD MILLION)
                    TABLE 58 NATURAL LANGUAGE PROCESSING: MARKET, BY REGION, 2023–2028 (USD MILLION)
           7.3.2 NATURAL LANGUAGE UNDERSTANDING (NLU)
           7.3.3 NATURAL LANGUAGE INTERFACE FOR CODE
    7.4 GENERATIVE AI 
           7.4.1 GENERATIVE AI TO AUTOMATE REPETITIVE CODING TASKS AND INCREASE PRODUCTIVITY
                    TABLE 59 GENERATIVE AI: MARKET, BY REGION, 2017–2022 (USD MILLION)
                    TABLE 60 GENERATIVE AI: MARKET, BY REGION, 2023–2028 (USD MILLION)
           7.4.2 LARGE LANGUAGE MODELS (LLMS)
           7.4.3 CODE GENERATION MODELS
 
8 AI CODE TOOLS MARKET, BY APPLICATION (Page No. - 132)
    8.1 INTRODUCTION 
           FIGURE 38 DATA SCIENCE & MACHINE LEARNING APPLICATION TO HOLD LARGEST MARKET DURING FORECAST PERIOD
           TABLE 61 MARKET, BY APPLICATION, 2017–2022 (USD MILLION)
           TABLE 62 MARKET, BY APPLICATION, 2023–2028 (USD MILLION)
    8.2 DATA SCIENCE & MACHINE LEARNING 
           8.2.1 AI CODE TOOLS TO AUTOMATE DATA CLEANING AND DATA TRANSFORMATION TASKS, SAVING TIME AND REDUCING RISK OF HUMAN ERRORS
                    TABLE 63 DATA SCIENCE & MACHINE LEARNING: MARKET, BY REGION, 2017–2022 (USD MILLION)
                    TABLE 64 DATA SCIENCE & MACHINE LEARNING: MARKET, BY REGION, 2023–2028 (USD MILLION)
    8.3 CLOUD SERVICES & DEVOPS 
           8.3.1 AI CODE TOOLS TO AUTOMATE AND STREAMLINE DEVOPS PROCESSES
                    TABLE 65 CLOUD SERVICES & DEVOPS: MARKET, BY REGION, 2017–2022 (USD MILLION)
                    TABLE 66 CLOUD SERVICES & DEVOPS: MARKET, BY REGION, 2023–2028 (USD MILLION)
    8.4 WEB DEVELOPMENT 
           8.4.1 AI CODE TOOLS TO ENHANCE EFFICIENCY, SPEED, AND QUALITY OF WEB DEVELOPMENT PROJECTS
                    TABLE 67 WEB DEVELOPMENT: AI CODE TOOLS MARKET, BY REGION, 2017–2022 (USD MILLION)
                    TABLE 68 WEB DEVELOPMENT: MARKET, BY REGION, 2023–2028 (USD MILLION)
    8.5 MOBILE APP DEVELOPMENT 
           8.5.1 AI ALGORITHMS TO ASSIST IN ENHANCED USER EXPERIENCES, PERSONALIZED RECOMMENDATIONS, VOICE RECOGNITION, AND PREDICTIVE ANALYTICS
                    TABLE 69 MOBILE APP DEVELOPMENT: MARKET, BY REGION, 2017–2022 (USD MILLION)
                    TABLE 70 MOBILE APP DEVELOPMENT: MARKET, BY REGION, 2023–2028 (USD MILLION)
    8.6 GAMING DEVELOPMENT 
           8.6.1 AI CODE TOOLS TO CREATE IMMERSIVE AND ENGAGING GAMING EXPERIENCES
                    TABLE 71 GAME DEVELOPMENT: MARKET, BY REGION, 2017–2022 (USD MILLION)
                    TABLE 72 GAME DEVELOPMENT: MARKET, BY REGION, 2023–2028 (USD MILLION)
    8.7 EMBEDDED SYSTEMS 
           8.7.1 AI-DRIVEN CODE GENERATION TO TRANSFORM FIELD OF EMBEDDED SYSTEM DEVELOPMENT
                    TABLE 73 EMBEDDED SYSTEMS: MARKET, BY REGION, 2017–2022 (USD MILLION)
                    TABLE 74 EMBEDDED SYSTEMS: MARKET, BY REGION, 2023–2028 (USD MILLION)
    8.8 OTHER APPLICATIONS 
           TABLE 75 OTHER APPLICATIONS: MARKET, BY REGION, 2017–2022 (USD MILLION)
           TABLE 76 OTHER APPLICATIONS: MARKET, BY REGION, 2023–2028 (USD MILLION)
 
9 AI CODE TOOLS MARKET, BY VERTICAL (Page No. - 146)
    9.1 INTRODUCTION 
           9.1.1 VERTICAL: MARKET DRIVERS
                    TABLE 77 MAJOR USE CASES, BY VERTICAL
                    FIGURE 39 HEALTHCARE & LIFE SCIENCES VERTICAL TO REGISTER HIGHEST CAGR DURING FORECAST PERIOD
                    TABLE 78 MARKET, BY VERTICAL, 2017–2022 (USD MILLION)
                    TABLE 79 MARKET, BY VERTICAL, 2023–2028 (USD MILLION)
    9.2 BFSI 
           9.2.1 AUTOMATION OF DOCUMENT PROCESSING AND ANALYSIS TO ENSURE EFFICIENCY AND AGILITY
                    TABLE 80 BFSI: MARKET, BY REGION, 2017–2022 (USD MILLION)
                    TABLE 81 BFSI: MARKET, BY REGION, 2023–2028 (USD MILLION)
    9.3 IT & ITES 
           9.3.1 AI CODE TOOLS TO REDUCE HUMAN ERRORS AND ACCELERATE PROJECT TIMELINES
                    TABLE 82 IT & ITES: MARKET, BY REGION, 2017–2022 (USD MILLION)
                    TABLE 83 IT & ITES: MARKET, BY REGION, 2023–2028 (USD MILLION)
    9.4 HEALTHCARE & LIFE SCIENCES 
           9.4.1 AI CODE TOOLS TO REVOLUTIONIZE DRUG DISCOVERY AND DEVELOPMENT OF PERSONALIZED MEDICINE
                    TABLE 84 HEALTHCARE & LIFE SCIENCES: MARKET, BY REGION, 2017–2022 (USD MILLION)
                    TABLE 85 HEALTHCARE & LIFE SCIENCES: MARKET, BY REGION, 2023–2028 (USD MILLION)
    9.5 MANUFACTURING 
           9.5.1 INTEGRATION OF AI CODE TOOLS TO OPTIMIZE PRODUCTION PROCESSES, REDUCE COSTS, AND ENHANCE PRODUCT QUALITY
                    TABLE 86 MANUFACTURING: MARKET, BY REGION, 2017–2022 (USD MILLION)
                    TABLE 87 MANUFACTURING: MARKET, BY REGION, 2023–2028 (USD MILLION)
    9.6 RETAIL & ECOMMERCE 
           9.6.1 AI-DRIVEN VIRTUAL HELPERS TO MAKE SHOPPING EXPERIENCE EFFICIENT AND INTERACTIVE
                    TABLE 88 RETAIL & ECOMMERCE: AI CODE TOOLS MARKET, BY REGION, 2017–2022 (USD MILLION)
                    TABLE 89 RETAIL & ECOMMERCE: MARKET, BY REGION, 2023–2028 (USD MILLION)
    9.7 TELECOMMUNICATIONS 
           9.7.1 AI CODE TOOLS TO OPTIMIZE NETWORK MANAGEMENT, ENHANCE CUSTOMER EXPERIENCES, AND IMPROVE SECURITY MEASURES
                    TABLE 90 TELECOMMUNICATIONS: MARKET, BY REGION, 2017–2022 (USD MILLION)
                    TABLE 91 TELECOMMUNICATIONS: MARKET, BY REGION, 2023–2028 (USD MILLION)
    9.8 GOVERNMENT & PUBLIC SECTOR 
           9.8.1 AI APPLICATIONS TO ENHANCE EFFICIENCY, ACCURACY, AND CITIZEN-CENTRIC GOVERNANCE
                    TABLE 92 GOVERNMENT & PUBLIC SECTOR: MARKET, BY REGION, 2017–2022 (USD MILLION)
                    TABLE 93 GOVERNMENT & PUBLIC SECTOR: MARKET, BY REGION, 2023–2028 (USD MILLION)
    9.9 MEDIA & ENTERTAINMENT 
           9.9.1 AI CODE TOOLS TO ENHANCE CONTENT PERSONALIZATION, PRODUCTION EFFICIENCY, AND AUDIENCE ENGAGEMENT
                    TABLE 94 MEDIA & ENTERTAINMENT: MARKET, BY REGION, 2017–2022 (USD MILLION)
                    TABLE 95 MEDIA & ENTERTAINMENT: MARKET, BY REGION, 2023–2028 (USD MILLION)
    9.10 OTHER VERTICALS 
           TABLE 96 OTHER VERTICALS: MARKET, BY REGION, 2017–2022 (USD MILLION)
           TABLE 97 OTHER VERTICALS: MARKET, BY REGION, 2023–2028 (USD MILLION)
 
10 AI CODE TOOLS MARKET, BY REGION (Page No. - 163)
     10.1 INTRODUCTION 
               FIGURE 40 SOUTH AFRICA TO WITNESS HIGHEST CAGR DURING FORECAST PERIOD
               FIGURE 41 ASIA PACIFIC TO ACCOUNT FOR HIGHEST CAGR DURING FORECAST PERIOD
               TABLE 98 MARKET, BY REGION, 2017–2022 (USD MILLION)
               TABLE 99 MARKET, BY REGION, 2023–2028 (USD MILLION)
     10.2 NORTH AMERICA 
             10.2.1 NORTH AMERICA: MARKET DRIVERS
             10.2.2 NORTH AMERICA: IMPACT OF RECESSION
                       FIGURE 42 NORTH AMERICA: AI CODE TOOLS MARKET SNAPSHOT
                       TABLE 100 NORTH AMERICA: MARKET, BY COUNTRY, 2017–2022 (USD MILLION)
                       TABLE 101 NORTH AMERICA: MARKET, BY COUNTRY, 2023–2028 (USD MILLION)
                       TABLE 102 NORTH AMERICA: MARKET, BY OFFERING, 2017–2022 (USD MILLION)
                       TABLE 103 NORTH AMERICA: MARKET, BY OFFERING, 2023–2028 (USD MILLION)
                       TABLE 104 NORTH AMERICA: MARKET, BY TECHNOLOGY, 2017–2022 (USD MILLION)
                       TABLE 105 NORTH AMERICA: MARKET, BY TECHNOLOGY, 2023–2028 (USD MILLION)
                       TABLE 106 NORTH AMERICA: MARKET, BY DEPLOYMENT MODE, 2017–2022 (USD MILLION)
                       TABLE 107 NORTH AMERICA: MARKET, BY DEPLOYMENT MODE, 2023–2028 (USD MILLION)
                       TABLE 108 NORTH AMERICA: AI CODE TOOLS MARKET, BY SERVICE, 2017–2022 (USD MILLION)
                       TABLE 109 NORTH AMERICA: MARKET, BY SERVICE, 2023–2028 (USD MILLION)
                       TABLE 110 NORTH AMERICA: MARKET, BY PROFESSIONAL SERVICE, 2017–2022 (USD MILLION)
                       TABLE 111 NORTH AMERICA: MARKET, BY PROFESSIONAL SERVICE, 2023–2028 (USD MILLION)
                       TABLE 112 NORTH AMERICA: MARKET, BY APPLICATION, 2017–2022 (USD MILLION)
                       TABLE 113 NORTH AMERICA: MARKET, BY APPLICATION, 2023–2028 (USD MILLION)
                       TABLE 114 NORTH AMERICA: MARKET, BY VERTICAL, 2017–2022 (USD MILLION)
                       TABLE 115 NORTH AMERICA: MARKET, BY VERTICAL, 2023–2028 (USD MILLION)
             10.2.3 US
                       10.2.3.1 Government policies and increasing number of tech startups to drive market
             10.2.4 CANADA
                       10.2.4.1 Focus on AI and government investments to fuel market growth
     10.3 EUROPE 
             10.3.1 EUROPE: MARKET DRIVERS
             10.3.2 EUROPE: IMPACT OF RECESSION
                       TABLE 116 EUROPE: AI CODE TOOLS MARKET, BY COUNTRY, 2017–2022 (USD MILLION)
                       TABLE 117 EUROPE: MARKET, BY COUNTRY, 2023–2028 (USD MILLION)
                       TABLE 118 EUROPE: MARKET, BY OFFERING, 2017–2022 (USD MILLION)
                       TABLE 119 EUROPE: MARKET, BY OFFERING, 2023–2028 (USD MILLION)
                       TABLE 120 EUROPE: MARKET, BY TECHNOLOGY, 2017–2022 (USD MILLION)
                       TABLE 121 EUROPE: MARKET, BY TECHNOLOGY, 2023–2028 (USD MILLION)
                       TABLE 122 EUROPE: MARKET, BY DEPLOYMENT MODE, 2017–2022 (USD MILLION)
                       TABLE 123 EUROPE: MARKET, BY DEPLOYMENT MODE, 2023–2028 (USD MILLION)
                       TABLE 124 EUROPE: MARKET, BY SERVICE, 2017–2022 (USD MILLION)
                       TABLE 125 EUROPE: MARKET, BY SERVICE, 2023–2028 (USD MILLION)
                       TABLE 126 EUROPE: MARKET, BY PROFESSIONAL SERVICE, 2017–2022 (USD MILLION)
                       TABLE 127 EUROPE: MARKET, BY PROFESSIONAL SERVICE, 2023–2028 (USD MILLION)
                       TABLE 128 EUROPE: MARKET, BY APPLICATION, 2017–2022 (USD MILLION)
                       TABLE 129 EUROPE: MARKET, BY APPLICATION, 2023–2028 (USD MILLION)
                       TABLE 130 EUROPE: MARKET, BY VERTICAL, 2017–2022 (USD MILLION)
                       TABLE 131 EUROPE: AI CODE TOOLS MARKET, BY VERTICAL, 2023–2028 (USD MILLION)
             10.3.3 UK
                       10.3.3.1 Robust regulatory frameworks and research excellence to propel market
             10.3.4 GERMANY
                       10.3.4.1 Highly skilled labor force and strong infrastructure to drive adoption of AI and ML technologies
             10.3.5 FRANCE
                       10.3.5.1 Increasing funding for AI startups to fuel development of AI ecosystem
             10.3.6 SPAIN
                       10.3.6.1 Public-private collaboration programs that integrate AI across various vertical sectors to drive digital transformation
             10.3.7 ITALY
                       10.3.7.1 Agility in adopting latest technological advancements to fuel market growth
             10.3.8 REST OF EUROPE
     10.4 ASIA PACIFIC 
             10.4.1 ASIA PACIFIC: MARKET DRIVERS
             10.4.2 ASIA PACIFIC: IMPACT OF RECESSION
                       FIGURE 43 ASIA PACIFIC: AI CODE TOOLS MARKET SNAPSHOT
                       TABLE 132 ASIA PACIFIC: MARKET, BY REGION, 2017–2022 (USD MILLION)
                       TABLE 133 ASIA PACIFIC: MARKET, BY REGION, 2023–2028 (USD MILLION)
                       TABLE 134 ASIA PACIFIC: MARKET, BY OFFERING, 2017–2022 (USD MILLION)
                       TABLE 135 ASIA PACIFIC: MARKET, BY OFFERING, 2023–2028 (USD MILLION)
                       TABLE 136 ASIA PACIFIC: MARKET, BY TECHNOLOGY, 2017–2022 (USD MILLION)
                       TABLE 137 ASIA PACIFIC: MARKET, BY TECHNOLOGY, 2023–2028 (USD MILLION)
                       TABLE 138 ASIA PACIFIC: MARKET, BY DEPLOYMENT MODE, 2017–2022 (USD MILLION)
                       TABLE 139 ASIA PACIFIC: MARKET, BY DEPLOYMENT MODE, 2023–2028 (USD MILLION)
                       TABLE 140 ASIA PACIFIC: MARKET, BY SERVICE, 2017–2022 (USD MILLION)
                       TABLE 141 ASIA PACIFIC: MARKET, BY SERVICE, 2023–2028 (USD MILLION)
                       TABLE 142 ASIA PACIFIC: MARKET, BY PROFESSIONAL SERVICE, 2017–2022 (USD MILLION)
                       TABLE 143 ASIA PACIFIC: MARKET, BY PROFESSIONAL SERVICE, 2023–2028 (USD MILLION)
                       TABLE 144 ASIA PACIFIC: MARKET, BY APPLICATION, 2017–2022 (USD MILLION)
                       TABLE 145 ASIA PACIFIC: MARKET, BY APPLICATION, 2023–2028 (USD MILLION)
                       TABLE 146 ASIA PACIFIC: MARKET, BY VERTICAL, 2017–2022 (USD MILLION)
                       TABLE 147 ASIA PACIFIC: AI CODE TOOLS MARKET, BY VERTICAL, 2023–2028 (USD MILLION)
             10.4.3 CHINA
                       10.4.3.1 Government R&D initiatives and global investments to boost market
             10.4.4 JAPAN
                       10.4.4.1 Robust integration of AI into robotics to boost market
             10.4.5 INDIA
                       10.4.5.1 India's technological ecosystem supported by government policies and increased R&D investments to fuel market growth
             10.4.6 ASEAN COUNTRIES
                       10.4.6.1 Competitive wages, improved business regulations, upgraded infrastructure, and growing domestic demand to accelerate growth
             10.4.7 AUSTRALIA & NEW ZEALAND
                       10.4.7.1 Increasing resilience and investments in software tools to bolster market
             10.4.8 REST OF ASIA PACIFIC
     10.5 MIDDLE EAST & AFRICA 
             10.5.1 MIDDLE EAST & AFRICA: MARKET DRIVERS
             10.5.2 MIDDLE EAST & AFRICA: IMPACT OF RECESSION
                       TABLE 148 MIDDLE EAST & AFRICA: AI CODE TOOLS MARKET, BY REGION, 2017–2022 (USD MILLION)
                       TABLE 149 MIDDLE EAST & AFRICA: MARKET, BY REGION, 2023–2028 (USD MILLION)
                       TABLE 150 MIDDLE EAST & AFRICA: MARKET, BY OFFERING, 2017–2022 (USD MILLION)
                       TABLE 151 MIDDLE EAST & AFRICA: MARKET, BY OFFERING, 2023–2028 (USD MILLION)
                       TABLE 152 MIDDLE EAST & AFRICA: MARKET, BY TECHNOLOGY, 2017–2022 (USD MILLION)
                       TABLE 153 MIDDLE EAST & AFRICA: MARKET, BY TECHNOLOGY, 2023–2028 (USD MILLION)
                       TABLE 154 MIDDLE EAST & AFRICA: MARKET, BY DEPLOYMENT MODE, 2017–2022 (USD MILLION)
                       TABLE 155 MIDDLE EAST & AFRICA: MARKET, BY DEPLOYMENT MODE, 2023–2028 (USD MILLION)
                       TABLE 156 MIDDLE EAST & AFRICA: MARKET, BY SERVICE, 2017–2022 (USD MILLION)
                       TABLE 157 MIDDLE EAST & AFRICA: MARKET, BY SERVICE, 2023–2028 (USD MILLION)
                       TABLE 158 MIDDLE EAST & AFRICA: MARKET, BY PROFESSIONAL SERVICE, 2017–2022 (USD MILLION)
                       TABLE 159 MIDDLE EAST & AFRICA: MARKET, BY PROFESSIONAL SERVICE, 2023–2028 (USD MILLION)
                       TABLE 160 MIDDLE EAST & AFRICA: MARKET, BY APPLICATION, 2017–2022 (USD MILLION)
                       TABLE 161 MIDDLE EAST & AFRICA: MARKET, BY APPLICATION, 2023–2028 (USD MILLION)
                       TABLE 162 MIDDLE EAST & AFRICA: MARKET, BY VERTICAL, 2017–2022 (USD MILLION)
                       TABLE 163 MIDDLE EAST & AFRICA: AI CODE TOOLS MARKET, BY VERTICAL, 2023–2028 (USD MILLION)
             10.5.3 UAE
                       10.5.3.1 Government initiatives aimed at fostering knowledge-based economy to drive market
             10.5.4 KSA
                       10.5.4.1 Technological advancements and economic diversification through Vision 2030 initiative to accelerate market growth
             10.5.5 EGYPT
                       10.5.5.1 Rapid adoption of advanced technologies to boost market
             10.5.6 SOUTH AFRICA
                       10.5.6.1 Increased focus on cloud-based software products to propel market growth
             10.5.7 REST OF MIDDLE EAST & AFRICA
     10.6 LATIN AMERICA 
             10.6.1 LATIN AMERICA: MARKET DRIVERS
             10.6.2 LATIN AMERICA: IMPACT OF RECESSION
                       TABLE 164 LATIN AMERICA: AI CODE TOOLS MARKET, BY REGION, 2017–2022 (USD MILLION)
                       TABLE 165 LATIN AMERICA: MARKET, BY REGION, 2023–2028 (USD MILLION)
                       TABLE 166 LATIN AMERICA: MARKET, BY OFFERING, 2017–2022 (USD MILLION)
                       TABLE 167 LATIN AMERICA: MARKET, BY OFFERING, 2023–2028 (USD MILLION)
                       TABLE 168 LATIN AMERICA: MARKET, BY TECHNOLOGY, 2017–2022 (USD MILLION)
                       TABLE 169 LATIN AMERICA: MARKET, BY TECHNOLOGY, 2023–2028 (USD MILLION)
                       TABLE 170 LATIN AMERICA: MARKET, BY DEPLOYMENT MODE, 2017–2022 (USD MILLION)
                       TABLE 171 LATIN AMERICA: MARKET, BY DEPLOYMENT MODE, 2023–2028 (USD MILLION)
                       TABLE 172 LATIN AMERICA: MARKET, BY SERVICE, 2017–2022 (USD MILLION)
                       TABLE 173 LATIN AMERICA: MARKET, BY SERVICE, 2023–2028 (USD MILLION)
                       TABLE 174 LATIN AMERICA: MARKET, BY PROFESSIONAL SERVICE, 2017–2022 (USD MILLION)
                       TABLE 175 LATIN AMERICA: MARKET, BY PROFESSIONAL SERVICE, 2023–2028 (USD MILLION)
                       TABLE 176 LATIN AMERICA: MARKET, BY APPLICATION, 2017–2022 (USD MILLION)
                       TABLE 177 LATIN AMERICA: MARKET, BY APPLICATION, 2023–2028 (USD MILLION)
                       TABLE 178 LATIN AMERICA: MARKET, BY VERTICAL, 2017–2022 (USD MILLION)
                       TABLE 179 LATIN AMERICA: AI CODE TOOLS MARKET, BY VERTICAL, 2023–2028 (USD MILLION)
             10.6.3 BRAZIL
                       10.6.3.1 Brazil's vibrant technology ecosystem to drive software development industry
             10.6.4 MEXICO
                       10.6.4.1 Dynamic private sector and increasing investments in digital transformation to accelerate market growth
             10.6.5 REST OF LATIN AMERICA
 
11 COMPETITIVE LANDSCAPE (Page No. - 215)
     11.1 OVERVIEW 
     11.2 STRATEGIES ADOPTED BY KEY PLAYERS 
               TABLE 180 STRATEGIES DEPLOYED BY KEY AI CODE TOOL VENDORS
     11.3 REVENUE ANALYSIS 
               FIGURE 44 BUSINESS SEGMENT REVENUE ANALYSIS FOR KEY COMPANIES, 2020–2022 (USD MILLION)
     11.4 MARKET SHARE ANALYSIS FOR KEY PUBLIC COMPANIES 
               FIGURE 45 MARKET SHARE ANALYSIS FOR KEY PLAYERS, 2022
               TABLE 181 AI CODE TOOLS MARKET: INTENSITY OF COMPETITIVE RIVALRY
     11.5 BRAND/PRODUCT COMPARATIVE ANALYSIS 
               TABLE 182 BRAND/PRODUCT COMPARATIVE ANALYSIS
     11.6 COMPANY EVALUATION MATRIX 
             11.6.1 STARS
             11.6.2 EMERGING LEADERS
             11.6.3 PERVASIVE PLAYERS
             11.6.4 PARTICIPANTS
                       FIGURE 46 COMPANY EVALUATION MATRIX, 2023
             11.6.5 COMPANY FOOTPRINT OF KEY PLAYERS
                       TABLE 183 COMPANY FOOTPRINT OF KEY PLAYERS, 2023
     11.7 STARTUP/SME EVALUATION MATRIX, 2023 
             11.7.1 PROGRESSIVE COMPANIES
             11.7.2 RESPONSIVE COMPANIES
             11.7.3 DYNAMIC COMPANIES
             11.7.4 STARTING BLOCKS
                       FIGURE 47 STARTUP/SME EVALUATION MATRIX, 2023
             11.7.5 COMPETITIVE BENCHMARKING OF STARTUPS/SMES
                       TABLE 184 DETAILED LIST OF KEY SMES/STARTUPS
                       TABLE 185 COMPETITIVE BENCHMARKING OF SMES/STARTUPS, 2023
     11.8 COMPETITIVE SCENARIO AND TRENDS 
             11.8.1 PRODUCT LAUNCHES
                       TABLE 186 MARKET: PRODUCT LAUNCHES, 2020–2023
             11.8.2 DEALS
                       TABLE 187 MARKET: DEALS, 2020–2023
             11.8.3 OTHERS
                       TABLE 188 AI CODE TOOLS MARKET: OTHERS, 2020–2023
     11.9 VALUATION AND FINANCIAL METRICS OF KEY VENDORS 
               FIGURE 48 VALUATION AND FINANCIAL METRICS OF KEY VENDORS
     11.10 YTD PRICE TOTAL RETURN AND STOCK BETA OF KEY VENDORS 
               FIGURE 49 YTD PRICE TOTAL RETURN AND STOCK BETA OF KEY VENDORS
 
12 COMPANY PROFILES (Page No. - 232)
     12.1 INTRODUCTION 
     12.2 KEY PLAYERS 
(Business Overview, Products/Solutions/Services offered, Recent Developments, MnM View)*
             12.2.1 MICROSOFT
                       TABLE 189 MICROSOFT: BUSINESS OVERVIEW
                       FIGURE 50 MICROSOFT: COMPANY SNAPSHOT
                       TABLE 190 MICROSOFT: PRODUCTS/SOLUTIONS/SERVICES OFFERED
                       TABLE 191 MICROSOFT: PRODUCT LAUNCHES AND ENHANCEMENTS
                       TABLE 192 MICROSOFT: DEALS
             12.2.2 IBM
                       TABLE 193 IBM: BUSINESS OVERVIEW
                       FIGURE 51 IBM: COMPANY SNAPSHOT
                       TABLE 194 IBM: PRODUCTS/SOLUTIONS/SERVICES OFFERED
                       TABLE 195 IBM: PRODUCT LAUNCHES AND ENHANCEMENTS
                       TABLE 196 IBM: DEALS
                       TABLE 197 IBM: OTHERS
             12.2.3 GOOGLE
                       TABLE 198 GOOGLE: BUSINESS OVERVIEW
                       FIGURE 52 GOOGLE: COMPANY SNAPSHOT
                       TABLE 199 GOOGLE: PRODUCTS/SOLUTIONS/SERVICES OFFERED
                       TABLE 200 GOOGLE: PRODUCT LAUNCHES AND ENHANCEMENTS
                       TABLE 201 GOOGLE: DEALS
                       TABLE 202 GOOGLE: OTHERS
             12.2.4 AWS
                       TABLE 203 AWS: BUSINESS OVERVIEW
                       FIGURE 53 AWS: COMPANY SNAPSHOT
                       TABLE 204 AWS: PRODUCTS/SOLUTIONS/SERVICES OFFERED
                       TABLE 205 AWS: PRODUCT LAUNCHES AND ENHANCEMENTS
                       TABLE 206 AWS: DEALS
                       TABLE 207 AWS: OTHERS
             12.2.5 META
                       TABLE 208 META: BUSINESS OVERVIEW
                       FIGURE 54 META: COMPANY SNAPSHOT
                       TABLE 209 META: PRODUCTS/SOLUTIONS/SERVICES OFFERED
                       TABLE 210 META: PRODUCT LAUNCHES AND ENHANCEMENTS
                       TABLE 211 META: DEALS
             12.2.6 SALESFORCE
                       TABLE 212 SALESFORCE: BUSINESS OVERVIEW
                       FIGURE 55 SALESFORCE: COMPANY SNAPSHOT
                       TABLE 213 SALESFORCE: PRODUCTS/SOLUTIONS/SERVICES OFFERED
                       TABLE 214 SALESFORCE: PRODUCT LAUNCHES AND ENHANCEMENTS
                       TABLE 215 SALESFORCE: DEALS
                       TABLE 216 SALESFORCE: OTHERS
             12.2.7 OPENAI
                       TABLE 217 OPENAI: BUSINESS OVERVIEW
                       TABLE 218 OPENAI: PRODUCTS/SOLUTIONS/SERVICES OFFERED
                       TABLE 219 OPENAI: PRODUCT LAUNCHES AND ENHANCEMENTS
                       TABLE 220 OPENAI: DEALS
                       TABLE 221 OPENAI: OTHERS
             12.2.8 TABNINE
                       TABLE 222 TABNINE: BUSINESS OVERVIEW
                       TABLE 223 TABNINE: PRODUCTS/SOLUTIONS/SERVICES OFFERED
                       TABLE 224 TABNINE: PRODUCT LAUNCHES AND ENHANCEMENTS
                       TABLE 225 TABNINE: DEALS
             12.2.9 REPLIT
                       TABLE 226 REPLIT: BUSINESS OVERVIEW
                       TABLE 227 REPLIT: PRODUCTS/SOLUTIONS/SERVICES OFFERED
                       TABLE 228 REPLIT: PRODUCT LAUNCHES AND ENHANCEMENTS
                       TABLE 229 REPLIT: DEALS
                       TABLE 230 REPLIT: OTHERS
             12.2.10 SOURCEGRAPH
                       TABLE 231 SOURCEGRAPH: BUSINESS OVERVIEW
                       TABLE 232 SOURCEGRAPH: PRODUCTS/SOLUTIONS/SERVICES OFFERED
                       TABLE 233 SOURCEGRAPH: PRODUCT LAUNCHES AND ENHANCEMENTS
             12.2.11 MOOLYA
                       TABLE 234 MOOLYA: BUSINESS OVERVIEW
                       TABLE 235 MOOLYA: PRODUCTS/SOLUTIONS/SERVICES OFFERED
                       TABLE 236 MOOLYA: PRODUCT LAUNCHES AND ENHANCEMENTS
             12.2.12 SNYK
                       TABLE 237 SNYK: BUSINESS OVERVIEW
                       TABLE 238 SNYK: PRODUCTS/SOLUTIONS/SERVICES OFFERED
                       TABLE 239 SNYK: PRODUCT LAUNCHES AND ENHANCEMENTS
                       TABLE 240 SNYK: DEALS
                       TABLE 241 SNYK: OTHERS
             12.2.13 CIRCLECI
                       TABLE 242 CIRCLECI: BUSINESS OVERVIEW
                       TABLE 243 CIRCLECI: PRODUCTS/SOLUTIONS/SERVICES OFFERED
                       TABLE 244 CIRCLECI: PRODUCT LAUNCHES AND ENHANCEMENTS
                       TABLE 245 CIRCLECI: DEALS
             12.2.14 JETBRAINS
                       TABLE 246 JETBRAINS: BUSINESS OVERVIEW
                       TABLE 247 JETBRAINS: PRODUCTS/SOLUTIONS/SERVICES OFFERED
                       TABLE 248 JETBRAINS: PRODUCT LAUNCHES AND ENHANCEMENTS
                       TABLE 249 JETBRAINS: DEALS
             12.2.15 ADACORE
             12.2.16 WINGWARE
             12.2.17 DATADOG
             12.2.18 LIGHTNING AI
             12.2.19 KODEZI
             12.2.20 SOURCERY
     12.3 STARTUPS/SMES 
             12.3.1 CODEWP
             12.3.2 SQLAI.AI
             12.3.3 SINCODE AB
             12.3.4 SEEK AI
             12.3.5 ENZYME
             12.3.6 ASSISTIV AI
             12.3.7 CODIUM
             12.3.8 MUTABLE AI
             12.3.9 JUDINI
             12.3.10 SAFURAI
*Details on Business Overview, Products/Solutions/Services offered, Recent Developments, MnM View might not be captured in case of unlisted companies.
 
13 ADJACENT AND RELATED MARKETS (Page No. - 314)
     13.1 INTRODUCTION 
     13.2 LOW-CODE DEVELOPMENT PLATFORM MARKET - GLOBAL FORECAST TO 2025 
             13.2.1 MARKET DEFINITION
             13.2.2 MARKET OVERVIEW
                       FIGURE 56 LOW-CODE DEVELOPMENT PLATFORM MARKET SNAPSHOT, 2018–2025
             13.2.3 LOW-CODE DEVELOPMENT PLATFORM MARKET, BY COMPONENT
                       TABLE 250 LOW-CODE DEVELOPMENT PLATFORM MARKET, BY COMPONENT, 2018–2025 (USD MILLION)
             13.2.4 LOW-CODE DEVELOPMENT PLATFORM MARKET, BY APPLICATION
                       TABLE 251 LOW-CODE DEVELOPMENT PLATFORM MARKET, BY APPLICATION TYPE, 2018–2025 (USD MILLION)
             13.2.5 LOW-CODE DEVELOPMENT PLATFORM MARKET, BY DEPLOYMENT TYPE
                       TABLE 252 LOW-CODE DEVELOPMENT PLATFORM MARKET, BY DEPLOYMENT TYPE, 2018–2025 (USD MILLION)
             13.2.6 LOW-CODE DEVELOPMENT PLATFORM MARKET, BY ORGANIZATION SIZE
                       TABLE 253 LOW-CODE DEVELOPMENT PLATFORM MARKET, BY ORGANIZATION SIZE, 2018–2025 (USD MILLION)
             13.2.7 LOW-CODE DEVELOPMENT PLATFORM MARKET, BY INDUSTRY
                       TABLE 254 LOW-CODE DEVELOPMENT PLATFORM MARKET, BY INDUSTRY, 2018–2025 (USD MILLION)
             13.2.8 LOW-CODE DEVELOPMENT PLATFORM MARKET, BY REGION
                       TABLE 255 LOW-CODE DEVELOPMENT PLATFORM MARKET, BY REGION, 2018–2025 (USD MILLION)
     13.3 GENERATIVE AI MARKET - GLOBAL FORECAST TO 2030 
             13.3.1 MARKET DEFINITION
             13.3.2 MARKET OVERVIEW
                       TABLE 256 GLOBAL GENERATIVE AI MARKET SIZE AND GROWTH RATE, 2019–2022 (USD MILLION, Y-O-Y %)
                       TABLE 257 GLOBAL GENERATIVE AI MARKET SIZE AND GROWTH RATE, 2023–2030 (USD MILLION, Y-O-Y %)
             13.3.3 GENERATIVE AI MARKET, BY OFFERING
                       TABLE 258 GENERATIVE AI MARKET, BY OFFERING, 2019–2022 (USD MILLION)
                       TABLE 259 GENERATIVE AI MARKET, BY OFFERING, 2023–2030 (USD MILLION)
             13.3.4 GENERATIVE AI MARKET, BY REGION
                       TABLE 260 NORTH AMERICA: GENERATIVE AI MARKET, BY OFFERING, 2019–2022 (USD MILLION)
                       TABLE 261 NORTH AMERICA: GENERATIVE AI MARKET, BY OFFERING, 2023–2030 (USD MILLION)
 
14 APPENDIX (Page No. - 323)
     14.1 DISCUSSION GUIDE 
     14.2 KNOWLEDGESTORE: MARKETSANDMARKETS’ SUBSCRIPTION PORTAL 
     14.3 CUSTOMIZATION OPTIONS 
     14.4 RELATED REPORTS 
     14.5 AUTHOR DETAILS 

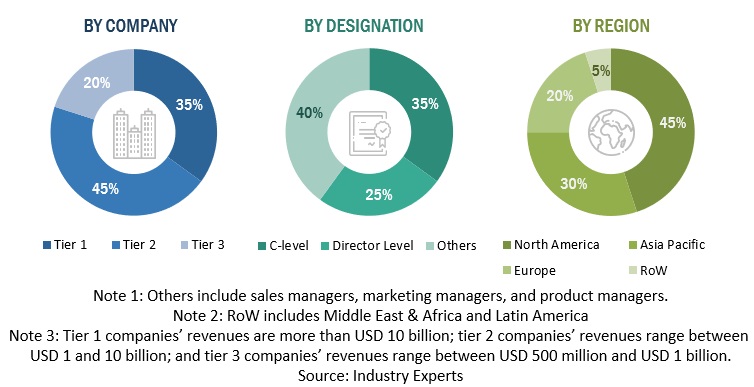
The research study for the AI code tools market involved extensive secondary sources, directories, and several journals. Primary sources were mainly industry experts from the core and related industries, preferred AI code tools provider, third-party service providers, consulting service providers, end users, and other commercial enterprises. In-depth interviews were conducted with various primary respondents, including key industry participants and subject matter experts, to obtain and verify critical qualitative and quantitative information, and assess the market’s prospects.

Secondary Research

The market size of companies offering AI code tools and services was arrived at based on secondary data available through paid and unpaid sources. It was also arrived at by analyzing the product portfolios of major companies and rating the companies based on their performance and quality.

In the secondary research process, various sources were referred to for identifying and collecting information for this study. Secondary sources included annual reports, press releases, and investor presentations of companies; white papers, journals, and certified publications; and articles from recognized authors, directories, and databases. The data was also collected from other secondary sources, such as journals, government websites, blogs, and vendor websites. Additionally, AI code tools spending of various countries was extracted from the respective sources. Secondary research was mainly used to obtain key information related to the industry’s value chain and supply chain to identify key players based on solutions, services, market classification, and segmentation according to offerings of major players, industry trends related to solutions, services, deployment modes, functionality, applications, verticals, and regions, and key developments from both market- and technology-oriented perspectives.

Primary Research

In the primary research process, various primary sources from both supply and demand sides were interviewed to obtain qualitative and quantitative information on the market. The primary sources from the supply side included various industry experts, including Chief Experience Officers (CXOs); Vice Presidents (VPs); directors from business development, marketing, and AI code tools expertise; related key executives from AI code tools vendors, SIs, professional service providers, and industry associations; and key opinion leaders.

Primary interviews were conducted to gather insights, such as market statistics, revenue data collected from solutions and services, market breakups, market size estimations, market forecasts, and data triangulation. Primary research also helped understand various trends related to technologies, applications, deployments, and regions. Stakeholders from the demand side, such as Chief Information Officers (CIOs), Chief Technology Officers (CTOs), Chief Strategy Officers (CSOs), and end users using AI code tools, were interviewed to understand the buyer’s perspective on suppliers, products, service providers, and their current usage of AI code tools and services, which would impact the overall AI code tools market
AI Code Tools Market Size, and Share

To know about the assumptions considered for the study, download the pdf brochure

Market Size Estimation

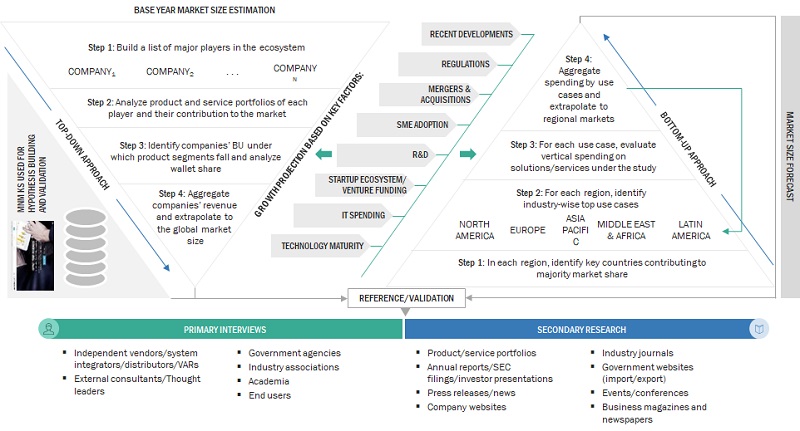
Multiple approaches were adopted for estimating and forecasting the AI code tools market. The first approach involves estimating the market size by summation of companies’ revenue generated through the sale of tools and services.

Market Size Estimation Methodology-Top-down approach

In the top-down approach, an exhaustive list of all the vendors offering solutions and services in the AI code tools market was prepared. The revenue contribution of the market vendors was estimated through annual reports, press releases, funding, investor presentations, paid databases, and primary interviews. Each vendor’s offerings were evaluated based on the breadth of solutions and services, deployment modes, applications, and verticals. The aggregate of all the companies’ revenue was extrapolated to reach the overall market size. Each subsegment was studied and analyzed for its global market size and regional penetration. The markets were triangulated through both primary and secondary research. The primary procedure included extensive interviews for key insights from industry leaders, such as CIOs, CEOs, VPs, directors, and marketing executives. The market numbers were further triangulated with the existing MarketsandMarkets repository for validation.

Market Size Estimation Methodology-Bottom-up approach

In the bottom-up approach, the adoption rate of AI code tools and services among different end users in key countries with respect to their regions contributing the most to the market share was identified. For cross-validation, the adoption of AI code tools and services among industries, along with different use cases with respect to their regions, was identified and extrapolated. Weightage was given to use cases identified in different regions for the market size calculation.

Based on the market numbers, the regional split was determined by primary and secondary sources. The procedure included the analysis of the AI code tools market’s regional penetration. Based on secondary research, the regional spending on Information and Communications Technology (ICT), socio-economic analysis of each country, strategic vendor analysis of major AI code tool providers, and organic and inorganic business development activities of regional and global players were estimated. With the data triangulation procedure and data validation through primaries, the exact values of the overall AI code tools market size and segments’ size were determined and confirmed using the study

Top-down and Bottom-up approaches
AI Code Tools Market Size, and Share

To know about the assumptions considered for the study, Request for Free Sample Report

Data Triangulation

After arriving at the overall market size using the market size estimation processes as explained above, the market was split into several segments and subsegments. To complete the overall market engineering process and arrive at the exact statistics of each market segment and subsegment, data triangulation and market breakup procedures were employed, wherever applicable. The overall market size was then used in the top-down procedure to estimate the size of other individual markets via percentage splits of the market segmentation.


Market Definition

According to IBM, AI code tools refer to a suite of advanced software solutions empowering developers and data scientists in the creation, training, and deployment of AI & ML models. These tools collectively enable the seamless integration of AI capabilities into applications and business processes, fostering innovation and efficiency in the development lifecycle.

According to Microsoft, AI code tools are a comprehensive set of software solutions designed to empower developers in building, training, and deploying AI models.

Stakeholders

  • AI code tool vendors
  • AI code solution vendors
  • Managed service providers
  • Support and maintenance service providers
  • System Integrators (SIs)/migration service providers
  • Value-added resellers (VARs) and distributors
  • Distributors and value-added resellers (VARs)
  • System integrators (SIs)
  • Independent software vendors (ISV)
  • Third-party providers
  • Technology providers

Report Objectives

  • To define, describe, and predict the AI code tools market by offering (tools and services), technology, application, vertical, and region
  • To provide detailed information related to major factors (drivers, restraints, opportunities, and industry-specific challenges) influencing the market growth
  • To analyze opportunities in the market and provide details of the competitive landscape for stakeholders and market leaders
  • To forecast the market size of segments for five main regions: North America, Europe, Asia Pacific, the Middle East & Africa, and Latin America
  • To profile key players and comprehensively analyze their market rankings and core competencies
  • To analyze competitive developments, such as partnerships, new product launches, and mergers and acquisitions, in the AI code tools market.

Available Customizations

With the given market data, MarketsandMarkets offers customizations as per the company’s specific needs. The following customization options are available for the report:

Product Analysis

  • Product matrix provides a detailed comparison of the product portfolio of each company

Geographic Analysis as per Feasibility

  • Further breakup of the North American AI code tools Market
  • Further breakup of the European Market
  • Further breakup of the Asia Pacific Market
  • Further breakup of the Middle East & Africa Market
  • Further breakup of the Latin American AI code tools Market

Company Information

  • Detailed analysis and profiling of additional market players (up to five)
Custom Market Research Services

We will customize the research for you, in case the report listed above does not meet with your exact requirements. Our custom research will comprehensively cover the business information you require to help you arrive at strategic and profitable business decisions.

Request Customization
Report Code
TC 8823
Published ON
Oct, 2023
Choose License Type
BUY NOW
  • SHARE
X
Request Customization
Speak to Analyst
Speak to Analyst
OR FACE-TO-FACE MEETING
PERSONALIZE THIS RESEARCH
  • Triangulate with your Own Data
  • Get Data as per your Format and Definition
  • Gain a Deeper Dive on a Specific Application, Geography, Customer or Competitor
  • Any level of Personalization
REQUEST A FREE CUSTOMIZATION
LET US HELP YOU!
  • What are the Known and Unknown Adjacencies Impacting the AI Code Tools Market
  • What will your New Revenue Sources be?
  • Who will be your Top Customer; what will make them switch?
  • Defend your Market Share or Win Competitors
  • Get a Scorecard for Target Partners
CUSTOMIZED WORKSHOP REQUEST
+1-888-600-6441
  • Call Us
  • +1-888-600-6441 (Corporate office hours)
  • +1-888-600-6441 (US/Can toll free)
  • +44-800-368-9399 (UK office hours)
CONNECT WITH US
ABOUT TRUST ONLINE
©2024 MarketsandMarkets Research Private Ltd. All rights reserved
DMCA.com Protection Status Website Feedback