Americas Cables Market

Americas Cables Market by Polymer and Insulation Type (Semiconducting polymer, XLPE, EPR, HEPR, low Voltage Cables), Semiconducting Layer (Inner & Outer Semiconducting layer), Application, Voltage, End User & Region – Global Forecast to 2029

Report Code: EP 8980 Mar, 2024, by marketsandmarkets.com

[281 Pages Report] The Americas Cables market is expected to grow from an estimated USD 10.9 billion by 2029 from an estimated USD 8.7 billion in 2024, at a CAGR of 4.5% during the forecast period. The demand for the Americas Cables Market is propelled by factors such as infrastructure expansion, urbanization, and industrialization. Additionally, the growing need for reliable power transmission and communication networks, particularly in sectors like energy, telecommunications, and transportation, further drives market demand. Technological advancements in cable manufacturing, such as the development of high-performance materials and smart cable systems, also contribute to the market's growth by meeting the evolving needs of various industries.

Americas Cables Market

To know about the assumptions considered for the study, Request for Free Sample Report

Americas Cables Market Opportunities

To know about the assumptions considered for the study, download the pdf brochure

Americas Cables market Dynamics

Driver: Integration of renewable energy sources into industrial facilities to reduce carbon footprint

Embracing renewable energy sources, such as solar and wind power, by industry players in the Americas, especially in the US, to reduce carbon footprint and energy costs is poised to significantly drive the cables market in the region. Renewable energy sources, including solar and wind farms, require extensive infrastructure that includes solar farms and wind turbines across the US. This expansion requires extensive cabling for connecting renewable energy generation facilities to the electrical grid, driving demand for power transmission and distribution cables. Also, solar and wind power generation facilities are often located in remote areas with abundant renewable resources. To transport electricity generated from these remote locations to urban centers and industrial zones with high energy demand, high-capacity transmission lines are essential. This demand for long-distance power transmission infrastructure will stimulate the market for high-voltage cables, such as 115 kV and 138 kV cables, in the US. 

The US has experienced a notable decline in carbon emissions from electricity production in recent years, mostly because of a shift from coal toward natural gas and renewable energy sources. The economic viability and competitiveness of renewable energy technologies are driving this transformation in addition to environmental concerns and climate change policies. Medium and high-voltage cables play a crucial role in integrating renewable energy sources into industrial facilities, transmitting electricity from solar arrays, wind farms, and other renewable sources to power manufacturing processes.

According to the data given by US Energy Information Administration in January 2024, wind and solar energy are poised to significantly increase their contribution to US electricity production over the next couple of years. It is anticipated that due to the influx of new solar projects, solar power output in the US will surge by 75%, moving from 163 billion kilowatt-hours (kWh) in 2023 to 286 billion kWh by 2025. Similarly, wind energy production is expected to see an 11% increase, going from 430 billion kWh in 2023 to 476 billion kWh in 2025. In 2023, the US electric power sector generated 4,017 billion kWh of electricity, out of which 22% or 874 billion kWh was produced using renewable energy sources—including wind, solar, hydro, biomass, and geothermal. For the first time, renewable energy production outpaced nuclear energy in 2021 and coal-fired generation in 2022. Due to the increasing demand for renewable energy, coal-fired power generation is expected to decrease by 18% from 665 to 548 billion kWh between 2023 and 2025. Despite these shifts, natural gas is projected to remain the predominant source of electricity in the US, with its production stabilizing around 1,700 billion kWh annually for 2024 and 2025. Nuclear energy output is expected to remain steady, with a slight increase from 776 billion kWh in 2023 to 797 billion kWh by 2025.

Restraints: Volatility in raw material prices

Fluctuations in prices of raw materials, such as copper and aluminum, can impact production costs and profitability of cable manufacturing companies. Copper, aluminum, plastic, rubber, and other raw materials are extensively used by these companies. The cost of these materials is influenced by various factors, such as trade regulations, geopolitical developments, global market dynamics, and economic situations. A rise in the cost of raw materials can increase production expenses for enterprises. This can lead to higher retail pricing, which may result in lower demand for cables if customers are unwilling to pay the extra costs.

Moreover, unexpected spikes in the cost of raw materials can disrupt production plans and supply chains. This can result in delayed project completion and possible penalties for suppliers and manufacturers. Businesses find it difficult to plan their budgets and investments because of this unpredictability, which can impede their efforts to innovate and grow.

Opportunity: Strong focus on increasing power generation capacity

The world has experienced a significant rise in power generation capacities over the years, driven by increasing energy demand, economic growth, and efforts to improve access to electricity. This upward trend reflects the global need for reliable and affordable energy sources to power devices and systems used in various sectors, including residential, commercial, industrial, and transportation. Countries across the globe have been actively investing in expanding their power generation capacities through the construction of new power plants and the modernization of existing facilities. This has resulted in an increase in the overall installed capacity of power generation plants.

The rise in power generation capacities encompasses a diverse mix of energy sources, including both conventional and renewable options. Conventional sources such as coal, natural gas, and oil have historically played a significant role in power generation, providing stable and consistent electricity supply. However, there has been a growing recognition of the environmental impact associated with these fossil fuel-based technologies, leading to a shift toward cleaner and more sustainable alternatives. Renewable energy sources, including solar, wind, hydroelectric, geothermal, and biomass, have experienced remarkable growth in recent years. Advances in technology, declining costs, and supportive government policies have spurred the deployment of renewable energy projects worldwide. Solar and wind power, in particular, have witnessed substantial expansion, driven by their scalability, increasing efficiency, and decreasing costs. Many countries have set renewable energy targets and implemented incentives to encourage the adoption of clean energy technologies. In addition to renewable energy, nuclear power continues to be a significant contributor to global power generation capacities. Nuclear power plants, with their large-scale and low-carbon electricity production, offer a reliable source of baseload power. While the nuclear energy sector has faced challenges related to safety concerns and waste management, some countries have continued to invest in new nuclear projects and operate existing facilities.

Challenges: Requirement of technical know-how to develop and install advanced cable products

Developing efficient transmission and distribution (T&D) infrastructure is crucial to address energy security concerns and the need to expand power generation capacity in countries in the Americas. Manufacturers and suppliers in the cables and accessories market must focus on producing high-quality materials and products that meet the reliability standards of customers. This requires specialized knowledge and skills to select appropriate materials, design conductors, apply insulation techniques and shielding technologies. Customers often have requirements for application-specific cables with specific voltage ratings, temperature resistance, and environmental conditions. Meeting these customization needs demands in-depth technical understanding and engineering expertise. Also, ensuring the quality and reliability of cables throughout the manufacturing process is paramount. This includes adherence to industry standards, conducting rigorous testing procedures, and implementing quality control measures. Staying abreast of these emerging technologies and incorporating them into cable design and production processes requires continuous learning and technical proficiency. Lack of technical expertise can lead to quality issues and product failures. Thus, the shortage of skilled professionals with expertise in cable manufacturing, installation, and maintenance poses a significant challenge. Recruiting and retaining qualified personnel in this highly specialized field can be challenging for companies operating in the cables market. Investing in technical training, research, and development to maintain expertise in cable technologies can incur significant costs for companies. Balancing the need for technical proficiency with cost considerations presents a challenge, particularly for smaller firms with limited resources.

Americas Cables Market Ecosystem

Notable players in this industry comprise long-standing, financially robust manufacturers of Americas Cables Market and related components. These companies have a significant track record in the market, offering a wide range of products, employing cutting-edge technologies, and maintaining robust global sales and marketing networks. Prominent companies in this market include Prysmian Group (Italy),  Southwire Company, LLC (US), Nexans (France), LS Cable & System Ltd (South Korea) and NKT a/s (Denmark).

Americas Cables Market Ecosystem

Low Voltage Cables, is expected to be the fastest growing market, based on polymer and insulation type.

The demand for dependable energy distribution in residential and commercial structures is driven by growing urbanization and infrastructure development. Additionally, low voltage cables are now more durable and perform better, which appeals to end users due to scientific breakthroughs in insulating materials. Last but not least, as the region's energy landscape changes, the increased adoption of smart home devices and renewable energy systems increases demand for low voltage cables.

Industrial, by end user, to hold the second-fastest market share during the forecast period.

The industrial sector drives demand for the Americas cable market due to its extensive reliance on robust and high-performance cable solutions for power transmission, control, and communication needs. Increasing industrialization, automation, and modernization initiatives further amplify the demand for advanced cable systems to support manufacturing processes and infrastructure development.

North America is expected to account for the largest and the fastest market during the forecast period.

The renewables and commercial sectors are driving the growth of the Americas Cables market in North America. The growth of wind and solar energy projects in the renewables sector is driving demand for cables with XLPE (cross-linked polyethylene) insulation, which ensures effective power transmission. The necessity for high-performance cables with EPR (Ethylene Propylene Rubber) insulation to support dependable power distribution and communication networks is further increased by the commercial sector's modernization programs. The need for cutting-edge cable solutions in the area is rising as a result of all these variables together.

North American Americas Cables Market Size, and Share

Key Market Players

The Americas Cables market is dominated by a few major players that have a wide regional presence. The major players in the market are Prysmian Group (Italy)Southwire Company, LLC (US), Nexans (France), LS Cable & System Ltd. (South Korea) and NKT A/S (Denmark). Between 2019 and 2023, Strategies such as product launches, contracts, agreements, partnerships, collaborations, alliances, acquisitions, and expansions are followed by these companies to capture a larger share of the Americas Cables market.

Get online access to the report on the World's First Market Intelligence Cloud

  • Easy to Download Historical Data & Forecast Numbers
  • Company Analysis Dashboard for high growth potential opportunities
  • Research Analyst Access for customization & queries
  • Competitor Analysis with Interactive dashboard
  • Latest News, Updates & Trend analysis
Request Sample

Scope of the Report

Report Metric

Details

Market size available for years

2022–2029

Base year considered

2023

Forecast period

2024–2029

Forecast units

Value (USD)

Segments Covered

Polymer and Insulation type, Semiconducting Layer, Voltage rating, Application, End User and Region

Geographies covered

North America, South America, and Central America

Companies covered

Prysmian Group (Italy), Southwire Company, LLC (US), Nexans (France), LS Cable & System Ltd. (South Korea), NKT A/S (Denmark), Trelleborg Group (South Korea), Tratos (Italy), PRAMKOR (South Korea), Hanwha Group (South Korea), Zhejiang Wanma Co., Ltd. (China), ZTT (China), HELUKABEL Group (Germany), Mixer S.P.A (Italy), Belden Inc. (US), Amphenol TPC (US), HJ Polymer China Co., (China), Avient Corporation (US), TFKable (Poland), Sumitomo Electric Industries, Ltd. (Japan), DOW (US), LEONI (Germany), Furukawa Electric Co., Ltd. (Japan), Saco Aei Polymers (US), BizLink Group (US), The Okonite Company (US), WTEC Energy Innovation (US), Electric Cable Compounds, Inc (US), and Borealis AG (Austria).

This research report categorizes the Americas Cables market by polymer and insulation type, semiconducting layer, voltage, application, end user, and region

On the basis of polymer and insulation type:
  • Semiconducting Polymer
  • Cross-Linked Polyethylene (XLPE)
  • Ethylene-Propylene Rubber (EPR)/ Ethylene Propylene Diene Monomer (EPDM)
  • Low Voltage Cables
On the basis of Semiconducting Later:
  • Inner
  • Outer
On the basis of Voltage Rating:
  • Upto 5 kV
  • 5-8 kV
  • 8-15 kV
  • 15-35 kV
  • 35-46 kV
  • 69 kV
  • 115 kV
  • 138 kV
On the basis of Application:
  • Underground
  • Submarine
On the basis of End User:
  • Industrial
  • Renewable Energy Sector
  • Commercial
On the basis of region:
  • North America
  • Central America
  • South America

Recent Developments

  • In December 2023, NKT secured a contract from Icelandic TSO Landsnet for over 200 km of 66 kV power cables, facilitating upgrades to Iceland's renewable energy-powered grid. This supports reliable electricity distribution, crucial during harsh winters. NKT's selection reflects their proven capability to withstand Iceland's challenging installation conditions. The contract strengthens NKT's relationship with Landsnet and enhances Iceland's grid efficiency and reliability. This collaboration aligns with European TSOs' and DSOs' investments to bolster grids for increasing electricity demands, underscoring NKT's role in supporting the transition to renewable energy and reinforcing its position in the market.
  • In September 2023,  Southwire Company, LLC and Resideo Technologies, Inc. underwent an agreement for the supply of Resideo’s Genesis Cable business, a provider of low-voltage wire and cable manufacturers based in Pleasant Prairie, WI.
  • In June 2023, Prysmina Group entered into a 3 year agreement with National Grid for medium voltage cable framework. With this agreement Prysmian will support UK’s electricity grid in becoming capable of distributing more electricity in the future, as a key enabler for the energy transition. Medium voltage cables will be supplied primarily from the Group’s manufacturing plant in Wrexham, North Wales, and will assist National Grid to expand and modernize the network supporting the increase in demand.
  • In April 2023, Nexans finalized the acquisition of Reka Cables, a Finnish manufacturer of high, medium, and low voltage cables. This strengthens their position in Nordic markets and aligns with their goal of becoming a pure electrification player by 2030. Reka's premium cables and manufacturing plants complement Nexans' existing operations, expanding their reach and expertise in the electrification value chain. This acquisition helps Nexans solidify its presence in the Nordics and advance its commitment to carbon neutrality.

Frequently Asked Questions (FAQ):

To speak to our analyst for a discussion on the above findings, click Speak to Analyst

TABLE OF CONTENTS
 
1 INTRODUCTION (Page No. - 34)
    1.1 STUDY OBJECTIVES 
    1.2 MARKET DEFINITION 
    1.3 INCLUSIONS AND EXCLUSIONS. 
           1.3.1 AMERICAS CABLES MARKET, BY POLYMER AND INSULATION TYPE
           1.3.2 MARKET, BY SEMI-CONDUCTING LAYER
           1.3.3 MARKET, BY VOLTAGE RATING
           1.3.4 MARKET, BY END USER
           1.3.5 MARKET, BY APPLICATION
    1.4 MARKET SCOPE 
           1.4.1 MARKET SEGMENTATION
           1.4.2 REGIONAL SCOPE
           1.4.3 YEARS CONSIDERED
    1.5 CURRENCY CONSIDERED 
    1.6 UNITS CONSIDERED 
    1.7 LIMITATIONS 
    1.8 STAKEHOLDERS 
    1.9 SUMMARY OF CHANGES 
    1.1 RECESSION IMPACT 
 
2 RESEARCH METHODOLOGY (Page No. - 40)
    2.1 RESEARCH DATA 
           FIGURE 1 AMERICAS CABLES MARKET: RESEARCH DESIGN
    2.2 MARKET BREAKDOWN AND DATA TRIANGULATION 
           FIGURE 2 DATA TRIANGULATION
           2.2.1 SECONDARY DATA
                    2.2.1.1 Key data from secondary sources
                    2.2.1.2 List of major secondary sources
           2.2.2 PRIMARY DATA
                    2.2.2.1 List of key participants in primary interviews
                    2.2.2.2 Breakdown of primaries
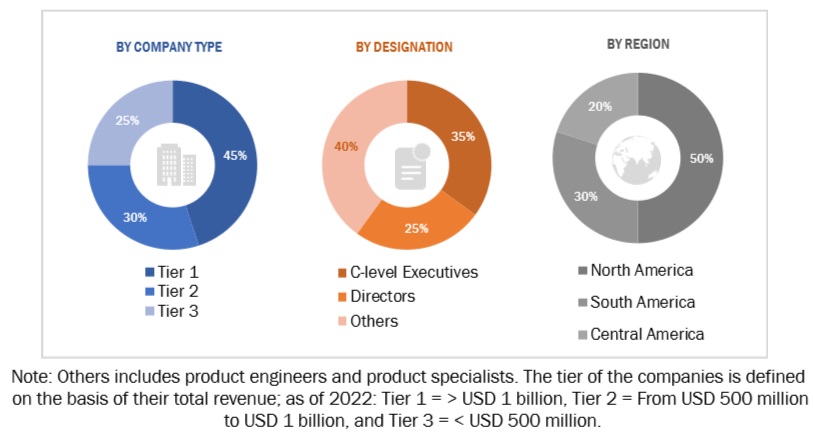
                               FIGURE 3 BREAKDOWN OF PRIMARY INTERVIEWS: BY COMPANY TYPE, DESIGNATION,  AND REGION
                               FIGURE 4 MAIN METRICS CONSIDERED TO ANALYZE AND ASSESS DEMAND  FOR CABLES IN AMERICAS
    2.3 MARKET SIZE ESTIMATION 
           2.3.1 BOTTOM-UP APPROACH
                    FIGURE 5 MARKET SIZE ESTIMATION METHODOLOGY: BOTTOM-UP APPROACH
           2.3.2 TOP-DOWN APPROACH
                    FIGURE 6 MARKET SIZE ESTIMATION METHODOLOGY: TOP-DOWN APPROACH
           2.3.3 DEMAND-SIDE ANALYSIS
                    2.3.3.1 Regional analysis
                    2.3.3.2 Country-level analysis
                    2.3.3.3 Assumptions for demand-side analysis
                    2.3.3.4 Calculations for demand-side analysis
           2.3.4 SUPPLY-SIDE ANALYSIS
                    FIGURE 7 KEY STEPS CONSIDERED TO ASSESS SUPPLY OF CABLES IN AMERICAS
                    FIGURE 8 AMERICAS CABLES MARKET: SUPPLY-SIDE ANALYSIS
                    2.3.4.1 Assumptions for supply-side analysis
                    2.3.4.2 Calculations for supply-side analysis
                               FIGURE 9 COMPANY REVENUE ANALYSIS, 2023
           2.3.5 GROWTH FORECAST
    2.4 RISK ASSESSMENT 
    2.5 IMPACT OF RECESSION ON AMERICAS CABLES MARKET 
 
3 EXECUTIVE SUMMARY (Page No. - 52)
    TABLE 1 AMERICAS CABLES MARKET SNAPSHOT 
    FIGURE 10 NORTH AMERICA DOMINATED MARKET IN 2023 
    FIGURE 11 SEMI-CONDUCTING POLYMER CABLES TO ACCOUNT FOR LARGER MARKET SHARE THROUGHOUT FORECAST PERIOD 
    FIGURE 12 OUTER SEMI-CONDUCTING LAYER TO HOLD LARGER SHARE OF MARKET THROUGHOUT FORECAST PERIOD 
    FIGURE 13 35–46 KV CABLES TO CAPTURE LARGEST SHARE OF AMERICAS MARKET FROM 2024 TO 2029 
    FIGURE 14 UNDERGROUND CABLES TO LEAD AMERICAS MARKET BETWEEN  2024 AND 2029 
    FIGURE 15 INDUSTRIAL SECTOR TO HOLD LARGEST SHARE OF MARKET THROUGHOUT FORECAST PERIOD 
 
4 PREMIUM INSIGHTS (Page No. - 57)
    4.1 ATTRACTIVE OPPORTUNITIES FOR PLAYERS IN AMERICAS CABLES MARKET 
           FIGURE 16 INVESTMENTS IN RENEWABLE ENERGY PROJECTS TO CREATE OPPORTUNITIES FOR PLAYERS IN MARKET
    4.2 MARKET, BY REGION 
           FIGURE 17 NORTH AMERICA TO REGISTER HIGHEST CAGR DURING FORECAST PERIOD
    4.3 NORTH AMERICAN CABLES MARKET, BY END USER AND COUNTRY 
           FIGURE 18 INDUSTRIAL SECTOR AND US HELD LARGEST SHARES OF NORTH AMERICAN MARKET IN 2024
    4.4 MARKET, BY POLYMER AND INSULATION TYPE 
           FIGURE 19 SEMI-CONDUCTING POLYMER CABLES TO DOMINATE MARKET IN AMERICAS  IN 2029
    4.5 MARKET, BY SEMI-CONDUCTING LAYER 
           FIGURE 20 OUTER SEMI-CONDUCTING LAYER TO ACCOUNT FOR LARGER SHARE OF MARKET IN 2029
    4.6 MARKET, BY END USER 
           FIGURE 21 INDUSTRIAL SECTOR TO ACCOUNT FOR LARGEST SHARE OF MARKET IN 2029
    4.7 MARKET, BY VOLTAGE RATING 
           FIGURE 22 35-46 SEGMENT TO ACCOUNT FOR LARGEST SHARE OF MARKET IN 2029
    4.8 MARKET, BY APPLICATION 
           FIGURE 23 UNDERGROUND SEGMENT TO ACCOUNT FOR LARGER SHARE OF MARKET IN 2029
 
5 MARKET OVERVIEW (Page No. - 61)
    5.1 INTRODUCTION 
    5.2 MARKET DYNAMICS 
           FIGURE 24 AMERICAS CABLES MARKET: DRIVERS, RESTRAINTS, OPPORTUNITIES, AND CHALLENGES
           5.2.1 DRIVERS
                    5.2.1.1 Integration of renewable energy sources into industrial facilities to reduce carbon footprint
                               FIGURE 25 PERCENTAGE OF RENEWABLE ENERGY IN TOTAL ELECTRICITY PRODUCTION IN US, BY SOURCE TYPE, 2022
                               FIGURE 26 US ANNUAL ELECTRICITY GENERATING CAPACITY USING RENEWABLES (GW), 2018–2024
                    5.2.1.2 Rapid industrialization and urbanization across Americas
                               FIGURE 27 URBAN POPULATION GROWTH IN US, 2012 VS. 2022
                    5.2.1.3 Supportive government policies and investments in underground cables, grid technologies, and infrastructure projects
                    5.2.1.4 Pressing need to modernize electrical grids to enhance resilience and reliability
           5.2.2 RESTRAINTS
                    5.2.2.1 Volatility in raw material prices
                    5.2.2.2 Delay in project authorization process due to complex regulatory and environmental policies
           5.2.3 OPPORTUNITIES
                    5.2.3.1 Strong focus on increasing power generation capacity
                               FIGURE 28 ANNUAL ELECTRICITY GENERATION WORLDWIDE, BY SOURCE (GW), 2019–2025
                    5.2.3.2 Adoption of smart grid technologies and development of innovative cable solutions
           5.2.4 CHALLENGES
                    5.2.4.1 Requirement for technical know-how to develop and install advanced cable products
                    5.2.4.2 Availability of low-cost cable solutions
    5.3 TRENDS/DISRUPTIONS IMPACTING CUSTOMER BUSINESS 
           FIGURE 29 TRENDS/DISRUPTIONS IMPACTING CUSTOMER BUSINESS
    5.4 ECOSYSTEM ANALYSIS 
           TABLE 2 ROLE OF PARTICIPANTS IN ECOSYSTEM
           FIGURE 30 KEY PLAYERS IN ECOSYSTEM
    5.5 INVESTMENTS AND FUNDING LANDSCAPE IN MARKET 
           FIGURE 31 FUNDING RAISED BY PLAYERS IN MARKET, 2021–2022
           TABLE 3 PRYSMIAN GROUP: FUNDING DETAILS
           TABLE 4 LEONI: FUNDING DETAILS
           TABLE 5 DOW: FUNDING DETAILS
    5.6 VALUE CHAIN ANALYSIS 
           FIGURE 32 MARKET: VALUE CHAIN ANALYSIS
    5.7 TECHNOLOGY ANALYSIS 
           5.7.1 CORE TECHNOLOGY
                    5.7.1.1 High-temperature superconducting (HTS) cables
                    5.7.1.2 Self-healing cables
           5.7.2 COMPLIMENTARY TECHNOLOGY
                    5.7.2.1 Smart grid solutions
                    5.7.2.2 Advanced insulation materials
           5.7.3 ADJACENT TECHNOLOGY
                    5.7.3.1 Monitoring and control systems
    5.8 PATENT ANALYSIS 
           FIGURE 33 MARKET: INNOVATIONS AND PATENT REGISTRATIONS, 2013–2023
           TABLE 6 MARKET: INNOVATIONS AND PATENT REGISTRATIONS, JANUARY 2019–DECEMBER 2023
    5.9 TRADE ANALYSIS 
           5.9.1 TRADE ANALYSIS FOR PRODUCTS COMPLY WITH HS CODE 8544
           5.9.2 EXPORT DATA
                    TABLE 7 EXPORT VALUES FOR HS CODE 8544-COMPLIANT PRODUCTS, BY COUNTRY,  2020–2022 (USD THOUSAND)
                    FIGURE 34 EXPORT DATA FOR HS CODE 8544-COMPLIANT PRODUCTS FOR TOP 5 COUNTRIES, 2020–2022 (USD THOUSAND)
           5.9.3 IMPORT DATA
                    TABLE 8 IMPORT VALUES FOR HS CODE 8544-COMPLIANT PRODUCTS, BY COUNTRY,  2020–2022 (USD THOUSAND)
                    FIGURE 35 IMPORT DATA FOR HS CODE 8544-COMPLIANT PRODUCTS FOR TOP 5 COUNTRIES, 2020–2022 (USD THOUSAND)
    5.10 PRICING ANALYSIS 
           FIGURE 36 AVERAGE SELLING PRICE OF CABLES, BY POLYMER AND INSULATION TYPE, 2022–2024 (USD/TONNES)
           TABLE 9 AVERAGE SELLING PRICE OF CABLES, BY POLYMER AND INSULATION TYPE,  2022–2024 (USD/TONNES)
           FIGURE 37 AVERAGE SELLING PRICE OF CABLES, BY SEMI-CONDUCTING POLYMER CABLE TYPE, 2022–2024 (USD/TONNES)
           TABLE 10 AVERAGE SELLING PRICE OF CABLES, BY SEMI-CONDUCTING POLYMER CABLE TYPE,  2022–2024 (USD/TONNES)
           FIGURE 38 AVERAGE SELLING PRICE OF CABLES, BY REGION, 2022–2024 (USD/TONNES)
           TABLE 11 AVERAGE SELLING PRICE OF CABLES, BY REGION, 2022–2024 (USD/TONNES)
    5.11 REGULATORY LANDSCAPE 
           5.11.1 REGULATORY BODIES, GOVERNMENT AGENCIES, AND OTHER ORGANIZATIONS
                    TABLE 12 NORTH AMERICA: LIST OF REGULATORY BODIES, GOVERNMENT AGENCIES, AND OTHER ORGANIZATIONS
                    TABLE 13 SOUTH AMERICA: LIST OF REGULATORY BODIES, GOVERNMENT AGENCIES, AND OTHER ORGANIZATIONS
           5.11.2 CODES AND REGULATIONS RELATED TO AMERICAS CABLES
                    TABLE 14 MARKET: CODES AND REGULATIONS
    5.12 TARIFF ANALYSIS 
           5.12.1 COUNTRY-WISE IMPORT TARIFFS FOR HS CODE 8544-COMPLIANT PRODUCTS
                    TABLE 15 IMPORT TARIFFS FOR HS 8544-COMPLIANT PRODUCTS, 2023
    5.13 PORTER’S FIVE FORCES ANALYSIS 
                    FIGURE 39 MARKET: PORTER’S FIVE FORCES ANALYSIS
                    TABLE 16 MARKET: PORTER’S FIVE FORCES ANALYSIS
           5.13.1 THREAT OF NEW ENTRANTS
           5.13.2 BARGAINING POWER OF SUPPLIERS
           5.13.3 BARGAINING POWER OF BUYERS
           5.13.4 THREAT OF SUBSTITUTES
           5.13.5 INTENSITY OF COMPETITIVE RIVALRY
    5.14 CASE STUDY ANALYSIS 
           5.14.1 BRUGG CABLES PROVIDED CABLES AND ACCESSORIES FOR POWER SUPPLY PROJECTS DURING BEIJING OLYMPIC GAMES IN CHINA
           5.14.2 US DEPARTMENT OF ENERGY INVESTED IN GRID MODERNIZATION TECHNOLOGIES TO SAFEGUARD ENERGY INFRASTRUCTURE
           5.14.3 NORTH SEA LINK CONNECTED ELECTRICITY GRIDS OF NORWAY AND UNITED KINGDOM VIA SUBSEA POWER CABLE
    5.15 KEY STAKEHOLDERS AND BUYING CRITERIA 
           5.15.1 KEY STAKEHOLDERS IN BUYING PROCESS
                    FIGURE 40 INFLUENCE OF KEY STAKEHOLDERS ON BUYING PROCESS FOR END USERS
                    TABLE 17 INFLUENCE OF KEY STAKEHOLDERS ON BUYING PROCESS FOR END USERS
           5.15.2 BUYING CRITERIA
                    FIGURE 41 KEY BUYING CRITERIA FOR END USERS
                    TABLE 18 KEY BUYING CRITERIA FOR TOP END USERS
    5.16 KEY CONFERENCES AND EVENTS, 2024 
                    TABLE 19 MARKET: LIST OF KEY CONFERENCES AND EVENTS, 2024
 
6 AMERICAS CABLES MARKET, BY POLYMER AND INSULATION TYPE (Page No. - 92)
    6.1 INTRODUCTION 
           FIGURE 42 MARKET, BY POLYMER AND INSULATION TYPE, 2023
           TABLE 20 MARKET, BY POLYMER AND INSULATION TYPE,  2022–2029 (USD MILLION)
           TABLE 21 POLYMER AND INSULATION TYPE: MARKET, BY SEMI-CONDUCTING POLYMER CABLE TYPE, 2022–2029 (USD MILLION)
           TABLE 22 MARKET, BY POLYMER AND INSULATION TYPE,  2022–2029 (THOUSAND TONNES)
           TABLE 23 POLYMER AND INSULATION TYPE: MARKET, BY SEMI-CONDUCTING POLYMER CABLE TYPE, 2022–2029 (THOUSAND TONNES)
    6.2 SEMI-CONDUCTING POLYMER CABLES 
           6.2.1 PRESSING NEED FOR RELIABLE AND STABLE OPERATION OF SMART GRID INFRASTRUCTURE TO FOSTER MARKET GROWTH
                    TABLE 24 SEMI-CONDUCTING POLYMER CABLES: MARKET, BY REGION,  2022–2029 (USD MILLION)
                    TABLE 25 SEMI-CONDUCTING POLYMER CABLES: MARKET, BY REGION,  2022–2029 (THOUSAND TONNES)
    6.3 XLPE CABLES 
           6.3.1 EXCEPTIONAL ELECTRICAL PERFORMANCE AND HIGH THERMAL STABILITY FEATURES TO BOOST SEGMENTAL GROWTH
                    TABLE 26 XLPE CABLES: MARKET, BY REGION, 2022–2029 (USD MILLION)
                    TABLE 27 XLPE CABLES: MARKET, BY REGION, 2022–2029  (THOUSAND TONNES)
    6.4 EPR/EPDM CABLES 
           6.4.1 HIGH THERMAL ELECTRICITY AND ABILITY TO WITHSTAND CHEMICAL ATTACKS WITHOUT DEGRADATION TO DRIVE MARKET
                    TABLE 28 EPR/EPDM CABLES: MARKET, BY REGION,  2022–2029 (USD MILLION)
                    TABLE 29 EPR/EPDM CABLES: MARKET, BY REGION,  2022–2029 (THOUSAND TONNES)
    6.5 HEPR CABLES 
           6.5.1 OIL & GAS AND PETROCHEMICALS INDUSTRIES TO CONTRIBUTE TO SEGMENTAL GROWTH
                    TABLE 30 HEPR CABLES: MARKET, BY REGION, 2022–2029 (USD MILLION)
                    TABLE 31 HEPR CABLES: MARKET, BY REGION,  2022–2029 (THOUSAND TONNES)
    6.6 LOW-VOLTAGE CABLES 
           6.6.1 GROWING ADOPTION OF AUTOMATION SOLUTIONS IN INDUSTRIAL FACILITIES TO BOOST DEMAND
                    TABLE 32 LOW-VOLTAGE CABLES: MARKET, BY REGION,  2022–2029 (USD MILLION)
                    TABLE 33 LOW-VOLTAGE CABLES: MARKET, BY REGION,  2022–2029 (THOUSAND TONNES)
 
7 AMERICAS CABLES MARKET, BY SEMI-CONDUCTING LAYER (Page No. - 101)
    7.1 INTRODUCTION 
           FIGURE 43 MARKET, BY SEMI-CONDUCTING LAYER, 2023
           TABLE 34 MARKET, BY SEMI-CONDUCTING LAYER, 2022–2029 (USD MILLION)
    7.2 INNER 
           7.2.1 RAPID INDUSTRIALIZATION AND URBANIZATION TO CREATE GROWTH OPPORTUNITIES
                    TABLE 35 INNER: MARKET, BY REGION, 2022–2029 (USD MILLION)
    7.3 OUTER 
           7.3.1 SIGNIFICANT INVESTMENT IN EXPANSION AND MODERNIZATION OF TRANSMISSION INFRASTRUCTURE TO DRIVE MARKET
                    TABLE 36 OUTER: MARKET, BY REGION, 2022–2029 (USD MILLION)
 
8 AMERICAS CABLES MARKET, BY VOLTAGE RATING (Page No. - 105)
    8.1 INTRODUCTION 
           FIGURE 44 MARKET, BY VOLTAGE RATING, 2023
           TABLE 37 MARKET, BY VOLTAGE RATING, 2022–2029 (USD MILLION)
    8.2 UP TO 5 KV 
           8.2.1 RISING USE IN INDUSTRIAL AND COMMERCIAL POWER DISTRIBUTION INFRASTRUCTURE TO DRIVE MARKET
                    TABLE 38 UP TO 5 KV: MARKET, BY REGION, 2022–2029 (USD MILLION)
    8.3 5–8 KV 
           8.3.1 INCREASING INVESTMENT IN RENEWABLE ENERGY PROJECTS AND MODERNIZATION OF ELECTRICAL INFRASTRUCTURE TO SUPPORT MARKET GROWTH
                    TABLE 39 5–8 KV: MARKET, BY REGION, 2022–2029 (USD MILLION)
    8.4 8–15 KV 
           8.4.1 GROWING INCLINATION TOWARD CLEAN ENERGY TO CONTRIBUTE TO MARKET GROWTH
                    TABLE 40 8–15 KV: MARKET, BY REGION, 2022–2029 (USD MILLION)
    8.5 15–35 KV 
           8.5.1 PRESSING NEED FOR RELIABLE AND EFFICIENT POWER TRANSMISSION TO FUEL SEGMENTAL GROWTH
                    TABLE 41 15–35 KV: MARKET, BY REGION, 2022–2029 (USD MILLION)
    8.6 35–46 KV 
           8.6.1 STRONG FOCUS OF CABLE MANUFACTURERS ON MEETING STRINGENT PERFORMANCE AND DURABILITY REQUIREMENTS TO BOOST DEMAND
                    TABLE 42 35–46 KV: MARKET, BY REGION, 2022–2029 (USD MILLION)
    8.7 69 KV 
           8.7.1 INDUSTRIAL DIGITALIZATION TO FOSTER DEMAND FOR MEDIUM-VOLTAGE CABLES
                    TABLE 43 69 KV: MARKET, BY REGION, 2022–2029 (USD MILLION)
    8.8 115 KV 
           8.8.1 GROWING DEMAND FOR CLEANER ENERGY AND IMPERATIVE TO MODERNIZE AGING INFRASTRUCTURE TO DRIVE MARKET
                    TABLE 44 115 KV: MARKET, BY REGION, 2022–2029 (USD MILLION)
    8.9 138 KV 
           8.9.1 SURGING NEED FOR ROBUST AND RELIABLE POWER TRANSMISSION SYSTEM TO ACCELERATE ADOPTION OF HIGH-VOLTAGE CABLES
                    TABLE 45 138 KV: MARKET, BY REGION, 2022–2029 (USD MILLION)
 
9 AMERICAS CABLES MARKET, BY APPLICATION (Page No. - 113)
    9.1 INTRODUCTION 
           FIGURE 45 MARKET, BY APPLICATION, 2023
           TABLE 46 MARKET, BY APPLICATION, 2022–2029 (USD MILLION)
    9.2 UNDERGROUND 
           9.2.1 LOW TRANSMISSION LOSSES AND MAINTENANCE COST TO BOOST DEMAND
                    TABLE 47 UNDERGROUND: MARKET, BY REGION, 2022–2029 (USD MILLION)
    9.3 SUBMARINE 
           9.3.1 BOOMING OFFSHORE WIND INDUSTRY IN US TO FUEL SEGMENTAL GROWTH
                    TABLE 48 SUBMARINE: MARKET, BY REGION, 2022–2029 (USD MILLION)
 
10 AMERICAS CABLES MARKET, BY END USER (Page No. - 116)
     10.1 INTRODUCTION 
               FIGURE 46 AMERICAS CABLES MARKET, BY END USER, 2023
               TABLE 49 MARKET, BY END USER, 2022–2029 (USD MILLION)
     10.2 INDUSTRIAL SECTOR 
               FIGURE 47 UTILITIES SEGMENT HELD LARGEST SHARE OF AMERICAS CABLES MARKET FOR INDUSTRIAL SECTOR IN 2023
               TABLE 50 MARKET, BY INDUSTRIAL SECTOR END USER,  2022–2029 (USD MILLION)
               TABLE 51 INDUSTRIAL SECTOR: MARKET, BY REGION,  2022–2029 (USD MILLION)
             10.2.1 UTILITIES
                       10.2.1.1 Increasing investment in grid modernization to drive market
                                   TABLE 52 UTILITIES: MARKET, BY REGION, 2022–2029 (USD MILLION)
             10.2.2 OIL & GAS
                       10.2.2.1 Rising focus on refinery capacity expansion to fuel market growth
                                   TABLE 53 OILS & GAS: MARKET, BY REGION, 2022–2029 (USD MILLION)
             10.2.3 CHEMICALS & PETROCHEMICALS
                       10.2.3.1 Exposure to corrosive chemicals, high temperatures, moisture, abrasion, and mechanical stress to boost requirement for specialized cables
                                   TABLE 54 CHEMICALS & PETROCHEMICALS: MARKET, BY REGION,  2022–2029 (USD MILLION)
             10.2.4 METALS & MINING
                       10.2.4.1 Research and innovations related to development of high-strength and high-conductivity alloys to foster market growth
                                   TABLE 55 METALS & MINING: MARKET, BY REGION, 2022–2029 (USD MILLION)
             10.2.5 MANUFACTURING
                       10.2.5.1 Growing focus on building smart factories to accelerate need for XLPE and PVC cables
                                   TABLE 56 MANUFACTURING: MARKET, BY REGION, 2022–2029 (USD MILLION)
             10.2.6 CEMENT
                       10.2.6.1 Rapid urbanization and industrialization to accelerate market growth
                                   TABLE 57 CEMENT: MARKET, BY REGION, 2022–2029 (USD MILLION)
             10.2.7 OTHER INDUSTRIAL END USERS
                       TABLE 58 OTHER INDUSTRIAL END USERS: MARKET, BY REGION,  2022–2029 (USD MILLION)
     10.3 RENEWABLE ENERGY SECTOR 
               FIGURE 48 MARKET, BY RENEWABLE ENERGY SECTOR END USER, 2023
               TABLE 59 MARKET, BY RENEWABLE ENERGY SECTOR END USER,  2022–2029 (USD MILLION)
               TABLE 60 RENEWABLE ENERGY SECTOR: MARKET, BY REGION,  2022–2029 (USD MILLION)
             10.3.1 SOLAR PLANTS
                       10.3.1.1 Transition toward robust and sustainable energy future to drive market
                                   TABLE 61 SOLAR PLANTS: MARKET, BY REGION, 2022–2029 (USD MILLION)
             10.3.2 WIND FARMS
                       10.3.2.1 Ongoing large-scale offshore wind projects to boost demand
                                   TABLE 62 WIND FARMS: MARKET, BY REGION, 2022–2029 (USD MILLION)
     10.4 COMMERCIAL SECTOR 
             10.4.1 ELECTRIFICATION AND INFRASTRUCTURE MODIFICATION IN RAILWAY INDUSTRY TO PROPEL MARKET
                       TABLE 63 COMMERCIAL SECTOR: MARKET, BY REGION,  2022–2029 (USD MILLION)
 
11 AMERICAS CABLES MARKET, BY REGION (Page No. - 127)
     11.1 INTRODUCTION 
               FIGURE 49 AMERICAS CABLES MARKET, BY REGION, 2023 (%)
               FIGURE 50 NORTH AMERICA TO BE FASTEST-GROWING REGION IN AMERICAS CABLES MARKET DURING FORECAST PERIOD
               TABLE 64 MARKET, BY REGION, 2022–2029 (USD MILLION)
               TABLE 65 MARKET, BY POLYMER AND INSULATION TYPE,  2022–2029 (USD MILLION)
               TABLE 66 MARKET, BY SEMI-CONDUCTING POLYMER CABLE TYPE,  2022–2029 (USD MILLION)
               TABLE 67 MARKET, BY SEMI-CONDUCTING LAYER, 2022–2029 (USD MILLION)
               TABLE 68 MARKET, BY CABLE TYPE, 2022–2029 (THOUSAND TONNES)
               TABLE 69 MARKET, BY SEMI-CONDUCTING POLYMER CABLE TYPE,  2022–2029 (THOUSAND TONNES)
               TABLE 70 MARKET, BY APPLICATION, 2022–2029 (USD MILLION)
               TABLE 71 MARKET, BY VOLTAGE RATING, 2022–2029 (USD MILLION)
               TABLE 72 MARKET, BY END USER, 2022–2029 (USD MILLION)
               TABLE 73 MARKET, BY INDUSTRIAL SECTOR END USER,  2022–2029 (USD MILLION)
               TABLE 74 MARKET, BY RENEWABLE ENERGY SECTOR END USER,  2022–2029 (USD MILLION)
     11.2 NORTH AMERICA 
               FIGURE 51 NORTH AMERICA: MARKET SNAPSHOT
     11.3 RECESSION IMPACT: NORTH AMERICA 
               TABLE 75 NORTH AMERICAN CABLES MARKET, BY POLYMER AND INSULATION TYPE,  2022–2029 (USD MILLION)
               TABLE 76 POLYMER AND INSULATION TYPE: NORTH AMERICAN CABLES MARKET, BY SEMI-CONDUCTING POLYMER CABLE TYPE, 2022–2029 (USD MILLION)
               TABLE 77 NORTH AMERICAN CABLES MARKET, BY POLYMER AND INSULATION TYPE,  2022–2029 (THOUSAND TONNES)
               TABLE 78 POLYMER AND INSULATION TYPE: NORTH AMERICAN CABLES MARKET, BY SEMI-CONDUCTING POLYMER CABLE TYPE, 2022–2029 (THOUSAND TONNES)
               TABLE 79 NORTH AMERICAN CABLES MARKET, BY SEMI-CONDUCTING LAYER,  2022–2029 (USD MILLION)
               TABLE 80 NORTH AMERICAN CABLES MARKET, BY APPLICATION, 2022–2029 (USD MILLION)
               TABLE 81 NORTH AMERICAN CABLES MARKET, BY VOLTAGE RATING, 2022–2029 (USD MILLION)
               TABLE 82 NORTH AMERICAN CABLES MARKET, BY END USER 2022–2029 (USD MILLION)
               TABLE 83 NORTH AMERICAN CABLES MARKET, BY INDUSTRIAL SECTOR END USER,  2022–2029 (USD MILLION)
               TABLE 84 NORTH AMERICAN CABLES MARKET, BY RENEWABLE ENERGY SECTOR END USER,  2022–2029 (USD MILLION)
               TABLE 85 NORTH AMERICAN CABLES MARKET, BY COUNTRY, 2022–2029 (USD MILLION)
     11.4 US 
             11.4.1 EXPANSION OF OFFSHORE WIND FARMS TO DRIVE MARKET
                       TABLE 86 NORTH AMERICAN CABLES MARKET IN US, BY END USER, 2022–2029 (USD MILLION)
                       TABLE 87 NORTH AMERICAN CABLES MARKET IN US, BY INDUSTRIAL SECTOR END USER,  2022–2029 (USD MILLION)
                       TABLE 88 NORTH AMERICAN CABLES MARKET IN US, BY RENEWABLE ENERGY SECTOR END USER,  2022–2029 (USD MILLION)
     11.5 CANADA 
             11.5.1 GROWING EMPHASIS ON GRID MODERNIZATION AND RENEWABLE ENERGY INTEGRATION TO FOSTER MARKET GROWTH
                       TABLE 89 NORTH AMERICAN CABLES MARKET IN CANADA, BY END USER,  2022–2029 (USD MILLION)
                       TABLE 90 NORTH AMERICAN CABLES MARKET IN CANADA, BY INDUSTRIAL SECTOR END USER,  2022–2029 (USD MILLION)
                       TABLE 91 NORTH AMERICAN CABLES MARKET IN CANADA, BY RENEWABLE ENERGY SECTOR END USER, 2022–2029 (USD MILLION)
     11.6 MEXICO 
             11.6.1 EXPANSION OF DATA CENTER FACILITIES TO FUEL MARKET GROWTH
                       TABLE 92 NORTH AMERICAN CABLES MARKET IN MEXICO, BY END USER,  2022–2029 (USD MILLION)
                       TABLE 93 NORTH AMERICAN CABLES MARKET IN MEXICO, BY INDUSTRIAL SECTOR END USER,  2022–2029 (USD MILLION)
                       TABLE 94 NORTH AMERICAN CABLES MARKET IN MEXICO, BY RENEWABLE ENERGY SECTOR END USER, 2022–2029 (USD MILLION)
     11.7 CENTRAL AMERICA 
     11.8 RECESSION IMPACT: CENTRAL AMERICA 
               TABLE 95 CENTRAL AMERICAN CABLES MARKET, BY SEMI-CONDUCTING LAYER,  2022–2029 (USD MILLION)
               TABLE 96 CENTRAL AMERICAN CABLES MARKET, BY APPLICATION, 2022–2029 (USD MILLION)
               TABLE 97 CENTRAL AMERICAN CABLES MARKET, BY VOLTAGE RATING, 2022–2029 (USD MILLION)
               TABLE 98 CENTRAL AMERICAN CABLES MARKET, BY END USER,  2022–2029 (USD MILLION)
               TABLE 99 CENTRAL AMERICAN CABLES MARKET, BY INDUSTRIAL SECTOR END USER,  2022–2029 (USD MILLION)
               TABLE 100 CENTRAL AMERICAN CABLES MARKET, BY RENEWABLE ENERGY SECTOR END USER, 2022–2029 (USD MILLION)
               TABLE 101 CENTRAL AMERICAN CABLES MARKET, BY POLYMER AND INSULATING TYPE, 2022–2029 (USD MILLION)
               TABLE 102 CENTRAL AMERICAN CABLES MARKET, BY SEMI-CONDUCTING POLYMER CABLE TYPE, 2022–2029 (USD MILLION)
               TABLE 103 CENTRAL AMERICAN CABLES MARKET, BY POLYMER AND INSULATING TYPE, 2022–2029 (THOUSAND TONNES)
               TABLE 104 CENTRAL AMERICAN CABLES MARKET, BY SEMI-CONDUCTING POLYMER CABLE TYPE, 2022–2029 (THOUSAND TONNES)
               TABLE 105 CENTRAL AMERICAN CABLES MARKET, BY COUNTRY,  2022–2029 (USD MILLION)
     11.9 GUATEMALA 
             11.9.1 INVESTMENTS IN RENEWABLE ENERGY PROJECTS TO FUEL MARKET GROWTH
                       TABLE 106 CENTRAL AMERICAN CABLES MARKET IN GUATEMALA, BY END USER,  2022–2029 (USD MILLION)
                       TABLE 107 CENTRAL AMERICAN CABLES MARKET IN GUATEMALA, BY INDUSTRIAL  SECTOR END USER, 2022–2029 (USD MILLION)
                       TABLE 108 CENTRAL AMERICAN CABLES MARKET IN GUATEMALA, BY RENEWABLE ENERGY SECTOR END USER, 2022–2029 (USD MILLION)
     11.10 PANAMA 
               11.10.1 STRONG FOCUS ON ENHANCING POWER INFRASTRUCTURE TO BOOST DEMAND
                                   TABLE 109 CENTRAL AMERICAN CABLES MARKET IN PANAMA, BY END USER,  2022–2029 (USD MILLION)
                                   TABLE 110 CENTRAL AMERICAN CABLES MARKET IN PANAMA, BY INDUSTRIAL SECTOR END USER,  2022–2029 (USD MILLION)
                                   TABLE 111 CENTRAL AMERICAN CABLES MARKET IN PANAMA, BY RENEWABLE ENERGY SECTOR END USER, 2022–2029 (USD MILLION)
     11.11 COSTA RICA 
               11.11.1 AMBITIOUS RENEWABLE ENERGY TARGETS AND COMMITMENT TO REDUCE CARBON EMISSIONS TO SUPPORT MARKET GROWTH
                                   TABLE 112 CENTRAL AMERICAN CABLES MARKET IN COSTA RICA, BY END USER,  2022–2029 (USD MILLION)
                                   TABLE 113 CENTRAL AMERICAN CABLES MARKET IN COSTA RICA, BY INDUSTRIAL  SECTOR END USER, 2022–2029 (USD MILLION)
                                   TABLE 114 CENTRAL AMERICAN CABLES MARKET IN COSTA RICA, BY RENEWABLE ENERGY SECTOR END USER, 2022–2029 (USD MILLION)
     11.12 SOUTH AMERICA 
     11.13 RECESSION IMPACT: SOUTH AMERICA 
                       TABLE 115 SOUTH AMERICAN CABLES MARKET, BY POLYMER AND INSULATION TYPE,  2022–2029 (USD MILLION)
                       TABLE 116 SOUTH AMERICAN CABLES MARKET, BY SEMI-CONDUCTING POLYMER CABLE TYPE, 2022–2029 (USD MILLION)
                       TABLE 117 SOUTH AMERICAN CABLES MARKET, BY POLYMER AND INSULATION TYPE,  2022–2029 (THOUSAND TONNES)
                       TABLE 118 SOUTH AMERICAN CABLES MARKET, BY SEMI-CONDUCTING POLYMER CABLE TYPE, 2022–2029 (THOUSAND TONNES)
                       TABLE 119 SOUTH AMERICAN CABLES MARKET, BY SEMI-CONDUCTING LAYER,  2022–2029 (USD MILLION)
                       TABLE 120 SOUTH AMERICAN CABLES MARKET, BY APPLICATION, 2022–2029 (USD MILLION)
                       TABLE 121 SOUTH AMERICAN CABLES MARKET, BY VOLTAGE RATING, 2022–2029 (USD MILLION)
                       TABLE 122 SOUTH AMERICAN CABLES MARKET, BY END USER, 2022–2029 (USD MILLION)
                       TABLE 123 SOUTH AMERICAN CABLES MARKET, BY INDUSTRIAL SECTOR END USER,  2022–2029 (USD MILLION)
                       TABLE 124 SOUTH AMERICAN CABLES MARKET, BY RENEWABLE ENERGY SECTOR END USER,  2022–2029 (USD MILLION)
                       TABLE 125 SOUTH AMERICAN CABLES MARKET, BY COUNTRY, 2022–2029 (USD MILLION)
     11.14 BRAZIL 
               11.14.1 RENEWABLE ENERGY INTEGRATION AND OFFSHORE WIND PROJECTS TO FUEL MARKET GROWTH
                                   TABLE 126 SOUTH AMERICAN CABLES MARKET IN BRAZIL, BY END USER,  2022–2029 (USD MILLION)
                                   TABLE 127 SOUTH AMERICAN CABLES MARKET IN BRAZIL, BY INDUSTRIAL SECTOR END USER,  2022–2029 (USD MILLION)
                                   TABLE 128 SOUTH AMERICAN CABLES MARKET IN BRAZIL, BY RENEWABLE ENERGY SECTOR  END USER, 2022–2029 (USD MILLION)
     11.15 ARGENTINA 
               11.15.1 POTENTIAL FOR OFFSHORE WIND ENERGY DEVELOPMENT TO STIMULATE MARKET GROWTH
                                   TABLE 129 SOUTH AMERICAN CABLES MARKET IN ARGENTINA, BY END USER,  2022–2029 (USD MILLION)
                                   TABLE 130 SOUTH AMERICAN CABLES MARKET IN ARGENTINA, BY INDUSTRIAL SECTOR END USER,  2022–2029 (USD MILLION)
                                   TABLE 131 SOUTH AMERICAN CABLES MARKET IN ARGENTINA, BY RENEWABLE ENERGY SECTOR END USER, 2022–2029 (USD MILLION)
     11.16 VENEZUELA 
               11.16.1 INITIATION OF OIL AND GAS PROJECTS TO SUPPORT MARKET GROWTH
                                   TABLE 132 SOUTH AMERICAN CABLES MARKET IN VENEZUELA, BY END USER,  2022–2029 (USD MILLION)
                                   TABLE 133 SOUTH AMERICAN CABLES MARKET IN VENEZUELA, BY INDUSTRIAL SECTOR END USER,  2022–2029 (USD MILLION)
                                   TABLE 134 SOUTH AMERICAN CABLES MARKET IN VENEZUELA, BY RENEWABLE ENERGY SECTOR END USER, 2022–2029 (USD MILLION)
     11.17 REST OF SOUTH AMERICA 
                       TABLE 135 SOUTH AMERICAN CABLES MARKET IN REST OF SOUTH AMERICA, BY END USER,  2022–2029 (USD MILLION)
                       TABLE 136 SOUTH AMERICAN CABLES MARKET IN REST OF SOUTH AMERICA, BY INDUSTRIAL SECTOR END USER, 2022–2029 (USD MILLION)
                       TABLE 137 SOUTH AMERICAN CABLES MARKET IN REST OF SOUTH AMERICA, BY RENEWABLE ENERGY SECTOR END USER, 2022–2029 (USD MILLION)
 
12 COMPETITIVE LANDSCAPE (Page No. - 159)
     12.1 STRATEGIES ADOPTED BY KEY PLAYERS 
               TABLE 138 OVERVIEW OF KEY STRATEGIES ADOPTED BY TOP PLAYERS, 2018–2023
     12.2 MARKET SHARE ANALYSIS OF TOP 5 PLAYERS, 2023 
               TABLE 139 MARKET: DEGREE OF COMPETITION, 2023
               FIGURE 52 MARKET SHARE ANALYSIS, 2023
     12.3 REVENUE ANALYSIS OF TOP 5 PLAYERS IN MARKET, 2018 TO 2022 
               FIGURE 53 FIVE-YEAR REVENUE ANALYSIS OF TOP 4 PLAYERS IN MARKET, 2018–2022
     12.4 COMPANY EVALUATION MATRIX, KEY PLAYERS, 2023 
             12.4.1 STARS
             12.4.2 PERVASIVE PLAYERS
             12.4.3 EMERGING LEADERS
             12.4.4 PARTICIPANTS
             12.4.5 COMPANY FOOTPRINT: KEY PLAYERS
                       12.4.5.1 Polymer and insulation type footprint
                                   TABLE 140 COMPANY FOOTPRINT: BY POLYMER AND INSULATION TYPE
                       12.4.5.2 End user footprint
                                   TABLE 141 COMPANY FOOTPRINT: BY END USER
                       12.4.5.3 Voltage rating footprint
                                   TABLE 142 COMPANY FOOTPRINT: BY VOLTAGE RATING
                       12.4.5.4 Region footprint
                                   TABLE 143 COMPANY FOOTPRINT: BY REGION
                       12.4.5.5 Competitive benchmarking of key startups/smes, 2023
                                   TABLE 144 MARKET: COMPETITIVE BENCHMARKING OF KEY STARTUPS/SMES
                                   FIGURE 54 MARKET: COMPANY FOOTPRINT
                                   FIGURE 55 MARKET: COMPANY EVALUATION MATRIX  (KEY PLAYERS), 2023
     12.5 COMPANY EVALUATION MATRIX: STARTUPS/SMES, 2023 
             12.5.1 PROGRESSIVE COMPANIES
             12.5.2 RESPONSIVE COMPANIES
             12.5.3 DYNAMIC COMPANIES
             12.5.4 STARTING BLOCKS
                       FIGURE 56 MARKET: COMPANY EVALUATION MATRIX (STARTUPS/SMES), 2023
             12.5.5 COMPETITIVE BENCHMARKING, STARTUPS/SMES, 2023
                       12.5.5.1 List of startups/SMES
                                   TABLE 145 MARKET: KEY STARTUP/SMES
     12.6 COMPANY VALUATION AND FINANCIAL METRICS FOR  MAJOR CABLES VENDORS IN AMERICAS 
               FIGURE 57 EV/EBITDA OF KEY VENDORS
               FIGURE 58 COMPANY VALUATION OF KEY VENDORS
     12.7 BRAND/PRODUCT COMPARATIVE ANALYSIS 
               FIGURE 59 MARKET: TOP TRENDING BRANDS/PRODUCTS
     12.8 COMPETITIVE SCENARIO AND TRENDS 
             12.8.1 DEALS
                       TABLE 146 MARKET: DEALS, JANUARY 2018–DECEMBER 2023
                                   12.8.1.1.1 Expansions
                                   TABLE 147 AMERICAS CABLES: EXPANSIONS, JANUARY 2018–DECEMBER 2023
                                   12.8.1.1.2 Others
                                   TABLE 148 MARKET: OTHERS, JANUARY 2018–DECEMBER 2023
 
13 COMPANY PROFILES (Page No. - 186)
(Business overview, Products offered, Recent Developments, MNM view)*
     13.1 KEY PLAYERS 
             13.1.1 PRYSMIAN GROUP
                       TABLE 149 PRYSMIAN GROUP: COMPANY OVERVIEW
                       FIGURE 60 PRYSMIAN GROUP: COMPANY SNAPSHOT
                       TABLE 150 PRYSMIAN GROUP: PRODUCTS OFFERED
                       TABLE 151 PRYSMIAN GROUP: DEALS
                       TABLE 152 PRYSMIAN GROUP: OTHERS
             13.1.2 SOUTHWIRE COMPANY, LLC
                       TABLE 153 SOUTHWIRE COMPANY, LLC: COMPANY OVERVIEW
                       TABLE 154 SOUTHWIRE COMPANY, LLC: PRODUCTS OFFERED
                       TABLE 155 SOUTHWIRE COMPANY, LLC: DEALS
                       TABLE 156 SOUTHWIRE COMPANY: EXPANSIONS
                       TABLE 157 SOUTHWIRE COMPANY: OTHERS
             13.1.3 NEXANS
                       TABLE 158 NEXANS: COMPANY OVERVIEW
                       FIGURE 61 NEXANS: COMPANY SNAPSHOT
                       TABLE 159 NEXANS: PRODUCTS OFFERED
                       TABLE 160 NEXANS: DEALS
                       TABLE 161 NEXANS: EXPANSIONS
                       TABLE 162 NEXANS: OTHERS
             13.1.4 LS CABLE & SYSTEM LTD.
                       TABLE 163 LS CABLE & SYSTEM LTD.: COMPANY OVERVIEW
                       FIGURE 62 LS CABLE & SYSTEM LTD.: COMPANY SNAPSHOT
                       TABLE 164 LS CABLE & SYSTEM LTD.: PRODUCTS OFFERED
                       TABLE 165 LS CABLE & SYSTEM LTD.: PRODUCT LAUNCHES
                       TABLE 166 LS CABLE & SYSTEM LTD.: DEALS
                       TABLE 167 LS CABLE & SYSTEM LTD.: EXPANSIONS
             13.1.5 NKT A/S
                       TABLE 168 NKT A/S: COMPANY OVERVIEW
                       FIGURE 63 NKT A/S: COMPANY SNAPSHOT
                       TABLE 169 NKT A/S: PRODUCTS OFFERED
                       TABLE 170 NKT A/S: DEALS
                       TABLE 171 NKT A/S: EXPANSIONS
                       TABLE 172 NKT A/S: OTHERS
             13.1.6 AMPHENOL TPC
                       TABLE 173 AMPHENOL TPC: COMPANY OVERVIEW
                       TABLE 174 AMPHENOL TPC: PRODUCTS OFFERED
                       TABLE 175 AMPHENOL TPC: PRODUCT LAUNCHES
                       TABLE 176 AMPHENOL TPC: DEALS
             13.1.7 BELDEN INC.
                       TABLE 177 BELDEN INC.: COMPANY OVERVIEW
                       FIGURE 64 BELDEN INC.: COMPANY SNAPSHOT
                       TABLE 178 BELDEN INC.: PRODUCTS OFFERED
                       TABLE 179 BELDEN INC.: PRODUCT LAUNCHES
                       TABLE 180 BELDEN INC.: DEALS
             13.1.8 LEONI
                       TABLE 181 LEONI: COMPANY OVERVIEW
                       FIGURE 65 LEONI: COMPANY SNAPSHOT
                       TABLE 182 LEONI: PRODUCTS OFFERED
                       TABLE 183 LEONI: OTHERS
             13.1.9 BIZLINK GROUP
                       TABLE 184 BIZLINK GROUP: COMPANY OVERVIEW
                       FIGURE 66 BIZLINK GROUP: COMPANY SNAPSHOT
                       TABLE 185 BIZLINK GROUP: PRODUCTS OFFERED
                       TABLE 186 BIZLINK GROUP: DEALS
             13.1.10 SUMITOMO ELECTRIC INDUSTRIES, LTD.
                                   TABLE 187 SUMITOMO ELECTRIC INDUSTRIES, LTD.: COMPANY OVERVIEW
                                   FIGURE 67 SUMITOMO ELECTRIC INDUSTRIES, LTD.: COMPANY SNAPSHOT
                                   TABLE 188 SUMITOMO ELECTRIC INDUSTRIES, LTD.: PRODUCTS OFFERED
                                   TABLE 189 SUMITOMO ELECTRIC INDUSTRIES, LTD.: OTHERS
             13.1.11 THE OKONITE COMPANY
                                   TABLE 190 THE OKONITE COMPANY: COMPANY OVERVIEW
                                   TABLE 191 THE OKONITE COMPANY: PRODUCTS OFFERED
             13.1.12 TFKABLE
                                   TABLE 192 TFKABLE: COMPANY OVERVIEW
                                   TABLE 193 TFKABLE: PRODUCTS OFFERED
             13.1.13 TRATOS
                                   TABLE 194 TRATOS: COMPANY OVERVIEW
                                   TABLE 195 TRATOS: PRODUCTS OFFERED
             13.1.14 ZTT
                                   TABLE 196 ZTT: COMPANY OVERVIEW
                                   FIGURE 68 ZTT: COMPANY SNAPSHOT
                                   TABLE 197 ZTT: PRODUCTS OFFERED
             13.1.15 HELUKABEL GROUP
                                   TABLE 198 HELUKABEL GROUP: COMPANY OVERVIEW
                                   TABLE 199 HELUKABEL GROUP: PRODUCTS OFFERED
     13.2 OTHER PLAYERS (INSULATION PRODUCT AND SERVICE PROVIDERS) 
             13.2.1 DOW
                       TABLE 200 DOW: COMPANY OVERVIEW
                       FIGURE 69 DOW: COMPANY SNAPSHOT
                       TABLE 201 DOW: PRODUCTS OFFERED
             13.2.2 FURUKAWA ELECTRIC CO., LTD.
                       TABLE 202 FURUKAWA ELECTRIC CO., LTD.: COMPANY OVERVIEW
                       FIGURE 70 FURUKAWA ELECTRIC CO., LTD.: COMPANY SNAPSHOT
                       TABLE 203 FURUKAWA ELECTRIC CO., LTD.: PRODUCTS OFFERED
                       TABLE 204 FURUKAWA ELECTRIC CO., LTD.: OTHERS
             13.2.3 ZHEJIANG WANMA CO., LTO.
                       TABLE 205 ZHEJIANG WANMA CO., LTO.: COMPANY OVERVIEW
                       TABLE 206 ZHEJIANG WANMA CO., LTO.: PRODUCTS OFFERED
             13.2.4 HANWHA GROUP
                       TABLE 207 HANWHA GROUP: COMPANY OVERVIEW
                       TABLE 208 HANWHA GROUP: PRODUCTS OFFERED
             13.2.5 TRELLEBORG GROUP
                       TABLE 209 TRELLEBORG GROUP: COMPANY OVERVIEW
                       FIGURE 71 TRELLEBORG GROUP: COMPANY SNAPSHOT
                       TABLE 210 TRELLEBORG GROUP: PRODUCTS OFFERED
             13.2.6 BOREALIS AG
                       TABLE 211 BOREALIS AG: COMPANY OVERVIEW
                       FIGURE 72 BOREALIS AG: COMPANY SNAPSHOT
                       TABLE 212 BOREALIS AG: PRODUCTS OFFERED
             13.2.7 AVIENT CORPORATION
                       TABLE 213 AVIENT CORPORATION: COMPANY OVERVIEW
                       FIGURE 73 AVIENT CORPORATION: COMPANY SNAPSHOT
                       TABLE 214 AVIENT CORPORATION: PRODUCTS OFFERED
             13.2.8 SACO AEI POLYMERS
             13.2.9 HJ POLYMER CHINA CO., LTD.
             13.2.10 WTEC ENERGY INNOVATION
             13.2.11 PRAMKOR
             13.2.12 ELECTRIC CABLE COMPOUNDS, INC.
             13.2.13 MIXER S.P.A.
*Details on Business overview, Products offered, Recent Developments, MNM view might not be captured in case of unlisted companies.
 
14 APPENDIX (Page No. - 272)
     14.1 INSIGHTS FROM INDUSTRY EXPERTS 
     14.2 DISCUSSION GUIDE 
     14.3 KNOWLEDGESTORE: MARKETSANDMARKETS’  SUBSCRIPTION PORTAL 
     14.4 CUSTOMIZATION OPTIONS 
     14.5 RELATED REPORTS 
     14.6 AUTHOR DETAILS 

The study involved major activities in estimating the current size of the Americas Cables market. Exhaustive secondary research was done to collect information on the peer and parent markets. The next step was to validate these findings, assumptions, and sizing with industry experts across the value chain through primary research. Both top-down and bottom-up approaches were employed to estimate the complete market size. Thereafter, market breakdown and data triangulation were used to estimate the market size of the segments and subsegments.

Secondary Research

This research study on the Americas Cables market involved the use of extensive secondary sources, directories, and databases, such as North American Submarine Cable Association (NASCA), California Cable & Telecommunications Association (CCTA), Wire & Cable Manufacturers’ Alliance, Inc. (WCMA), National Electrical Code (NEC), CEC Rule 12-604 and NR 10- Safety in electrical installations and services, to identify and collect information useful for a technical, market-oriented, and commercial study of the global Americas Cables market. The other secondary sources included annual reports, press releases & investor presentations of companies, white papers, certified publications, articles by recognized authors, manufacturer associations, trade directories, and databases.

Primary Research

The Americas Cables market comprises several stakeholders such as cables manufacturers, manufacturers of subcomponents of cables, distributors and suppliers, and end users. A combination of factors is driving the growth of the cable sector in America. Demand is driven by new building in the residential and commercial sectors, while aging infrastructure requires renovation. Transmission lines also need to be strengthened due to the increasing use of renewable energy sources like solar and wind. High-speed data cables supporting automation and smart manufacturing are in demand from industrial users. Subsea cables are essential for long-distance data transmission and offshore wind farms, while underground cables are usually employed for aesthetics and to prevent weather damage.
Americas Cables  Market Size, and Share

To know about the assumptions considered for the study, download the pdf brochure

Market Size Estimation

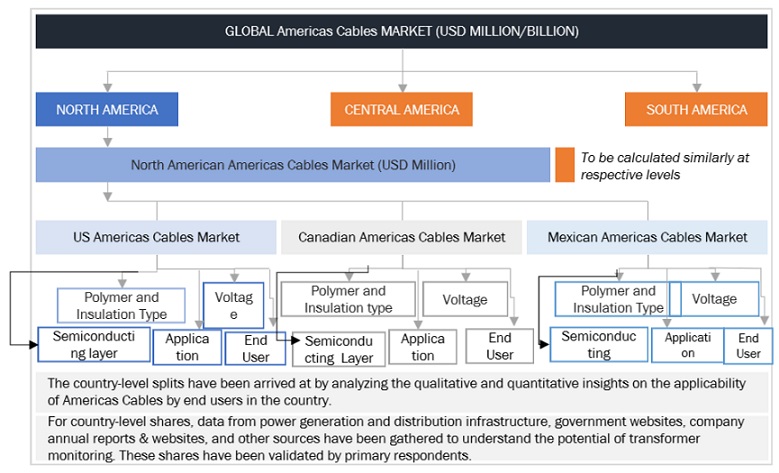
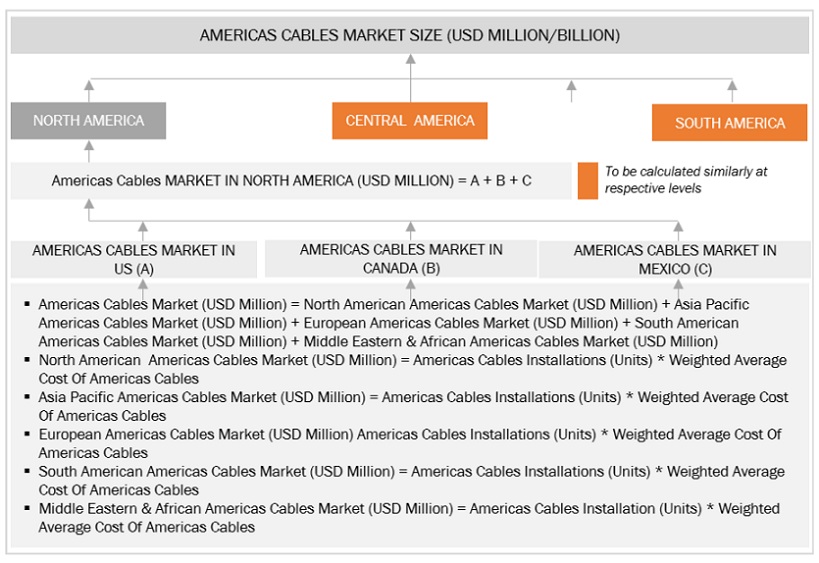
Both top-down and bottom-up approaches were used to estimate and validate the total size of the Americas Cables market. These methods were also used extensively to estimate the size of various subsegments in the market. The research methodology used to estimate the market size includes the following:

  • The key players in the industry and market have been identified through extensive secondary research, and their market share in the respective regions have been determined through both primary and secondary research.
  • The industry’s value chain and market size, in terms of value, have been determined through primary and secondary research processes.
  • All percentage shares, splits, and breakdowns have been determined using secondary sources and verified through primary sources.

Global Americas Cables Market Size: Top-down Approach
Americas Cables  Market Top Down Approach

To know about the assumptions considered for the study, Request for Free Sample Report

Global Americas Cables Market Size: Bottom-Up Approach
Americas Cables  Market Bottom Up Approach

Data Triangulation

After arriving at the overall market size from the estimation process explained above, the total market has been split into several segments and subsegments. To complete the overall market engineering process and arrive at the exact statistics for all the segments and subsegments, the data triangulation and market breakdown processes have been employed, wherever applicable. The data has been triangulated by studying various factors and trends from both the demand- and supply sides. Along with this, the market has been validated using both the top-down and bottom-up approaches.

Market Definition

An electrical cable with one or more conductors covered in layers of insulation and protection is called a power cable. It is used to transmit and distribute electrical power. Common insulation materials include ethylene propylene rubber (EPR) and its variant, high ethylene propylene rubber (HEPR), which are known for their flexibility and durability; cross-linked polyethylene (XLPE), which has high chemical and thermal stability; and ethylene propylene diene monomer (EPDM), which is prized for its electrical insulating qualities. To control electric fields inside the cable, semiconducting polymers are layered. These cables are used by a variety of end users, such as commercial infrastructures, industrial facilities, and the renewable energy industry for the transmission of wind and solar electricity. All of these end users require dependable and effective power distribution systems.

Key Stakeholders

  • Government & research organizations
  • Institutional investors and investment banks
  • Investors/shareholders
  • Environmental research institutes
  • Consulting companies in the energy & power sector
  • Raw materials and component manufacturers
  • Cable manufacturers, dealers, and suppliers
  • Petroleum companies (diesel and natural gas suppliers)
  • Power grid infrastructure companies
  • Power plant project developers
  • Renewable energy companies
  • Manufacturers’ associations
  • Process industries and power industry associations
  • Refinery operators
  • Manufacturing industry
  • Energy efficiency consultancies

Objectives of the Study

  • To define, describe, segment, and forecast the Americas Cables market, in terms of value and polymer and insulation type, semiconducting layer, voltage, application, end user, and region
  • To forecast the market size for three key regions: North America, South America, and Central America, along with their key countries
  • To provide detailed information about the key drivers, restraints, opportunities, and challenges influencing the growth of the market
  • To strategically analyze the subsegments with respect to individual growth trends, prospects, and contributions of each segment to the overall market size
  • To analyze market opportunities for stakeholders and the competitive landscape of the market
  • To strategically profile the key players and comprehensively analyze their market shares and core competencies
  • To analyze competitive developments, such as deals and agreements in the market

Available Customizations:

With the given market data, MarketsandMarkets offers customizations as per the client’s specific needs. The following customization options are available for this report:

Geographic Analysis

  • Further breakdown of region or country-specific analysis

Company Information

  • Detailed analyses and profiling of additional market players (up to 5)
Custom Market Research Services

We will customize the research for you, in case the report listed above does not meet with your exact requirements. Our custom research will comprehensively cover the business information you require to help you arrive at strategic and profitable business decisions.

Request Customization
Report Code
EP 8980
Published ON
Mar, 2024
Choose License Type
BUY NOW
  • SHARE
X
Request Customization
Speak to Analyst
Speak to Analyst
OR FACE-TO-FACE MEETING
PERSONALIZE THIS RESEARCH
  • Triangulate with your Own Data
  • Get Data as per your Format and Definition
  • Gain a Deeper Dive on a Specific Application, Geography, Customer or Competitor
  • Any level of Personalization
REQUEST A FREE CUSTOMIZATION
LET US HELP YOU!
  • What are the Known and Unknown Adjacencies Impacting the Americas Cables Market
  • What will your New Revenue Sources be?
  • Who will be your Top Customer; what will make them switch?
  • Defend your Market Share or Win Competitors
  • Get a Scorecard for Target Partners
CUSTOMIZED WORKSHOP REQUEST
+1-888-600-6441
  • Call Us
  • +1-888-600-6441 (Corporate office hours)
  • +1-888-600-6441 (US/Can toll free)
  • +44-800-368-9399 (UK office hours)
CONNECT WITH US
ABOUT TRUST ONLINE
©2024 MarketsandMarkets Research Private Ltd. All rights reserved
DMCA.com Protection Status Website Feedback