
Automotive Battery Management System (BMS) Market Size, Share & Trends, 2025 To 2030

Automotive Battery Management System (BMS) Market by Battery Type (Lithium-ion, Lead-acid, Nickel-based, Solid-state Battery), Topology (Modular, Centralized, Distributed), Application (Passenger Vehicles, Commercial Vehicles) - Global Forecast to 2030


OVERVIEW
Source: Secondary Research, Interviews with Experts, MarketsandMarkets Analysis
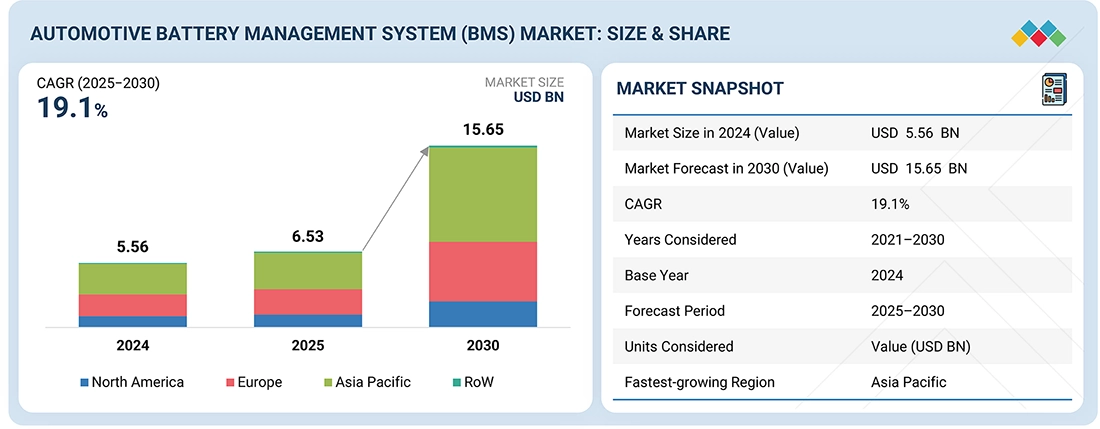
The global automotive battery management system market is expected to grow from USD 6.53 billion in 2025 to USD 15.65 billion by 2030, at a CAGR of 19.1% during the forecast period. The increasing demand for electric, hybrid, and plug-in hybrid vehicles is fueling the need for smart BMS solutions. Growing safety concerns for EVs are pushing OEMs to implement advanced BMS platforms that meet evolving global standards and consumer expectations.
KEY TAKEAWAYS
- The Asia Pacific automotive battery management system (BMS) market accounted for a 47.3% revenue share in 2024
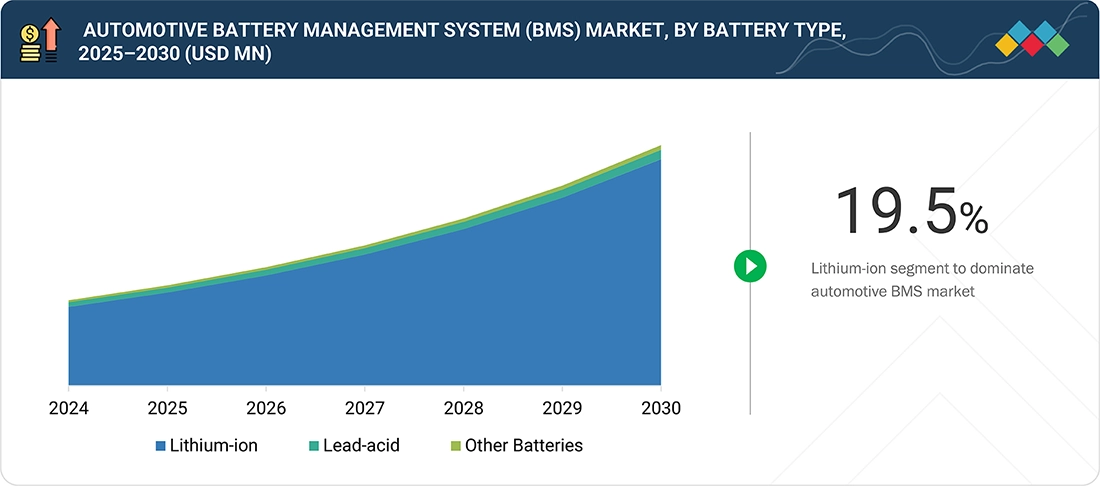
- By battery type, the lithium-ion segment is expected to register the highest CAGR of 19.5%.
- By application, the passenger vehicle segment is expected to register a CAGR of 19.8%
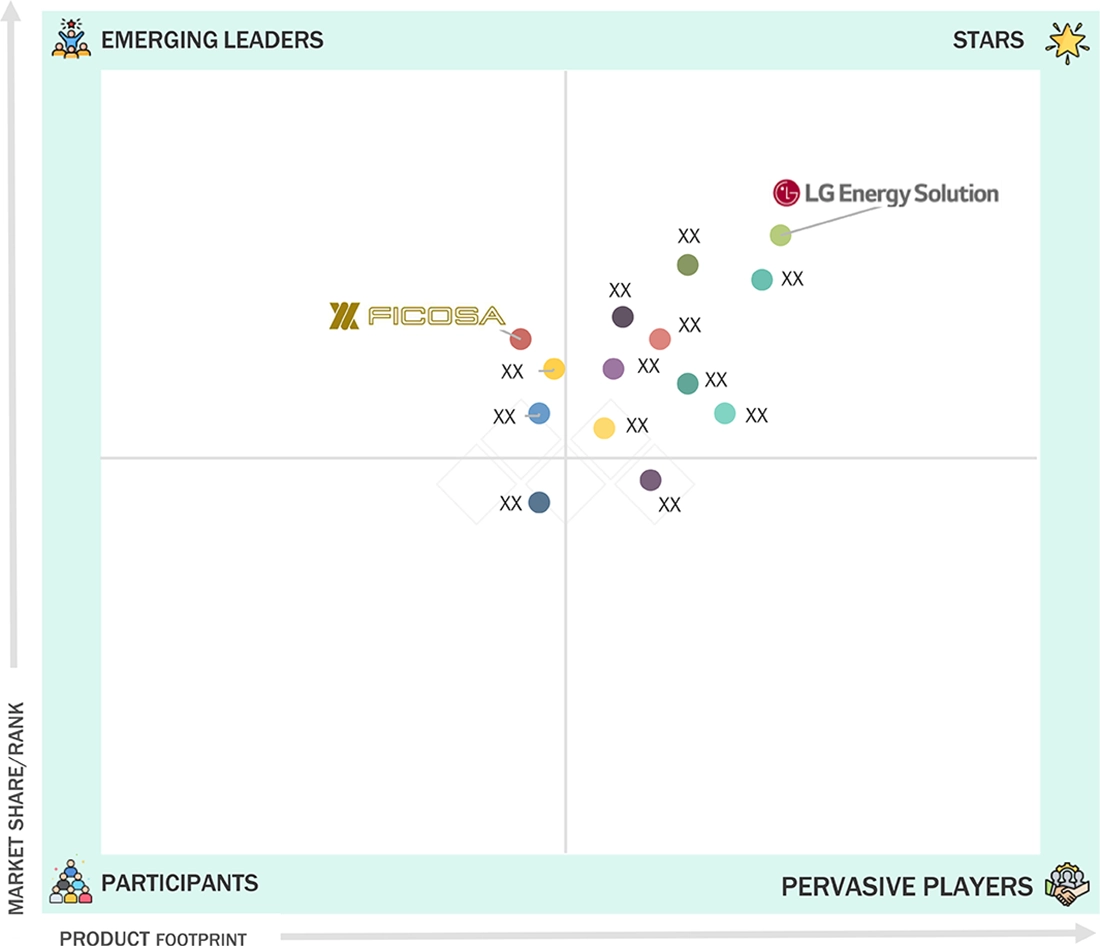
- LG Energy Solution, Sensata Technologies, and Ficosa Internacional were identified as some of the key players in the automotive battery management system market (global), given their strong market share and product footprint.
- Futavis GMBH, BMS PowerSafe, and Eatron Technologies, among others, have distinguished themselves among startups and SMEs by securing strong footholds in specialized niche areas, underscoring their potential as emerging market leaders
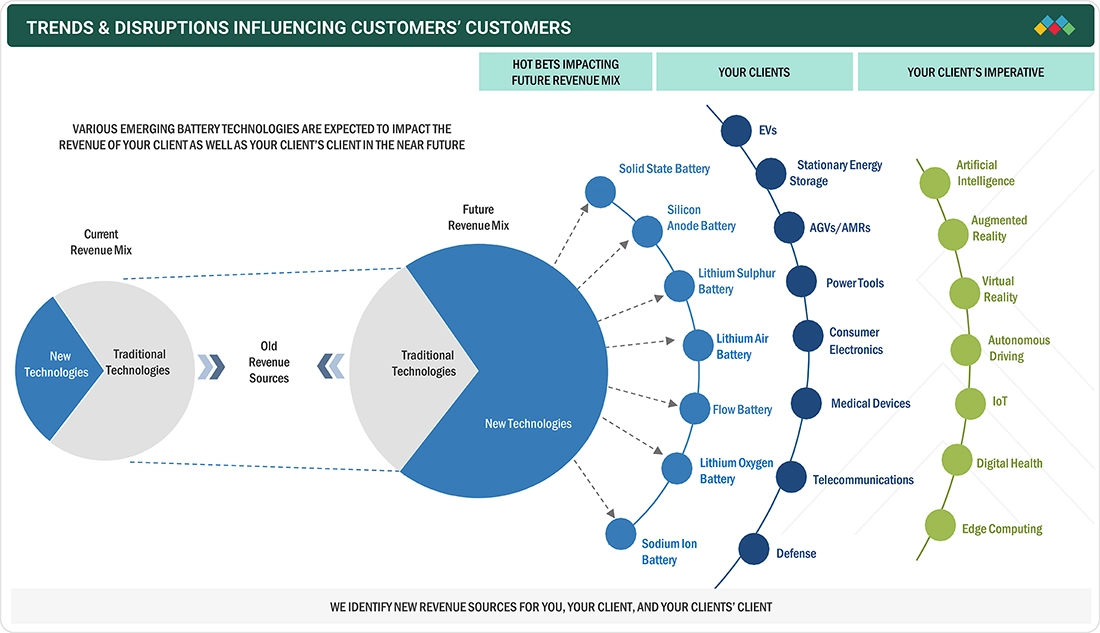
The automotive battery management system (BMS) market is driven by the rapid shift toward electric mobility and smart energy management. Trends such as fast charging, vehicle-to-grid (V2G) technology, and solid-state battery use directly impact energy efficiency and vehicle reliability. These advances in battery technology and electrification boost the need for smarter, more adaptable BMS solutions, supporting market growth among automotive OEMs and Tier-1 suppliers.
TRENDS & DISRUPTIONS IMPACTING CUSTOMERS' CUSTOMERS
The automotive battery management system market is fueled by rising electrification trends and shifting mobility needs. Automakers and fleet operators aim to extend battery life, enhance vehicle range, and guarantee safety through smart energy monitoring. Innovations like solid-state batteries, fast-charging tech, and stricter emission standards directly affect vehicle performance and cost efficiency. These developments shape OEM strategies toward integrating advanced BMS solutions, boosting demand for smarter, more efficient battery monitoring that maximizes energy use and supports next-generation electric vehicle designs.
Source: Secondary Research, Interviews with Experts, MarketsandMarkets Analysis
MARKET DYNAMICS
Level
-
Strong growth of electric vehicles industry

-
Strong focus on electrification of public transportation

Level
-
Developing universal battery management system standards for various applications

Level
-
Emergence of novel battery technologies

-
Advantages of wireless battery management systems over traditional systems

Level
-
Impact of external factors on performance of battery management systems

Source: Secondary Research, Interviews with Experts, MarketsandMarkets Analysis
Driver: Strong growth of electric vehicles industry
The global electric vehicle industry is experiencing significant changes because of advances in battery technology, government support, increasing demand, and growing environmental worries.
Restraint: Developing universal battery management system standards for various applications
Most products in the market, made by various companies, differ in technical specifications and functions such as measuring parameters, types of estimation, communication channels, and others. Therefore, comparing the performance of two battery management systems is confusing because of these differences. This highlights the need to develop clear standards for measuring performance based on the design of battery management systems.
Opportunity: Emergence of novel battery technologies
The development of cell management systems is especially promising because they can improve electric vehicle battery performance, safety, and lifespan, which is essential for increasing adoption and success of electric vehicles. This, in turn, will encourage more widespread use. As EV adoption increases, the demand for BMS to improve battery performance will also grow.
Challenge: Impact of external factors on performance of battery management systems
There is a chance that integrating the BMS with a real-time battery-powered application could impact its accuracy in extreme temperatures. Therefore, maintaining accuracy in a real-time environment is a key requirement for automotive battery management systems, and designing such systems can be a challenge for BMS manufacturers.
Automotive Battery Management System (BMS) Market: COMMERCIAL USE CASES ACROSS INDUSTRIES
| COMPANY | USE CASE DESCRIPTION | BENEFITS |
|---|---|---|
 |
12V/48V lithium-ion BMS with vehicle power grid connection, safety for automated driving (ASIL C), real-time diagnostics and compact high-current integration | Increased safety, reduced vehicle weight, CAN/LIN integration, real-time fault detection, improved energy efficiency, longer battery life |
 |
High-voltage and cell chemistry-agnostic BMS for electric trucks, buses, AGVs with modular architecture, full ISO 26262 ASIL C compliance and built-in pre-charge, parallel pack capability | Advanced safety, easy system upgrade, precise SoX algorithms, flexible design, robust operational reliability, cost and time savings via off-the-shelf ASIL C compliance |
|
|
SoC-based BMS diagnostics with AI and cloud services, real-time in-vehicle analytics, Qualcomm tie-up for digital chassis integration, and advanced cloud-connected solutions | Fast anomaly detection, high safety diagnostics, industry-leading accuracy, lifespan prediction, seamless connectivity, improved customer value in next-gen EVs |
 |
Integrated and distributed BMS for EV and PHEV, developed for major OEMs, includes high-voltage safety devices and complete electronic, hardware, and thermal management solutions | Precise cell monitoring, continual SoC/SoH tracking, user safety, enhanced battery performance, smart control, and optimal longevity for global markets |
 |
AI-powered cloud-based BMS, federated learning for accurate lifetime prediction, advanced data analytics and early anomaly detection for battery packs | Service life prediction, preventive maintenance, long-term battery optimization, secure data handling, compliance with evolving standards, improved efficiency for electric vehicles |
Logos and trademarks shown above are the property of their respective owners. Their use here is for informational and illustrative purposes only.
MARKET ECOSYSTEM
The automotive battery management system market is driven by a strong network of technology developers and component suppliers specializing in energy storage and vehicle electrification. Prominent players include Eberspächer (Germany), Sensata Technologies, Inc. (US), LG Energy Solution (South Korea), Ficosa Internacional SA (Spain), and AVL (Austria). These companies offer advanced BMS solutions that integrate hardware, software, and communication interfaces to monitor battery performance, enhance safety, and extend battery life. The presence of these global automotive and energy system leaders highlights the growing adoption of efficient battery management technologies to support the transition toward electric and hybrid vehicles.

Logos and trademarks shown above are the property of their respective owners. Their use here is for informational and illustrative purposes only.
MARKET SEGMENTS
Source: Secondary Research, Interviews with Experts, MarketsandMarkets Analysis
Automotive Battery Management System (BMS) Market, By Battery Type
Based on battery type, the lithium-ion battery segment is expected to hold the largest share of the automotive battery management system market in 2030. Lithium-ion (Li-ion) batteries have gained considerable popularity in automotive applications due to their ability to deliver high energy and power density in a compact volume and their impressive charge/discharge efficiency.
Automotive Battery Management System (BMS) Market, By Topology
The centralized topology segment is anticipated to significantly influence the expansion of the automotive battery management system market through the year 2030, propelled by the escalating demand for compact and cost-efficient power solutions. Centralized BMS configurations utilize a single control board that directly oversees and manages the entire battery pack, ensuring precise regulation of essential parameters such as voltage, current, and state of charge.
Automotive Battery Management System (BMS) Market, By Application
The passenger vehicle segment is expected to dominate in 2024. This leadership is mainly driven by the growing adoption of electric vehicles (EVs), increasing environmental awareness, and the enforcement of strict global emission standards.
REGION
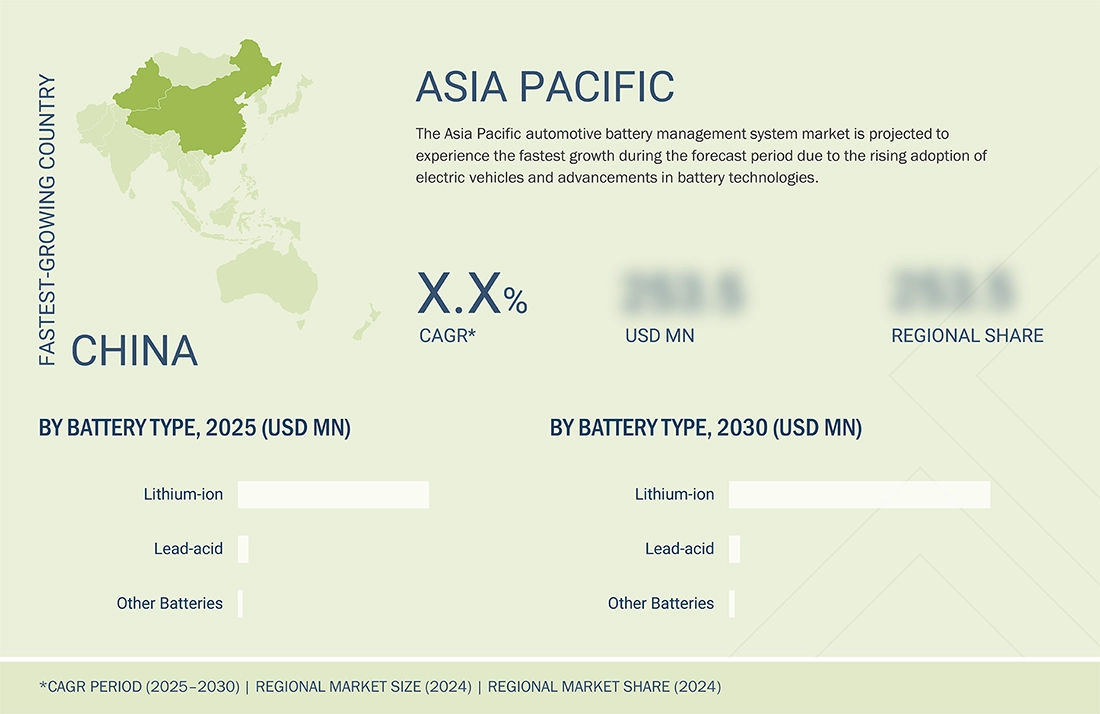
Asia Pacific projected to lead global automotive battery management system market during forecast period
Asia Pacific is expected to lead the global automotive battery management system market through 2030, driven by the rising adoption of electric vehicles and improvements in battery technologies. The region’s strong presence of top battery manufacturers and supportive government policies that promote vehicle electrification further solidify its market leadership.
The North American automotive BMS market is projected to grow from USD 1.11 billion in 2025 to USD 2.25 billion by 2030, registering a CAGR of 15.3%. Market expansion is driven by accelerating adoption of electric and hybrid vehicles across the US, Canada, and Mexico, supported by rising vehicle electrification programs and increasing battery pack production. Integration of advanced sensing technologies, embedded software, real-time diagnostics, and intelligent battery control is enhancing battery safety, thermal stability, and lifecycle performance. In addition, sustained investment in EV manufacturing, battery supply chain localization, and government initiatives promoting clean mobility and domestic production are strengthening the adoption of advanced automotive BMS solutions across North America.
Automotive Battery Management System (BMS) Market: COMPANY EVALUATION MATRIX
In the automotive battery management system (BMS) arena, LG Energy Solution (Star) and Ficosa Corporation (Emerging Leader) occupy prominent roles as a Star player and Emerging Leader, respectively, owing to their extensive product portfolios, global reach, and strong financial resources. Their ongoing innovation and established brand reputation empower them to spearhead the widespread adoption of automotive battery management system (BMS) solutions on a global scale.
Source: Secondary Research, Interviews with Experts, MarketsandMarkets Analysis
KEY MARKET PLAYERS
MARKET SCOPE
| REPORT METRIC | DETAILS |
|---|---|
| Market Size in 2024 (Value) | USD 5.56 Billion |
| Market Forecast in 2030 (Value) | USD 15.65 Billion |
| Growth Rate | CAGR of 19.1% from 2025-2030 |
| Years Considered | 2021-2030 |
| Base Year | 2024 |
| Forecast Period | 2025-2030 |
| Units Considered | Value (USD Million/Billion) |
| Report Coverage | Revenue forecast, company ranking, competitive landscape, growth factors, and trends |
| Segments Covered |
|
| Regional Scope | North America, Asia Pacific, Europe, Middle East & Africa, Latin America |
WHAT IS IN IT FOR YOU: Automotive Battery Management System (BMS) Market REPORT CONTENT GUIDE
DELIVERED CUSTOMIZATIONS
We have successfully delivered the following deep-dive customizations:
| CLIENT REQUEST | CUSTOMIZATION DELIVERED | VALUE ADDS |
|---|---|---|
| European Electric Vehicle OEM |
|
|
| North American Battery Pack Manufacturer |
|
|
| APAC Automotive Tier-1 Supplier |
|
|
RECENT DEVELOPMENTS
- March 2025 : Renesas unveiled the R-BMS F, a lithium-ion battery management platform with pre-validated firmware, tailored for 2-4 and 3-10 cell series applications. It features FGICs, an MCU, an analog front end, software, and documentation, making battery pack design easier for e-bikes, drones, and other devices.
- December 2024 : AVL set up a test infrastructure for battery cells in Germany to boost BMS testing capabilities and enhance battery safety and lifecycle analysis.
- December 2024 : AVL established a test infrastructure for battery cells in Germany to enhance BMS testing capabilities and improve battery safety and lifecycle analysis.
- December 2024 : LG Energy Solution partnered with Qualcomm Technologies, Inc. to integrate its advanced BMS software with Snapdragon Digital Chassis, enhancing safety and anomaly detection in EV batteries.
- May 2024 : Eberspächer and Farasis Energy Europe entered into an exclusive strategic partnership to collaborate on the development, marketing, and production of low-voltage batteries for automotive applications. The partnership combines Eberspächer's battery management system (BMS) expertise with Farasis' advanced cell and housing technology to offer high-performance 12 V and 48 V battery solutions.
- March 2024 : Sensata launched the SIM200, an advanced insulation monitoring device (IMD) designed to ensure continuous active monitoring of unearthed DC systems in electric vehicles and charging stations. It monitors total stored capacitance and enhances battery safety in high-voltage systems, complementing automotive battery management system functionalities.
Table of Contents
 Exclusive indicates content/data unique to MarketsandMarkets and not available with any competitors.
Methodology
The research study involved four major steps in estimating the size of the automotive battery management system market. Exhaustive secondary research has been done to collect important information about the market and peer markets. The next step has been to validate these findings and assumptions and size them with the help of primary research with industry experts across the value chain. Both top-down and bottom-up approaches have been used to estimate the market size. After this, the market breakdown and data triangulation approaches have been adopted to estimate the market sizes of segments and subsegments.
Secondary Research
In the secondary research process, various secondary sources were referred to identify and collect information required for this study. The secondary sources include annual reports, press releases, investor presentations of companies, white papers, and articles from recognized authors. Secondary research has been mainly done to obtain key information about the market's value chain, the pool of key market players, market segmentation according to industry trends, regional outlook, and developments from market and technology perspectives.
In the automotive battery management system market report, the global market size has been estimated using the top-down and bottom-up approaches, along with several other dependent submarkets. The major players in the market were identified using extensive secondary research, and their presence in the market was determined using secondary and primary research. All the percentage splits and breakdowns have been determined using secondary sources and verified through primary sources.
Primary Research
Extensive primary research has been conducted after understanding the automotive battery management system market scenario through secondary research. Several primary interviews have been conducted with key opinion leaders from demand- and supply-side vendors across four major regions—North America, Europe, Asia Pacific, and RoW. Approximately 25% of the primary interviews have been conducted with the demand-side vendors and 75% with the supply-side vendors. Primary data has been collected mainly through telephonic interviews, which consist of 80% of the total primary interviews; questionnaires and emails have also been used to collect the data.
After successful interaction with industry experts, brief sessions were conducted with highly experienced independent consultants to reinforce the findings of our primary research. This, along with the in-house subject matter experts' opinions, has led us to the findings as described in the report. The breakdown of primary respondents is as follows:
 Market Size, and Share")
Note: Others include sales, marketing, and product managers.
To know about the assumptions considered for the study, download the pdf brochure
Market Size Estimation
In the complete market engineering process, the top-down and bottom-up approaches and several data triangulation methods have been used to estimate and forecast the market size for the overall market segments and subsegments listed in this report. Extensive qualitative and quantitative analyses have been performed on the complete market engineering process to list the key information/insights throughout the report. The following table explains the process flow of the market size estimation.
The key players in the automotive battery management system market were identified through secondary research, and their rankings in the respective regions were determined through primary and secondary research. This entire procedure involved the study of the annual and financial reports of top players and interviews with industry experts, such as chief executive officers, vice presidents, directors, and marketing executives, for quantitative and qualitative key insights. All percentage shares, splits, and breakdowns were determined using secondary sources and verified through primary sources. All parameters that affect the markets covered in this research study were accounted for, viewed in extensive detail, verified through primary research, and analyzed to obtain the final quantitative and qualitative data. This data was consolidated, supplemented with detailed inputs and analysis from MarketsandMarkets, and presented in this report.
Bottom-Up Approach
- MarketsandMarkets focuses on the top-line expenditures and investments made throughout the automotive BMS ecosystem to manufacture new systems and retrofit the existing ones.
- Information related to revenues generated by key manufacturers of automotive BMS has been studied and analyzed.
- Multiple on-field discussions have been carried out with key opinion leaders of leading companies involved in manufacturing automotive BMS.
- The geographical split has been estimated using secondary sources based on various factors, such as the number of players in a specific country or region and the automotive BMS provided by these players.
Top-Down Approach
- Tracking leading companies and system integrators operating across various industries
- Deriving the size of the automotive battery management system through the data sanity method, analyzing revenues of more than 20 key providers through their annual reports and press releases, secondary databases, and summing them up to estimate the overall market size
- Conducting multiple discussions with key opinion leaders to understand the demand for automotive BMS and analyzing the breakup of the scope of work carried out by each major company
- Carrying out the market trend analysis to obtain the CAGR of the automotive battery management system by understanding the product penetration rate in each application and analyzing the demand and supply of automotive BMS in different applications
- Assigning a percentage to the overall revenue or, in a few cases, to segmental revenues of each company to derive their revenues from the sales of automotive BMS; this percentage for each company has been assigned based on their product portfolios
- Verifying and crosschecking estimates at every level through discussions with key opinion leaders, including CXOs, directors, and operation managers, and with domain experts at MarketsandMarkets
- Studying various paid and unpaid information sources, such as annual reports, press releases, white papers, and databases
- Tracking ongoing and identifying upcoming automotive BMS projects by companies and forecasting the market size based on these developments and other critical parameters
Automotive Battery Management System (BMS) Market : Top-Down and Bottom-Up Approach
 Market Top Down and Bottom Up Approach")
Data Triangulation
After arriving at the overall size of the automotive battery management system from the market size estimation processes explained above, the total market has been split into several segments and subsegments. Where applicable, the market breakdown and data triangulation procedures have been employed to complete the overall market engineering process and arrive at the exact statistics for all segments and subsegments. The data has been triangulated by studying various factors and trends. Additionally, the market size has been validated using top-down and bottom-up approaches.
Market Definition
A battery management system (BMS) is an electronic device that monitors and controls the operation and functioning of a rechargeable battery. It is called the battery brain, as it enhances safety, performance, charging rates, and longevity by managing current, voltage, temperature, and battery capacity. Its primary functions include preventing overcharging, ensuring safe operation, cell balancing, voltage and temperature control, and determining the state of charge (SoC) and state of health (SoH) of the battery.
A battery management system typically comprises hardware and software customized according to applications and battery specifications.
An automotive BMS is a crucial component of electric vehicles (EVs) that accurately monitors, protects, and optimizes the performance of the battery of electric vehicles. The BMS is responsible for ensuring the battery's safety, preventing it from operating outside its safe area. The main functions of an automotive BMS include monitoring, protection, optimization, integration, scalability, safety, and compliance.
Key Stakeholders
- BMS Providers
- Government Bodies and Policymakers
- Industry-standard Organizations, Forums, Alliances, and Associations
- Market Research and Consulting Firms
- Raw Material Suppliers and Distributors
- Research Institutes and Organizations
- Battery Cell and Battery Pack Manufacturers
- Testing, Inspection, and Certification Providers
- Distributors and Resellers
- End Users
Report Objectives
- To define, describe, and forecast the automotive battery management system market, by battery type, topology, and application, in terms of value
- To provide information about the components and system types of automotive BMS
- To describe and forecast the automotive battery management system size across four regions, namely, North America, Europe, Asia Pacific, and Rest of the World (RoW), in terms of value
- To provide detailed information on drivers, restraints, opportunities, and challenges influencing the market growth
- To provide information related to the ecosystem, case study, patent, technology, pricing, and Porter's five forces analysis, key stakeholders and buying criteria, key conferences and events, and regulatory bodies, government agencies, and regulations pertaining to the market under study
- To strategically analyze micromarkets concerning individual growth trends, prospects, and contributions to the overall market size
- To study the complete value chain of the automotive battery management system
- To strategically profile the key players and comprehensively analyze their market positions in terms of their ranking and core competencies, along with a detailed market competitive landscape
- To analyze competitive developments, such as product launches, acquisitions, and partnerships, in the market
- To provide an analysis of the recession impact on the growth of the market and its segments
Available Customizations
With the given market data, MarketsandMarkets offers customizations according to the specific requirements of companies. The following customization options are available for the report:
- Detailed analysis and profiling of additional market players based on various blocks of the supply chain
Key Questions Addressed by the Report
Need a Tailored Report?
Customize this report to your needs
Get 10% FREE Customization
Customize This ReportPersonalize This Research
- Triangulate with your Own Data
- Get Data as per your Format and Definition
- Gain a Deeper Dive on a Specific Application, Geography, Customer or Competitor
- Any level of Personalization
Let Us Help You
- What are the Known and Unknown Adjacencies Impacting the Automotive Battery Management System (BMS) Market
- What will your New Revenue Sources be?
- Who will be your Top Customer; what will make them switch?
- Defend your Market Share or Win Competitors
- Get a Scorecard for Target Partners

Custom Market Research Services
We Will Customise The Research For You, In Case The Report Listed Above Does Not Meet With Your Requirements
Get 10% Free Customisation


Growth opportunities and latent adjacency in Automotive Battery Management System (BMS) Market