
Automotive Semiconductor Market Size, Share & Trends

Automotive Semiconductor Market by Discrete Power Device, Analog IC, Light Commercial Vehicle (LCV), Heavy Commercial Vehicle (HCV), Internal Combustion Engine (ICE), Electric, Powertrain and ADAS & Autonomous Driving - Global Forecast to 2030


OVERVIEW
Source: Secondary Research, Interviews with Experts, MarketsandMarkets Analysis
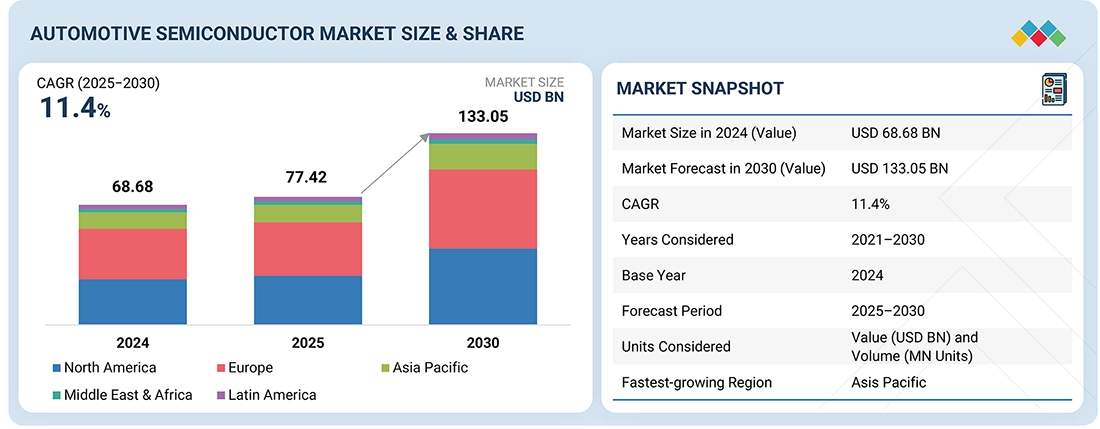
The global automotive semiconductor market is anticipated to grow from USD 77.42 billion in 2025 to USD 133.05 billion by 2030 at a CAGR of 11.4% during the forecast period. The market is driven by the rising adoption of electric vehicles (EVs), advanced driver-assistance systems (ADAS), and vehicle electrification technologies. Continuous innovation in power electronics, sensors, and microcontrollers and the increasing integration of connectivity and automation features accelerate semiconductor demand across the global automotive industry.
KEY TAKEAWAYS
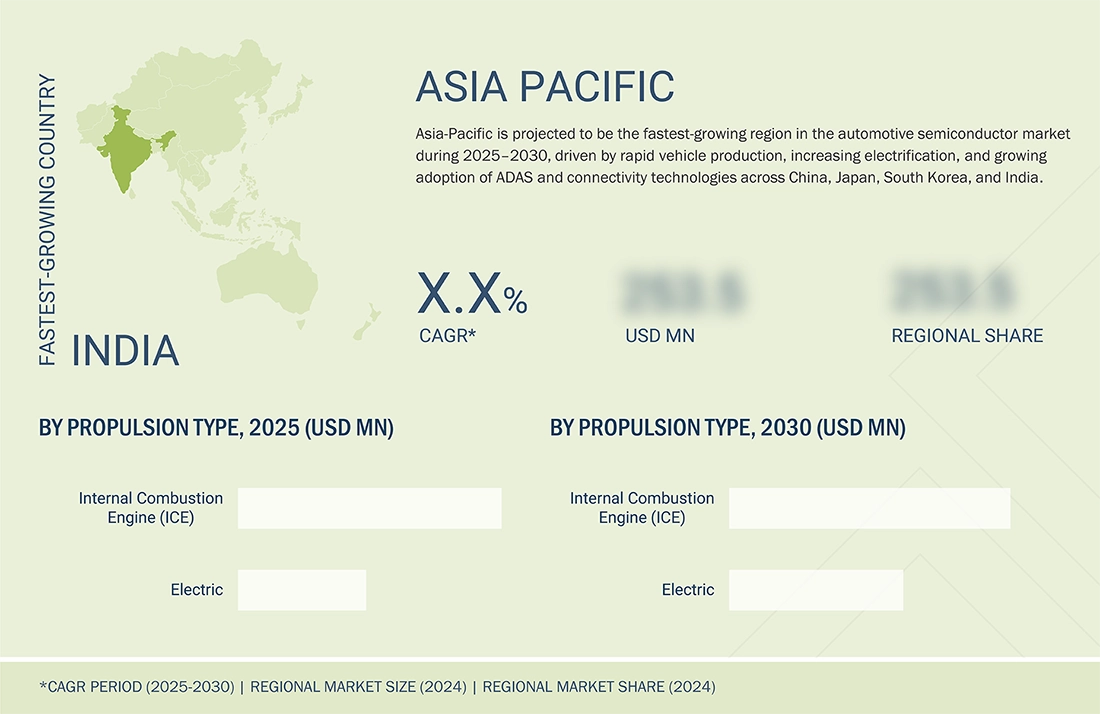
- The Asia Pacific automotive semicondcutor market accounted for a 52.5% revenue share in 2024.
- By application, the ADAS & autonomous driving segment is expected to register the highest CAGR of 15.6%.
- By propulsion type, the electric segment is projected to grow at the fastest rate from 2025 to 2030.
- By component, the analog ICs segment is expected to dominate the market.
- By material, the gallium nitride (GaN) segment will grow the fastest during the forecast period.
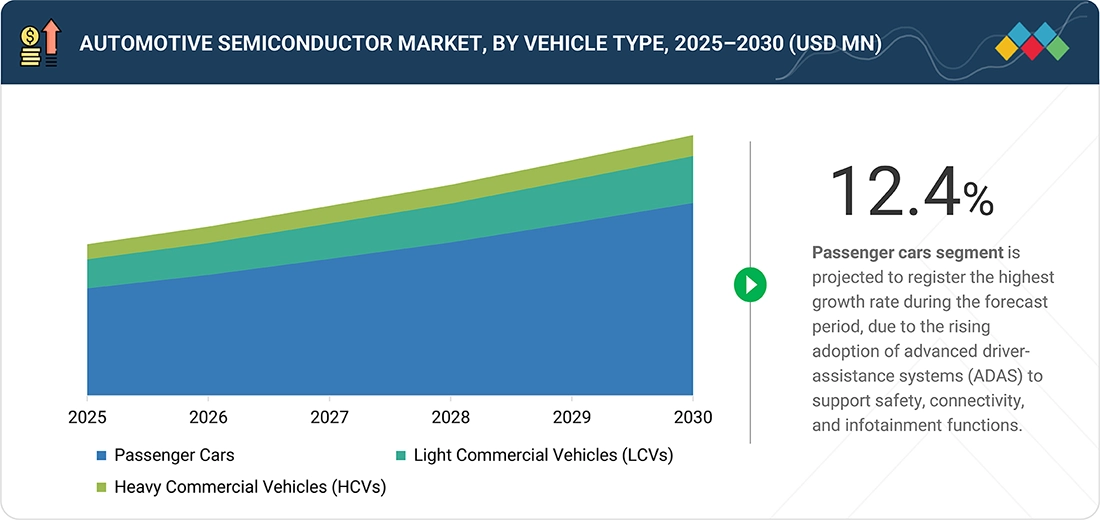
- By vehicle type, the passenger cars segment is expected to dominate the market, growing at the highest CAGR of 12.4%.
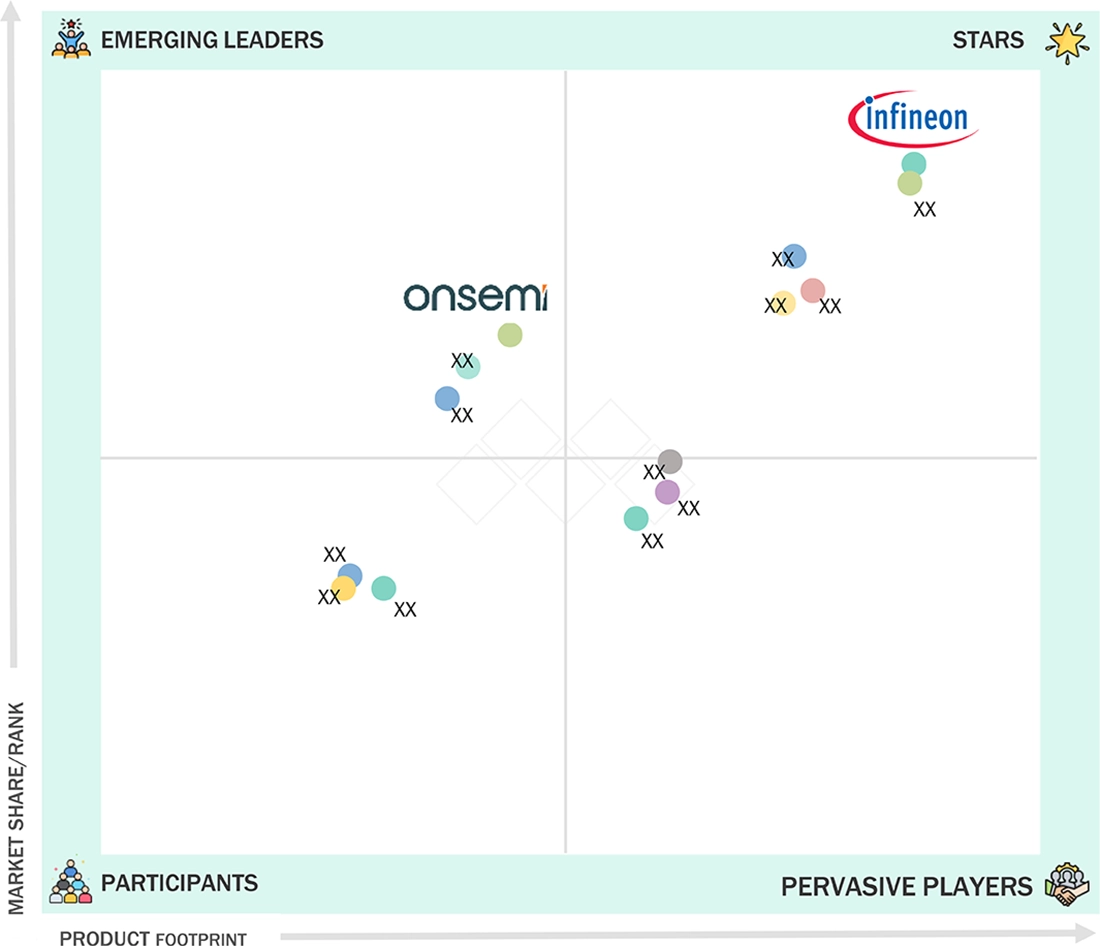
- Robert Bosch GmbH, Continental AG, and DENSO Corporation were identified as some of the star players in the global automotive semiconductor market, given their strong market share and product footprint.
- COMPREDICT, Phantom AI, and Orxa Grid, among others, have distinguished themselves among startups and SMEs by securing strong footholds in specialized niche areas, underscoring their potential as emerging market leaders.
Automotive semiconductors are critical components that enable advanced functionalities in modern vehicles, supporting power management, safety, connectivity, and automation. Their integration is accelerating with the growing adoption of electric vehicles (EVs), ADAS, and autonomous driving systems. The market is driven by vehicle electrification, digitalization, and the transition toward software-defined architectures, which demand high-performance, energy-efficient semiconductor solutions to enhance reliability, intelligence, and overall driving experience.
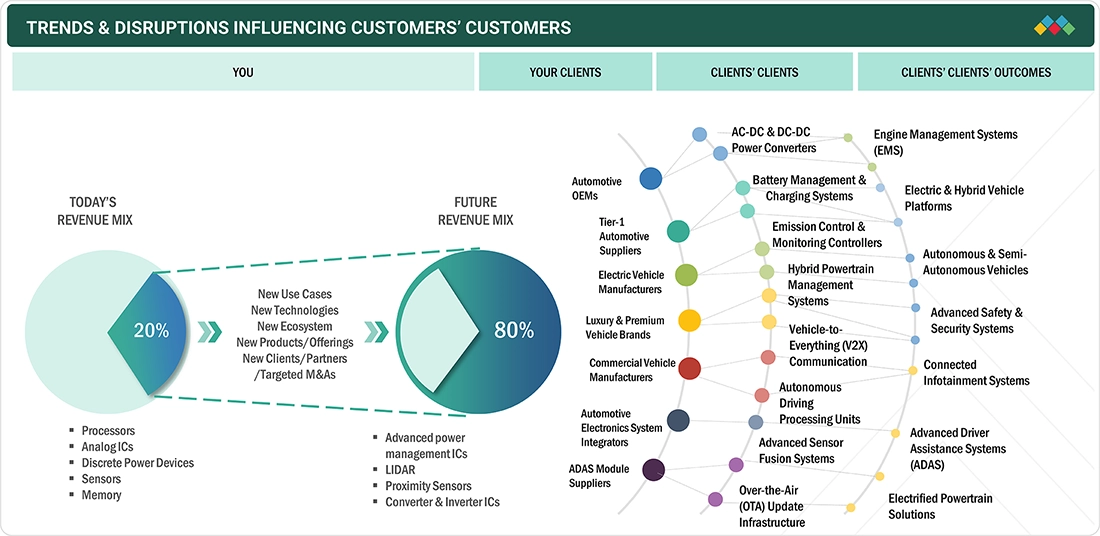
TRENDS & DISRUPTIONS IMPACTING CUSTOMERS' CUSTOMERS
The impact on semiconductor suppliers' business emerges from automotive industry trends and disruptions. It illustrates how revenue mix evolves over 4-5 years, shifting from traditional processors and analog ICs to AI/ML processing units, wide bandgap semiconductors, and LiDAR sensors. This transformation is driven by electrification and autonomous driving demands across Automotive OEMs, Tier-1 Suppliers, and EV Manufacturers.
Source: Secondary Research, Interviews with Experts, MarketsandMarkets Analysis
MARKET DYNAMICS
Level
-
Rising vehicle electrification to curb emissions

-
Rapid advances in ADAS and autonomous driving technologies

Level
-
High development and qualification costs

-
Supply chain and capacity constraints

Level
-
Localization and development of semiconductor ecosystem

-
Rising development of AI-driven domain controllers and edge computing solutions

Level
-
Issues in scaling wide-bandgap semiconductor production for automotive applications

-
Challenges in meeting rigorous standards related to automotive systems

Source: Secondary Research, Interviews with Experts, MarketsandMarkets Analysis
Driver: Rising vehicle electrification to curb emissions
The increasing shift toward vehicle electrification is a key driver for the automotive semiconductor market. Governments worldwide are enforcing stringent emission regulations and offering incentives to accelerate electric vehicle (EV) adoption. This transition is boosting the demand for power electronics, battery management systems, and electric drivetrain control units—all of which rely heavily on semiconductors. As automakers expand their EV portfolios, semiconductor manufacturers are experiencing strong demand for high-efficiency devices, including SiC and GaN components, essential for improving energy conversion and reducing carbon footprints.
Restraint: High development and qualification costs
Developing automotive-grade semiconductors requires substantial investment in design, validation, and compliance with stringent reliability standards, such as AEC-Q100. The need for long testing cycles, safety certifications, and functional verification significantly increases time-to-market and cost structures. Additionally, supply chain disruptions and complex integration with evolving E/E architectures further elevate expenses. These factors pose a barrier to entry for smaller companies and limit scalability, restraining the overall growth pace of the automotive semiconductor market.
Opportunity: Localization and development of semiconductor ecosystem
The growing emphasis on regional self-reliance in semiconductor manufacturing presents a major opportunity for the automotive sector. Countries across Asia, Europe, and North America are investing heavily in local fabrication, packaging, and design capabilities to reduce dependence on imports. Strategic collaborations between automakers, foundries, and governments foster the creation of resilient, localized supply chains. This ecosystem development mitigates geopolitical risks and enhances innovation, enabling faster customization of automotive semiconductors for next-generation vehicles.
Challenge: Issues in scaling wide-bandgap semiconductor production for automotive applications
Despite their superior efficiency and thermal performance, wide-bandgap (WBG) semiconductors, such as SiC and GaN, face production scalability challenges. Complex fabrication processes, limited wafer availability, and higher material costs hinder mass adoption. Moreover, achieving consistent automotive-grade reliability and integrating WBG devices into existing powertrain and inverter systems remain technically demanding. These challenges constrain large-scale commercialization, requiring advancements in manufacturing technology, standardization, and cost optimization to unlock the full potential of WBG semiconductors in electric and hybrid vehicles.
Automotive Semiconductor Market: COMMERCIAL USE CASES ACROSS INDUSTRIES
| COMPANY | USE CASE DESCRIPTION | BENEFITS |
|---|---|---|
 |
Power semiconductors (Si and SiC MOSFETs, IGBTs) and microcontrollers (AURIX) for EV powertrains, battery management, and advanced driver-assistance systems (ADAS) | Industry-leading power efficiency and thermal stability | Scalable semiconductor platforms for multiple OEM segments | Strong partnerships across EV ecosystem and Tier-1 suppliers |
 |
Automotive-grade processors, radar and vision SoCs, and connectivity solutions (V2X, CAN, Ethernet) for ADAS, digital cockpits, and connected mobility | Secure-by-design processors with real-time data protection | Integrated connectivity enabling advanced V2X and telematics | Optimized for over-the-air (OTA) software updates and SDV scalability | Energy-efficient processing with low latency |
 |
Power modules, sensors, and MCUs (SPC5, STM32) for EV inverters, on-board chargers, and smart mobility solutions integrating AI-enabled ADAS | High energy efficiency through SiC-based power conversion | Seamless integration of sensors and MCUs for enhanced safety | AI-capable platforms supporting autonomous functions | Extensive product reliability for harsh automotive environments |
 |
Analog and mixed-signal ICs, PMICs, and signal processors for EV powertrain control, battery management, and ADAS sensor interfaces | Industry-leading precision analog and mixed-signal performance | Enhanced battery life and system efficiency through advanced PMICs | Long-term product availability and automotive qualification | Reduced design complexity with integrated reference architectures |
 |
System-on-chips (R-Car), MCUs, and power devices for vehicle electrification, ADAS, and domain controllers enabling software-defined architectures | Scalable SoC platforms supporting software-defined architectures | High-performance computing for ADAS and automated driving | Flexible modular designs reducing total system cost |
Logos and trademarks shown above are the property of their respective owners. Their use here is for informational and illustrative purposes only.
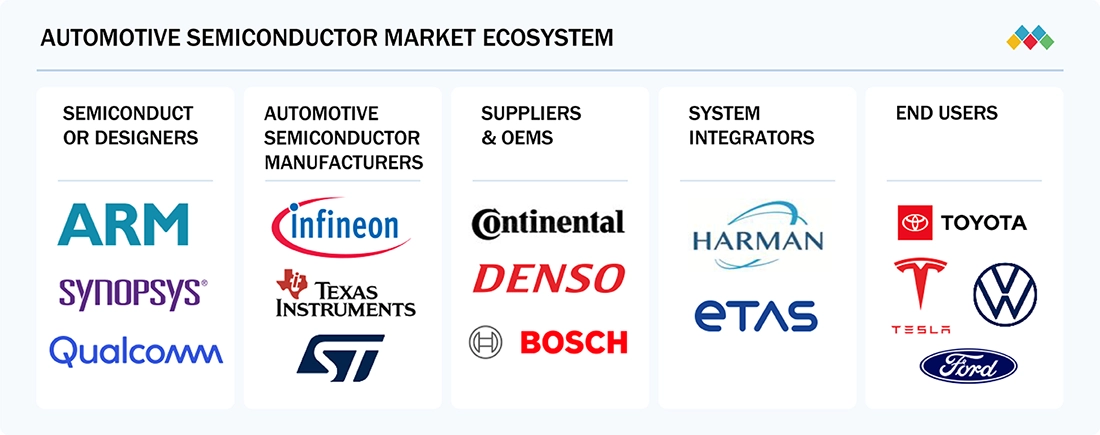
MARKET ECOSYSTEM
The automotive semiconductor ecosystem involves identifying and analyzing interconnected relationships among various stakeholders, including semiconductor designers, automotive semiconductor manufacturers, suppliers & OEMs, system integrators, and end users. Semiconductor designers, such as ARM, Synopsys, and Qualcomm, develop chip architectures; automotive semiconductor manufacturers, such as Infineon, Texas Instruments, and STMicroelectronics, produce specialized chips; suppliers & OEMs, including Continental, Denso, and Bosch, integrate these into vehicle systems; system integrators, such as Harman and ETAS, develop complete electronic control platforms; and end users, such as Toyota, Tesla, Volkswagen, and Ford, deploy these technologies in their vehicles.
Logos and trademarks shown above are the property of their respective owners. Their use here is for informational and illustrative purposes only.
MARKET SEGMENTS
Source: Secondary Research, Interviews with Experts, MarketsandMarkets Analysis
Automotive Semiconductor Market, By Component
The analog ICs segment is expected to hold the largest market share during 2025–2030, owing to their widespread use in power management, signal conditioning, and sensor interfaces across vehicle systems. Analog ICs enable seamless communication between digital and physical components, ensuring optimal performance in applications such as powertrain control, safety systems, and infotainment. Meanwhile, the sensors segment is projected to grow at the highest CAGR, fueled by the increasing adoption of ADAS, autonomous driving technologies, and electrified powertrains that demand high precision and real-time data processing.
Automotive Semiconductor Market, By Vehicle Type
The passenger cars segment is anticipated to register the fastest CAGR during 2025–2030. Growth is attributed to the rapid integration of advanced electronics, including ADAS, infotainment, and vehicle connectivity features. The rising demand for electric and hybrid passenger vehicles, coupled with government incentives and safety regulations, augments semiconductor deployment. Increasing consumer preference for technologically advanced vehicles and the proliferation of software-defined architectures further strengthen semiconductor utilization in this segment.
Automotive Semiconductor Market, By Propulsion Type
The internal combustion engine (ICE) segment is expected to maintain the largest market share by 2030, driven by its dominant presence in global vehicle production, especially in developing economies. ICE vehicles continue to integrate advanced semiconductor solutions for emission control, engine management, and safety compliance. However, the electric vehicle (EV) segment is forecasted to record the highest CAGR during the period, supported by global electrification trends, government policies promoting zero-emission vehicles, and innovations in power electronics and battery management systems.
Automotive Semiconductor Market, By Application
The powertrain segment is projected to hold the largest market share in 2025 and 2030, as semiconductors play a crucial role in engine control units, transmission systems, and electric motor drives. Increasing emphasis on energy efficiency, emission reduction, and enhanced performance drives semiconductor adoption in powertrain applications. Additionally, the ADAS & autonomous driving segment is set to witness the highest CAGR, propelled by advancements in sensor fusion, radar, and vision systems supporting next-generation intelligent mobility.
Automotive Semiconductor Market, By Material
The silicon (Si) segment dominates the automotive semiconductor market due to its maturity, scalability, and cost efficiency across vehicle electronics. However, gallium nitride (GaN) is expected to register the highest CAGR from 2025 to 2030, driven by its superior efficiency and growing use in EV powertrain and charging systems.
REGION
Asia Pacific is expected to be fastest-growing region in the global automotive semiconductor market during the forecast period
Asia Pacific is projected to be the fastest-growing region in the automotive semiconductor market during the forecast period. The regional market is driven by the rapid expansion of vehicle production, increasing electrification, and the growing integration of advanced driver-assistance systems (ADAS) and connectivity features. Countries such as China, Japan, South Korea, and India are leading semiconductor adoption through strong government incentives, EV manufacturing initiatives, and advancements in automotive electronics. The robust supply chain, expanding semiconductor fabrication capacity, and rising consumer demand for smart and energy-efficient vehicles further position the region as a key growth hub for the global automotive semiconductor market.
Automotive Semiconductor Market: COMPANY EVALUATION MATRIX
In the automotive semiconductor market matrix, Infineon Technologies AG (Star) leads with a strong market presence and a comprehensive portfolio spanning power semiconductors, microcontrollers, and sensors, driving innovation in vehicle electrification, ADAS, and safety systems. Qualcomm Technologies, Inc. (Emerging Leader) is rapidly expanding its footprint with advanced automotive platforms focused on connectivity, infotainment, and autonomous driving, positioning itself as a key emerging player in the software-defined and connected vehicle ecosystem.
Source: Secondary Research, Interviews with Experts, MarketsandMarkets Analysis
KEY MARKET PLAYERS
MARKET SCOPE
| REPORT METRIC | DETAILS |
|---|---|
| Market Size in 2024 (Value) | USD 68.68 Billion |
| Market Forecast in 2030 (Value) | USD 133.05 Billion |
| Growth Rate | CAGR of 11.4% from 2025-2030 |
| Years Considered | 2021-2030 |
| Base Year | 2024 |
| Forecast Period | 2025-2030 |
| Units Considered | Value (USD Million/Billion) and Volume (Million Units) |
| Report Coverage | Revenue forecast, company ranking, competitive landscape, growth factors, and trends |
| Segments Covered |
|
| Regional Scope | North America, Europe, Asia Pacific, and RoW |
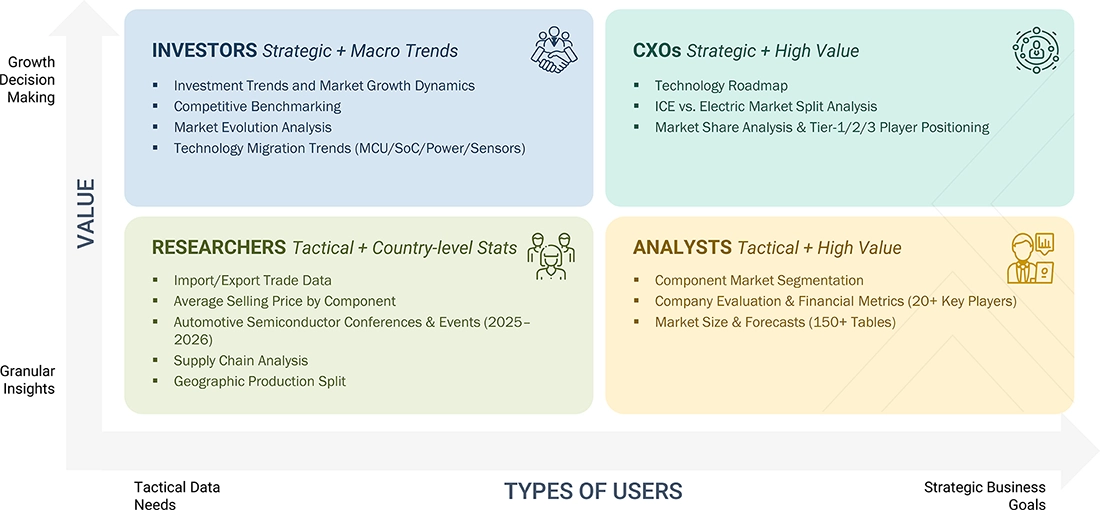
WHAT IS IN IT FOR YOU: Automotive Semiconductor Market REPORT CONTENT GUIDE
DELIVERED CUSTOMIZATIONS
We have successfully delivered the following deep-dive customizations:
| CLIENT REQUEST | CUSTOMIZATION DELIVERED | VALUE ADDS |
|---|---|---|
| Local Competitive Landscape | Profiles of leading regional and global players, including Infineon, NXP, Renesas, STMicroelectronics, and Qualcomm, covering market share, revenue, product offerings, and strategic initiatives across power semiconductors, MCUs, sensors, and connectivity solutions. | Enabled competitive benchmarking and informed strategy development for technology expansion, partnership formulation, and investment prioritization. |
| Regional Market Entry Strategy | Country- or region-specific go-to-market strategies addressing regulatory environments, supply chain localization, vehicle electrification policies, and OEM-tier partnership opportunities. | Minimized entry barriers and accelerated market penetration through targeted deployment strategies and alignment with regional automotive trends. |
| Local Risk & Opportunity Assessment | Identification of regional challenges such as chip shortages, production scalability, and raw material dependencies, along with untapped opportunities in EVs, ADAS, and connected vehicles. | Supported proactive risk mitigation and guided capital allocation toward high-growth, low-risk segments. |
| Technology Adoption by Region | Insights into regional adoption of silicon, SiC, and GaN materials; integration trends across powertrain, ADAS, and infotainment; and regional R&D and fabrication capabilities. | Guided R&D, capacity planning, and investment strategies in alignment with regional technology maturity and material transition trends. |
RECENT DEVELOPMENTS
- March 2025 : Infineon Technologies AG announced a new family of AURIX automotive microcontrollers based on the RISC-V architecture. The company also introduced a virtual prototype starter kit to allow pre-silicon software development and faster validation of automotive applications.
- June 2025 : In January 2025, NXP Semiconductors announced its intent to acquire TTTech Auto’s safety software and middleware business. The acquisition was finalized in June 2025, significantly enhancing NXP’s S32 automotive compute platform with advanced functional safety and middleware capabilities, strengthening its position in next-generation, software-defined automotive architectures.
- April 2025 : STMicroelectronics launched the Stellar P6 automotive microcontroller, designed for next-generation electric vehicle platforms, offering enhanced performance and integration capabilities.
- May 2024 : Renesas Electronics Corporation announced a major regional expansion in India by partnering with the Ministry of Electronics and Information Technology (MeitY). The initiative includes setting up expanded offices in Bengaluru and Noida to strengthen semiconductor R&D, foster startup collaborations, and support India’s growing automotive electronics and chip design ecosystem.
Table of Contents
 Exclusive indicates content/data unique to MarketsandMarkets and not available with any competitors.
Methodology
The study involved four major activities in estimating the current size of the drone (UAV) payload market. Exhaustive secondary research was done to collect information on the drone (UAV) payload market, its adjacent markets, and its parent market. The next step was to validate these findings, assumptions, and sizing with industry experts across the value chain through primary research. Demand-side analyses were carried out to estimate the overall size of the market. After that, market breakdown and data triangulation procedures were used to estimate the sizes of different segments and subsegments of the drone (UAV) payload market.
Secondary Research
In the secondary research process, various sources were referred to to identify and collect information for this study. The secondary sources included government sources, such as SIPRI; corporate filings such as annual reports, press releases, and investor presentations of companies; white papers, journals, and certified publications; and articles from recognized authors, directories, and databases.
Primary Research
Extensive primary research was conducted after acquiring secondary research information regarding the drone (UAV) payload market scenario. Several primary interviews were conducted with market experts from the demand and supply sides across major countries of North America, Europe, Asia Pacific, the Middle East, and the Rest of the World. Primary data was collected through questionnaires, emails, and telephonic interviews.

To know about the assumptions considered for the study, download the pdf brochure
Market Size Estimation
The top-down and bottom-up approaches were used to estimate and validate the size of the drone (UAV) payload market. The research methodology used to estimate the size of the market included the following details:
- Key players in the drone (UAV) payload market were identified through secondary research, and their market share was determined through primary and secondary research. This included a study of the annual and financial reports of the top market players and extensive interviews with leaders such as directors, engineers, marketing executives, and other stakeholders of leading companies operating in the market.
- All percentage shares, splits, and breakdowns were determined using secondary sources and verified through primary sources.
- All possible parameters that affect the markets covered in this research study were accounted for, viewed in extensive detail, verified through primary research, and analyzed to obtain the final quantitative and qualitative data on the Drone (UAV) payload market. This data was consolidated, enhanced with detailed inputs, analyzed by MarketsandMarkets, and presented in this report.
Automotive Semiconductor Market: Top-Down and Bottom-Up Approach

Data Triangulation
After arriving at the overall market size, the total market was split into several segments and subsegments. The data triangulation and market breakdown procedures explained below were implemented, wherever applicable, to complete the overall market engineering process and arrive at the estimated market numbers for the market segments and subsegments. The data was triangulated by studying various factors and trends from the demand and supply sides. Along with this, the market size was validated using the top-down and bottom-up approaches.
Market Definition
Unmanned aerial vehicles generally include a bus, a gimbal, and a payload, which is commonly used to gather data. These payloads include electro-optic/infrared sensors, maritime patrol radar, cameras, optronics, or hyperspectral sensors. These payloads are commissioned based on mission-critical requirements. The payload is attached to a gimbal, which acts as a stabilizing platform to minimize vibrations. Unmanned aerial vehicles (UAVs), also known as drones, are also used for reconnaissance and surveillance. Drones are mainly known for their usage in varied missions, such as military attacks, border surveillance, mapping, surveying, weather determination, and regional law enforcement. Payloads are a part of a drone system and comprise sensors, cameras, communication systems, and weaponry.
Key Stakeholders
- Raw Material Suppliers
- Wafer Fabrication Equipment Providers
- Foundries
- Integrated Device Manufacturers (IDMs)
- Fabless Semiconductor Companies
- OSAT (Outsourced Semiconductor Assembly & Test) Providers
- Tier 2 Component Suppliers
- Tier 1 Automotive Suppliers
- Automotive OEMS (Vehicle Manufacturers)
- Software & Firmware Developers
- Testing, Validation & Certification Agencies
- Government & Regulatory Bodies
- Research & Academic Institutions
- Investment Banks, Venture Capitalists, and Private Equity Firms
- Distributors & Channel Partners
- End Users (Automotive OEMs, Fleet Operators, Mobility Service Providers)
Report Objectives
- To describe, segment, and forecast the automotive semiconductor market, by component, vehicle type, propulsion type, material, and application, in terms of value
- To describe and forecast the market for various segments with respect to four main regions: North America, Europe, Asia Pacific, and RoW, along with their respective countries, in terms of value
- To forecast the automotive semiconductor market, by component, in terms of volume
- To provide detailed information regarding drivers, restraints, opportunities, and challenges influencing the growth of the automotive semiconductor market
- To provide a detailed overview of the supply chain, along with the ecosystem, technology analysis, use cases, regulatory landscape, Porter’s five forces analysis, the impact of Gen AI/AI, the impact of the 2025 US tariff, and the macroeconomic outlook for regions covered under the study
- To analyze industry trends, pricing data, patents, and trade data (export and import data) related to automotive semiconductors
- To strategically analyze the micromarkets with respect to individual growth trends, prospects, and contributions to the total market
- To strategically profile the key players and comprehensively analyze their market share and core competencies
- To analyze opportunities for stakeholders and provide a detailed competitive landscape of the market
- To analyze competitive developments, such as product launches, collaborations, partnerships, acquisitions, expansions, and research & development (R&D) activities, carried out by players in the automotive semiconductor market
Available Customizations:
With the given market data, MarketsandMarkets offers customizations according to the specific requirements of companies. The following customization options are available for the report:
Country-wise Information:
- Country-wise breakdown for North America, Europe, Asia Pacific, and the Rest of the World
Company Information:
- Detailed analysis and profiling of additional market players (up to five)
Need a Tailored Report?
Customize this report to your needs
Get 10% FREE Customization
Customize This ReportPersonalize This Research
- Triangulate with your Own Data
- Get Data as per your Format and Definition
- Gain a Deeper Dive on a Specific Application, Geography, Customer or Competitor
- Any level of Personalization
Let Us Help You
- What are the Known and Unknown Adjacencies Impacting the Automotive Semiconductor Market
- What will your New Revenue Sources be?
- Who will be your Top Customer; what will make them switch?
- Defend your Market Share or Win Competitors
- Get a Scorecard for Target Partners

Custom Market Research Services
We Will Customise The Research For You, In Case The Report Listed Above Does Not Meet With Your Requirements
Get 10% Free CustomisationGrowth opportunities and latent adjacency in Automotive Semiconductor Market


Jim
Jun, 2016
I am a freelance writer working on story for trade magazine about the European automotive semiconductor market and I need to interview an analyst for the feature. I am wondering to what degree the European chip market is growing and if it is growing faster than other regions and what is driving growth. Can you suggest an analyst I could interview for the story? .
fenglin
Dec, 2019
Our company treated automotive S/W based on own SoC. Need to understand the recent market trend of automotive industry in order to establish more better technical strategy..
Kiritkumar
Nov, 2019
I would like to get an report on Electric Vehicle (EV) market analysis covering the following points: � Electric Vehicle charger market. � IC Design companies involved in the car-battery charger market. Different ICs used in the charger and the competitor landscape. � Power Management Integrated Circuit (PMIC) ICs used in the Automobiles. Competitor market share and total market share over the period of the next five years. .
Richard
Oct, 2019
Hello, I am a first year MBA student conducting a research project on the growth of semi-conductor chips in automobiles. Considering your expertise, I was wondering if I could discuss with your team this growth. .
Richard
Oct, 2019
I contacted you earlier today regarding chips and automobiles and you called back and left a message (I was in a meeting), but I cannot seem to call you again. Could you please email me or phone me again?.
Oct, 2019
Ok, I am so sorry. I keep trying to call you and it is not connecting. Perhaps can I get your email and phone number via email?.
Robert
Jun, 2019
Need information on 1. Which company/fab in memory application is in support of the automotive market? 2. What is the timeline of the automotive chip makers for production? .
Loison
May, 2018
Hello, I am currently making some research on the automotive market of semiconductors to find/ make financials' forecasts. .