Ball Valves Market

Ball Valves Market by Material (Cast Iron, Stainless Steel, Alloy-based, Brass, Bronze & Plastic), Type(Trunnion-mounted, Floating, Rising Stem), Size (<1”, 1”-5”, 6”-24”, 25”-50” & >50”), Industry (Oil & Gas, Chemicals) & Region - Global Forecast to 2028

Report Code: SE 5368 Dec, 2023, by marketsandmarkets.com

[240 Pages Report] The global Ball valves market is expected to grow from USD 13.6 billion in 2023 to USD 17.0 billion by 2028, registering a CAGR of 4.6%. The expansion of the ball valves market has been driven by heightened industrialization, rising demands within the oil & gas sector, water treatment necessities, and the proliferation of global infrastructure projects. Advancements in technology and a commitment to optimizing fluid control systems have propelled this market's remarkable growth.

Ball Valves Market

Ball Valves Market

Ball Valves Market Forecast to 2028

To know about the assumptions considered for the study, Request for Free Sample Report

Market Dynamics

Driver: Rising need for safety and enhancing product quality in industrial sector

Aging infrastructure in oil & gas and water & wastewater treatment industries is a primary concern in several countries. For instance, the US has a wide network of old pipelines that are used for transporting critical commodities, including natural gas, oil, water, and wastewater. Several types of valves, including ball valves, used in old infrastructure, have surpassed their operational life. Hence, the replacement of such old or outdated valves is imperative for improved performance and better worker safety. The need for the replacement or repair of old infrastructure is expected to create demand for new ball valves. End users are focusing on adopting highly reliable, integrated, and cutting-edge solutions to resolve the issue of maintenance. Ball valves have been in use in process industries for more than 40 years. These valves are prone to wear and tear at half of their age. Thus, old valves are being replaced with new customized valves that meet the requirements of material, size, and others for critical applications. The old infrastructure of the process industries is undergoing the replacement of valves.

The valve industry is employing advanced technologies in its offerings. Smart valves offer several benefits to end-user industries or operators of valves. For instance, when residential applications such as traditional taps are considered, turning on and off the valves can easily be done manually; however, it is very complex to operate hundreds of valves across a wide area of a utility network. Also, on a commercial scale, controlling the flow of water in a network requires personnel to release the water, thereby leading to additional costs and inefficient and non-accurate process handling. In contrast, smart valves give users complete control over the flow of a pipe network. Smart valves enable the operator to control the valve remotely, both from inside the building or from some other area. Smart valves will prove to be a great solution for utility companies, factories, housing estates, mining and irrigation systems, adding significant value to many industrial and residential use cases. Various valve manufacturers are investing in the research and development activities related to smart valves.

Restraint: High Cost of Raw Materials

The high cost of raw materials for manufacturing ball valves is influenced by factors like material selection, market conditions, energy costs, quality standards, environmental regulations, labor costs, transportation expenses, and customization requirements. Materials such as stainless steel, brass, and exotic alloys contribute to varying costs. Global supply and demand fluctuations, geopolitical events, and energy price changes affect raw material prices. Stringent quality standards and environmental regulations may increase costs. Labor and transportation expenses can vary by region. Customization and specialized requirements may also drive-up costs. Manufacturers must consider these factors and explore cost-saving measures to remain competitive.

Opportunity: Application of 3D printing technology in valve manufacturing

The adoption of 3D printing technology in R&D activities and production processes can help in the quick release of designs, fast response to customer inquiries, and accurate weight estimation and prototyping.

Fast prototyping is essential in product development and generally requires lots of testing and iterations. 3D printing is the ideal technology in such cases as manufacturers can quickly print prototypes and start with rigorous testing programs, as well as find a timely solution to the requirements. In some cases, the performance of 3D printed components exceeds the ones manufactured by traditional manufacturing methods. In December 2018, Metso developed the first valves with 3D printed parts from its Helsinki plant. 3D printed metal components allowed the valves to perform in a particularly demanding application where they needed to withstand numerous fast open-close cycles without maintenance. For some urgent customer requirements, the current selection of 3D-printed valves may present some limitations, but it also provides new opportunities when aiming at reliability, longer service life, and improved safety features of valves.

Challenge: Complexities associated with integration of different components of Ball valves systems and production lines at application sites 

Many manufacturers offering low-priced valves result in the slowdown of the ball valves market. Various types of ball valve components are exported from China; as a result, Chinese manufacturers can achieve a cost advantage in the manufacturing of ball valves. This trend is creating the challenge of manufacturing low-priced ball valves. In addition, domestic manufacturers are posing a threat to multinational companies due to their strong local market foothold. Further, the manufacturing facilities of domestic valve suppliers are closer to the customers, which has resulted in reduced lead time-to-market. The reason for the adoption of domestic ball valves is their capability to perform a similar function at a lower cost. Therefore, the influence of domestic vendors and low-priced ball valves is a challenge for major industry players.

Ball valves Market Ecosystem

Ball valves Market by Ecosystem

Stainless Steel Ball valves holds largest market share in year 2022

The worldwide expansion of stainless steel ball valves stems from their durability, corrosion resistance, and adaptability across industries such as oil & gas, chemicals, and water treatment. Their dependable performance has fueled increased demand, establishing them as vital components in various sectors on a global scale.

Trunnion-mounted segment to grow at highest CAGR in the forecast period 2023-2028.

Trunnion Mounted Ball Valves have experienced substantial growth due to their durable design, guaranteeing reliable performance in high-pressure applications across industries such as oil and gas, petrochemicals, and power generation. Their superior sealing and resilience enable efficient fluid control, reducing the risk of leaks in critical operations.

1”-5” segment to grow at highest CAGR in the forecast period 2023-2028.

The burgeoning demand for 1 to 5-inch ball valves stems from their versatile application across industries. Renowned for adept fluid flow control, reliable seals, and robust durability, these valves are favored in oil, gas, water treatment, and chemical sectors, driven by their compactness, high-pressure handling, and easy maintenance.

Pulp & Paper is expected to register highest CAGR during the forecast period

Ball valves play a crucial role in the Pulp & Paper sector, valued for their reliability and resilience in corrosive pulp processes. Their ability to endure harsh chemicals and high pressures, preventing leaks, is essential for uninterrupted pulp production. As the industry prioritizes efficiency and reduced downtime, ball valves are instrumental, fostering growth and innovation to meet evolving operational needs.

Ball Valves Market by Region

Ball Valves Market by Region

To know about the assumptions considered for the study, download the pdf brochure

Asia Pacific to grow at highest CAGR during the forecast period

The Asia Pacific region has seen a substantial uptick in the uptake of ball valves due to their robustness, reliability, and operational efficiency across key sectors such as oil & gas, water treatment, and manufacturing. This heightened adoption is a direct result of escalating infrastructure development and urbanization trends in the region. Consequently, it has led to significant market expansion, fostering innovative advancements in valve technology within this geographic area.

Key Market Players

The Ball valves companies players have implemented various organic and inorganic growth strategies, such as product launches, collaborations, partnerships, and acquisitions, to strengthen their offerings in the market. The major players in the market are Emerson Electric Co. (US), Flowserve Corporation (US), SLB (US), IMI (UK), Valmet (Finland), Crane Company (US), KITZ Corporation (Japan), Neway Valves Co. Ltd. (China), Spirax Sarco Limited (UK), Trillium Flow Technologies (US) and Others

The study includes an in-depth competitive analysis of these key players in the Ball valves market with their company profiles, recent developments, and key market strategies.

Get online access to the report on the World's First Market Intelligence Cloud

  • Easy to Download Historical Data & Forecast Numbers
  • Company Analysis Dashboard for high growth potential opportunities
  • Research Analyst Access for customization & queries
  • Competitor Analysis with Interactive dashboard
  • Latest News, Updates & Trend analysis
Request Sample

Scope of the Report

Report Metric

Details

Years Considered

2019–2028

Base Year Considered

2022

Forecast Period

2023–2028

Forecast Units

Value (USD Million/Billion)

Segments Covered

By Materials, By Type, By Size, By Industry, and By Region

Regions Covered

North America, Asia Pacific, Europe, and the Rest of the World

Companies Covered

Emerson Electric Co. (US), Flowserve Corporation (US), SLB (US), IMI (UK), Valmet (Finland), Crane Company (US), KITZ Corporation (Japan), Neway Valves Co. Ltd. (China), Spirax Sarco Limited (UK), Trillium Flow Technologies (US) and a total of 25 players covered

Ball Valves Market Highlights

This report has segmented the Ball valves market based on Materials, Type, Size and  Industry and Region.

Segment

Subsegment

By Material

  • Cast Iron
  • Stainless Steel
  • Alloy-based
  • Others

By Type

  • Trunnion-mounted
  • Floating
  • Rising Stem

By Size

  • <1”
  • 1” − 5”
  • 6” – 24"
  • 25” – 50”
  • >50”

By Industry

  • Oil & Gas
  • Energy & Power
  • Water & Wastewater Treatment
  • Chemicals
  • Pharmaceuticals
  • Building & Construction
  • Food & Beverages
  • Metals & Mining
  • Pulp & Paper
  • Agriculture
  • Others

By Region

  • North America
    • US
    • Canada
    • Mexico
  • Europe
    • UK
    • Germany
    • France
    • Italy
    • Rest of Europe
  • Asia Pacific
    • China
    • Japan
    • India
    • South Korea
    • Rest of Asia Pacific
  • Rest of the World
    • GCC
    • Africa & Rest of Middle East
    • South America

Recent Developments:

  • In August 2023, KITZ Corporation has revealed its plans to streamline its Valve Manufacturing Business in Korea by consolidating manufacturing and sales facilities. This strategic move is geared towards improving sales support for Korean customers and fortifying the dependable global product supply chain by shifting a portion of KITZ's product manufacturing operations to Korea.
  • In March 2023, Flowserve Corporation, a leading global provider of flow control products and services, introduced the Worcester® 51/52 Series Reduced Port Flanged Ball Valves. These quarter-turn valves, designed for various industries, offer standardized design, materials, and certifications for global availability.
  • In November 2022, KITZ has released a new extension bonnet ball valve to enhance the low temperature ball valve series..

Frequently Asked Questions (FAQs) Addressed by the Report:

To speak to our analyst for a discussion on the above findings, click Speak to Analyst

TABLE OF CONTENTS
 
1 INTRODUCTION (Page No. - 31)
    1.1 STUDY OBJECTIVES 
    1.2 MARKET DEFINITION AND SCOPE 
           1.2.1 INCLUSIONS AND EXCLUSIONS
    1.3 STUDY SCOPE 
           1.3.1 MARKET SEGMENTATION
           1.3.2 REGIONAL SCOPE
           1.3.3 YEARS CONSIDERED
    1.4 CURRENCY CONSIDERED 
    1.5 UNITS CONSIDERED 
    1.6 LIMITATIONS 
    1.7 STAKEHOLDERS 
    1.8 SUMMARY OF CHANGES 
           1.8.1 IMPACT OF RECESSION
 
2 RESEARCH METHODOLOGY (Page No. - 36)
    2.1 RESEARCH DATA 
           FIGURE 1 BALL VALVES MARKET: RESEARCH DESIGN
           2.1.1 SECONDARY DATA
                    2.1.1.1 List of major secondary sources
                    2.1.1.2 Key data from secondary sources
           2.1.2 PRIMARY DATA
                    2.1.2.1 List of key interview participants
                    2.1.2.2 Breakdown of primary interviews
                    2.1.2.3 Key data from primary sources
           2.1.3 PRIMARY AND SECONDARY RESEARCH
                    2.1.3.1 Key industry insights
    2.2 MARKET SIZE ESTIMATION 
           FIGURE 2 MARKET SIZE ESTIMATION METHODOLOGY (SUPPLY SIDE): REVENUE GENERATED THROUGH SALES OF DIFFERENT TYPES OF BALL VALVES
           2.2.1 BOTTOM-UP APPROACH
                    2.2.1.1 Approach to arrive at market size using bottom-up analysis
                               FIGURE 3 MARKET SIZE ESTIMATION METHODOLOGY: BOTTOM-UP APPROACH
           2.2.2 TOP-DOWN APPROACH
                    2.2.2.1 Approach to arrive at market size using top-down analysis
                               FIGURE 4 MARKET SIZE ESTIMATION METHODOLOGY: TOP-DOWN APPROACH
    2.3 MARKET BREAKDOWN AND DATA TRIANGULATION 
           FIGURE 5 MARKET BREAKDOWN AND DATA TRIANGULATION
    2.4 RESEARCH ASSUMPTIONS 
           FIGURE 6 ASSUMPTIONS FOR RESEARCH STUDY
    2.5 APPROACH TO ESTIMATE RECESSION IMPACT 
    2.6 RISK ASSESSMENT 
           TABLE 1 LIMITATIONS AND ASSOCIATED RISKS
 
3 EXECUTIVE SUMMARY (Page No. - 47)
    FIGURE 7 STAINLESS STEEL BALL VALVES TO HOLD LARGEST MARKET SHARE IN 2028
    FIGURE 8 TRUNNION-MOUNTED BALL VALVES TO CAPTURE LARGEST MARKET SHARE IN 2028
    FIGURE 9 1−5” SEGMENT TO DOMINATE BALL VALVES MARKET THROUGHOUT FORECAST PERIOD
    FIGURE 10 OIL & GAS INDUSTRY TO ACCOUNT FOR LARGEST MARKET SHARE IN 2023
    FIGURE 11 NORTH AMERICA TO EXHIBIT HIGHEST CAGR IN MARKET DURING FORECAST PERIOD
 
4 PREMIUM INSIGHTS (Page No. - 51)
    4.1 ATTRACTIVE OPPORTUNITIES FOR PLAYERS IN BALL VALVES MARKET 
           FIGURE 12 INCREASING OIL AND GAS EXPLORATION ACTIVITIES IN ASIA PACIFIC TO PROVIDE LUCRATIVE OPPORTUNITIES
    4.2 MARKET, BY MATERIAL 
           FIGURE 13 STAINLESS STEEL SEGMENT TO RECORD HIGHEST CAGR DURING FORECAST PERIOD
    4.3 MARKET, BY TYPE 
           FIGURE 14 TRUNNION-MOUNTED SEGMENT TO HOLD LARGEST MARKET SHARE IN 2023
    4.4 MARKET, BY SIZE 
           FIGURE 15 1–5” SEGMENT TO HOLD LARGEST MARKET SHARE IN 2023
    4.5 MARKET, BY INDUSTRY 
           FIGURE 16 PULP & PAPER INDUSTRY TO REGISTER HIGHEST CAGR DURING FORECAST PERIOD
    4.6 MARKET, BY REGION 
           FIGURE 17 ASIA PACIFIC TO ACCOUNT FOR LARGEST SHARE OF BALL VALVES MARKET IN 2023
    4.7 BALL VALVES MARKET, BY COUNTRY 
           FIGURE 18 US AND INDIA TO BE LUCRATIVE MARKETS FOR BALL VALVES FROM 2023 TO 2028
 
5 MARKET OVERVIEW (Page No. - 55)
    5.1 INTRODUCTION 
    5.2 MARKET DYNAMICS 
           FIGURE 19 BALL VALVES MARKET: DRIVERS, RESTRAINTS, OPPORTUNITIES, AND CHALLENGES
           5.2.1 DRIVERS
                    5.2.1.1 Increasing need for replacement of outdated ball valves and adoption of smart valves
                    5.2.1.2 Rising focus on industrialization, urbanization, and smart city development
                    5.2.1.3 Pressing need to upgrade existing valves with increasing number of nuclear power plant projects
                               FIGURE 20 MARKET DRIVERS: IMPACT ANALYSIS
           5.2.2 RESTRAINTS
                    5.2.2.1 Lack of standardized norms and regulatory policies
                    5.2.2.2 High cost of raw materials
                               FIGURE 21 MARKET RESTRAINTS: IMPACT ANALYSIS
           5.2.3 OPPORTUNITIES
                    5.2.3.1 Utilization of IIoT and digital technologies in industrial plants
                    5.2.3.2 Adoption of 3D printing in valve manufacturing
                    5.2.3.3 Focus of industry players on offering improved customer services
                               FIGURE 22 BALL VALVES MARKET OPPORTUNITIES: IMPACT ANALYSIS
           5.2.4 CHALLENGES
                    5.2.4.1 Intense pricing pressure due to availability of local, low-priced valves
                    5.2.4.2 Rise in collaboration activities among industry players
                               FIGURE 23 MARKET CHALLENGES: IMPACT ANALYSIS
    5.3 VALUE CHAIN ANALYSIS 
           FIGURE 24 VALUE CHAIN ANALYSIS: BALL VALVES MARKET
    5.4 ECOSYSTEM ANALYSIS 
           FIGURE 25 BALL VALVES ECOSYSTEM
           TABLE 2 BALL VALVES MARKET: ECOSYSTEM
    5.5 PRICING ANALYSIS 
           FIGURE 26 AVERAGE SELLING PRICE OF BALL VALVES, 2022–2028
           5.5.1 AVERAGE SELLING PRICE TREND OF BALL VALVES PROVIDED BY KEY PLAYERS, BY TYPE
                    FIGURE 27 AVERAGE SELLING PRICE TREND OF BALL VALVE COMPONENTS OFFERED BY KEY PLAYERS
                    TABLE 3 AVERAGE SELLING PRICE OF BALL VALVE COMPONENTS OFFERED BY KEY PLAYERS (USD)
                    TABLE 4 AVERAGE SELLING PRICE OF OPTICS, BY REGION (USD)
    5.6 TRENDS/DISRUPTIONS IMPACTING CUSTOMER BUSINESS 
           FIGURE 28 TRENDS/DISRUPTIONS IMPACTING CUSTOMER BUSINESS
    5.7 TECHNOLOGY ANALYSIS 
           5.7.1 ARTIFICIAL INTELLIGENCE
           5.7.2 INDUSTRIAL INTERNET OF THINGS (IIOT)
           5.7.3 VALVE CONDITION MONITORING
    5.8 PORTER’S FIVE FORCES ANALYSIS 
           TABLE 5 PORTER’S FIVE FORCES ANALYSIS AND THEIR IMPACT (2022)
           FIGURE 29 BALL VALVES MARKET: PORTER’S FIVE FORCES ANALYSIS
           5.8.1 THREAT OF NEW ENTRANTS
           5.8.2 THREAT OF SUBSTITUTES
           5.8.3 BARGAINING POWER OF SUPPLIERS
           5.8.4 BARGAINING POWER OF BUYERS
           5.8.5 INTENSITY OF COMPETITIVE RIVALRY
    5.9 KEY STAKEHOLDERS AND BUYING CRITERIA 
           5.9.1 KEY STAKEHOLDERS IN BUYING PROCESS
                    FIGURE 30 INFLUENCE OF STAKEHOLDERS ON BUYING PROCESS FOR TOP THREE INDUSTRIES
                    TABLE 6 INFLUENCE OF STAKEHOLDERS ON BUYING PROCESS TOP THREE INDUSTRIES
           5.9.2 BUYING CRITERIA
                    FIGURE 31 KEY BUYING CRITERIA FOR TOP THREE INDUSTRIES
                    TABLE 7 KEY BUYING CRITERIA FOR TOP THREE INDUSTRIES
    5.10 CASE STUDY ANALYSIS 
           5.10.1 USE CASE 01: LADISH VALVES SECURED OFFERED SEVERE SERVICE BALL VALVES TO DEPLOY IN HIGH-TEMPERATURE AND -PRESSURE APPLICATIONS
           5.10.2 USE CASE 02: ROSELAND PUMPING STATION DEPLOYED VAL-MATIC VALVE & MFG. CORPORATION'S BALL VALVES TO ADDRESS WATER SYSTEM PROBLEMS
           5.10.3 USE CASE 03: HABONIM PROVIDED BIDIRECTIONAL CRYOGENIC FLOATING BALL VALVES FOR FIRST INLAND BUNKER PONTOON IN EUROPE
    5.11 TRADE ANALYSIS 
           FIGURE 32 IMPORT DATA FOR HS CODE 848110-COMPLIANT PRODUCTS, BY KEY COUNTRY, 2018–2022 (USD MILLION)
           FIGURE 33 EXPORT DATA FOR HS CODE 848110-COMPLIANT PRODUCTS, BY KEY COUNTRY, 2018–2022 (USD MILLION)
    5.12 PATENT ANALYSIS 
           FIGURE 34 TOP 10 COMPANIES WITH HIGHEST NUMBER OF PATENT APPLICATIONS IN LAST 10 YEARS
           FIGURE 35 NO. OF PATENTS GRANTED IN LAST 10 YEARS, 2013 TO 2022
           TABLE 8 TOP 20 PATENT OWNERS IN LAST 10 YEARS
           5.12.1 LIST OF MAJOR PATENTS
    5.13 KEY CONFERENCES AND EVENTS, 2023–2024 
           TABLE 9 BALL VALVES MARKET: LIST OF CONFERENCES AND EVENTS
    5.14 TARIFFS, REGULATIONS, AND STANDARDS 
           5.14.1 TARIFF FOR HS CODE 848110-COMPLIANT PRESSURE-REDUCING VALVES
                    TABLE 10 TARRIFF, BY COUNTRY
           5.14.2 REGULATORY BODIES, GOVERNMENT AGENCIES, AND OTHER ORGANIZATIONS
                    TABLE 11 NORTH AMERICA: LIST OF REGULATORY BODIES, GOVERNMENT AGENCIES, AND OTHER ORGANIZATIONS
                    TABLE 12 EUROPE: LIST OF REGULATORY BODIES, GOVERNMENT AGENCIES, AND OTHER ORGANIZATIONS
                    TABLE 13 ASIA PACIFIC: LIST OF REGULATORY BODIES, GOVERNMENT AGENCIES, AND OTHER ORGANIZATIONS
                    TABLE 14 ROW: LIST OF REGULATORY BODIES, GOVERNMENT AGENCIES, AND OTHER ORGANIZATIONS
    5.15 STANDARDS 
           TABLE 15 STANDARDS FOLLOWED BY MANUFACTURERS OF BALL VALVES
 
6 BALL VALVES MARKET, BY MATERIAL (Page No. - 87)
    6.1 INTRODUCTION 
           FIGURE 36 BALL VALVES MARKET, BY MATERIAL
           FIGURE 37 STAINLESS STEEL BALL VALVES TO HOLD LARGEST MARKET SIZE IN 2023
           TABLE 16 MARKET, BY MATERIAL, 2019–2022 (USD MILLION)
           TABLE 17 MARKET, BY MATERIAL, 2023–2028 (USD MILLION)
    6.2 STAINLESS STEEL 
           6.2.1 EXCEPTIONAL CORROSION RESISTANCE AND DURABILITY TO DRIVE MARKET
    6.3 CAST IRON 
           6.3.1 RISING ADOPTION IN WATER & WASTEWATER TREATMENT AND OIL & GAS INDUSTRIES TO FUEL MARKET GROWTH
    6.4 ALLOY-BASED 
           6.4.1 WIDE ADOPTION IN CHEMICAL, PHARMACEUTICAL, AND PULP & PAPER INDUSTRIES TO FOSTER MARKET GROWTH
    6.5 OTHERS 
           6.5.1 BRASS
           6.5.2 BRONZE
           6.5.3 PLASTIC
 
7 BALL VALVES MARKET, BY TYPE (Page No. - 93)
    7.1 INTRODUCTION 
           FIGURE 38 BALL VALVES MARKET, BY TYPE
           FIGURE 39 TRUNNION-MOUNTED BALL VALVES TO ACCOUNT FOR LARGEST MARKET SHARE IN 2023
           TABLE 18 MARKET, BY TYPE, 2019–2022 (USD MILLION)
           TABLE 19 MARKET, BY TYPE, 2023–2028 (USD MILLION)
    7.2 TRUNNION-MOUNTED 
           7.2.1 INCREASING USE IN HIGH-PRESSURE LOW-TORQUE OPERATIONS TO DRIVE MARKET
    7.3 FLOATING 
           7.3.1 RISING IMPLEMENTATION IN MEDIUM- /LOW-PRESSURE APPLICATIONS TO FUEL MARKET GROWTH
    7.4 RISING STEM 
           7.4.1 SURGING DEMAND FROM CHEMICAL INDUSTRY TO DRIVE MARKET
 
8 BALL VALVES MARKET, BY SIZE (Page No. - 97)
    8.1 INTRODUCTION 
           FIGURE 40 BALL VALVES MARKET, BY SIZE
           FIGURE 41 1−5” VALVES TO CAPTURE LARGEST MARKET SHARE IN 2023
           TABLE 20 MARKET, BY SIZE, 2019–2022 (USD MILLION)
           TABLE 21 MARKET, BY SIZE, 2023–2028 (USD MILLION)
           TABLE 22 MARKET, 2022-2028 (THOUSAND UNITS)
    8.2 <1” 
           8.2.1 GROWING DEPLOYMENT IN SMALL MANUFACTURING PLANTS TO DRIVE MARKET
    8.3 1−5” 
           8.3.1 INCREASING USE IN BUILDING & CONSTRUCTION AND OIL & GAS APPLICATIONS TO ACCELERATE MARKET GROWTH
    8.4 6–24" 
           8.4.1 RAPID ADOPTION IN HIGH-PRESSURE APPLICATIONS IN WATER & WASTEWATER INDUSTRY TO DRIVE MARKET
    8.5 25–50” 
           8.5.1 RISING IMPLEMENTATION IN HIGH-TEMPERATURE AND PRESSURE-HANDLING APPLICATIONS TO FUEL MARKET GROWTH
    8.6 >50” 
           8.6.1 GROWING UTILIZATION IN THERMAL POWER PLANTS TO STIMULATE MARKET GROWTH
 
9 BALL VALVES MARKET, BY INDUSTRY (Page No. - 102)
    9.1 INTRODUCTION 
           FIGURE 42 BALL VALVES MARKET, BY INDUSTRY
           FIGURE 43 OIL & GAS INDUSTRY TO HOLD LARGEST MARKET SHARE IN 2023
           TABLE 23 MARKET, BY INDUSTRY, 2019–2022 (USD MILLION)
           TABLE 24 MARKET, BY INDUSTRY, 2023–2028 (USD MILLION)
    9.2 OIL & GAS 
           9.2.1 INCREASING FOCUS OF OIL & GAS COMPANIES ON CAPACITY EXPANSION PROJECTS AND MRO CONTRACTS TO DRIVE MARKET
                    TABLE 25 OIL & GAS: MARKET, BY REGION, 2019–2022 (USD MILLION)
                    TABLE 26 OIL & GAS: MARKET, BY REGION, 2023–2028 (USD MILLION)
                    TABLE 27 OIL & GAS: MARKET IN NORTH AMERICA, BY COUNTRY, 2019–2022 (USD MILLION)
                    TABLE 28 OIL & GAS: MARKET IN NORTH AMERICA, BY COUNTRY, 2023–2028 (USD MILLION)
                    TABLE 29 OIL & GAS: MARKET IN EUROPE, BY COUNTRY, 2019–2022 (USD MILLION)
                    TABLE 30 OIL & GAS: MARKET IN EUROPE, BY COUNTRY, 2023–2028 (USD MILLION)
                    TABLE 31 OIL & GAS: MARKET IN ASIA PACIFIC, BY COUNTRY, 2019–2022 (USD MILLION)
                    TABLE 32 OIL & GAS: MARKET IN ASIA PACIFIC, BY COUNTRY, 2023–2028 (USD MILLION)
                    TABLE 33 OIL & GAS: MARKET IN ROW, BY REGION, 2019–2022 (USD MILLION)
                    TABLE 34 OIL & GAS: MARKET IN ROW, BY REGION, 2023–2028 (USD MILLION)
    9.3 ENERGY & POWER 
           9.3.1 RISING CONSTRUCTION OF NEW COAL-FIRED POWER PLANTS, GAS TURBINES, AND NUCLEAR POWER PLANTS TO DRIVE MARKET
                    TABLE 35 ENERGY & POWER: BALL VALVES MARKET, BY REGION, 2019–2022 (USD MILLION)
                    TABLE 36 ENERGY & POWER: MARKET, BY REGION, 2023–2028 (USD MILLION)
                    TABLE 37 ENERGY & POWER: MARKET IN NORTH AMERICA, BY COUNTRY, 2019–2022 (USD MILLION)
                    TABLE 38 ENERGY & POWER: MARKET IN NORTH AMERICA, BY COUNTRY, 2023–2028 (USD MILLION)
                    TABLE 39 ENERGY & POWER: MARKET IN EUROPE, BY COUNTRY, 2019–2022 (USD MILLION)
                    TABLE 40 ENERGY & POWER: MARKET IN EUROPE, BY COUNTRY, 2023–2028 (USD MILLION)
                    TABLE 41 ENERGY & POWER: MARKET IN ASIA PACIFIC, BY COUNTRY, 2019–2022 (USD MILLION)
                    TABLE 42 ENERGY & POWER: MARKET IN ASIA PACIFIC, BY COUNTRY, 2023–2028 (USD MILLION)
                    TABLE 43 ENERGY & POWER: MARKET IN ROW, BY REGION, 2019–2022 (USD MILLION)
                    TABLE 44 ENERGY & POWER: MARKET IN ROW, BY REGION, 2023–2028 (USD MILLION)
    9.4 WATER & WASTEWATER TREATMENT 
           9.4.1 URGENT NEED TO MODIFY OLDER WATER INFRASTRUCTURE TO AUGMENT DEMAND FOR BALL VALVES
                    TABLE 45 WATER & WASTEWATER TREATMENT: BALL VALVES MARKET, BY REGION, 2019–2022 (USD MILLION)
                    TABLE 46 WATER & WASTEWATER TREATMENT: MARKET, BY REGION, 2023–2028 (USD MILLION)
                    TABLE 47 WATER & WASTEWATER TREATMENT: MARKET IN NORTH AMERICA, BY COUNTRY, 2019–2022 (USD MILLION)
                    TABLE 48 WATER & WASTEWATER TREATMENT: MARKET IN NORTH AMERICA, BY COUNTRY, 2023–2028 (USD MILLION)
                    TABLE 49 WATER & WASTEWATER TREATMENT: MARKET IN EUROPE, BY COUNTRY, 2019–2022 (USD MILLION)
                    TABLE 50 WATER & WASTEWATER TREATMENT: MARKET IN EUROPE, BY COUNTRY, 2023–2028 (USD MILLION)
                    TABLE 51 WATER & WASTEWATER TREATMENT: MARKET IN ASIA PACIFIC, BY COUNTRY, 2019–2022 (USD MILLION)
                    TABLE 52 WATER & WASTEWATER TREATMENT: MARKET IN ASIA PACIFIC, BY COUNTRY, 2023–2028 (USD MILLION)
                    TABLE 53 WATER & WASTEWATER TREATMENT: MARKET IN ROW, BY REGION, 2019–2022 (USD MILLION)
                    TABLE 54 WATER & WASTEWATER TREATMENT: MARKET IN ROW, BY REGION, 2023–2028 (USD MILLION)
    9.5 CHEMICAL 
           9.5.1 SIGNIFICANT INCREASE IN CHEMICAL PRODUCTION TO FOSTER DEMAND
                    TABLE 55 CHEMICAL: BALL VALVES MARKET, BY REGION, 2019–2022 (USD MILLION)
                    TABLE 56 CHEMICAL: MARKET, BY REGION, 2023–2028 (USD MILLION)
                    TABLE 57 CHEMICAL: MARKET IN NORTH AMERICA, BY COUNTRY, 2019–2022 (USD MILLION)
                    TABLE 58 CHEMICAL: MARKET IN NORTH AMERICA, BY COUNTRY, 2023–2028 (USD MILLION)
                    TABLE 59 CHEMICAL: MARKET IN EUROPE, BY COUNTRY, 2019–2022 (USD MILLION)
                    TABLE 60 CHEMICAL: MARKET IN EUROPE, BY COUNTRY, 2023–2028 (USD MILLION)
                    TABLE 61 CHEMICAL: MARKET IN ASIA PACIFIC, BY COUNTRY, 2019–2022 (USD MILLION)
                    TABLE 62 CHEMICAL: MARKET IN ASIA PACIFIC, BY COUNTRY, 2023–2028 (USD MILLION)
                    TABLE 63 CHEMICAL: MARKET IN ROW, BY REGION, 2019–2022 (USD MILLION)
                    TABLE 64 CHEMICAL: MARKET IN ROW, BY REGION, 2023–2028 (USD MILLION)
    9.6 BUILDING & CONSTRUCTION 
           9.6.1 GROWING DEPLOYMENT OF HOT WATER AND SAFETY SYSTEMS IN NEW BUILDINGS TO BOOST DEMAND
                    TABLE 65 BUILDING & CONSTRUCTION: BALL VALVES MARKET, BY REGION, 2019–2022 (USD MILLION)
                    TABLE 66 BUILDING & CONSTRUCTION: MARKET, BY REGION, 2023–2028 (USD MILLION)
                    TABLE 67 BUILDING & CONSTRUCTION: MARKET IN NORTH AMERICA, BY COUNTRY, 2019–2022 (USD MILLION)
                    TABLE 68 BUILDING & CONSTRUCTION: MARKET IN NORTH AMERICA, BY COUNTRY, 2023–2028 (USD MILLION)
                    TABLE 69 BUILDING & CONSTRUCTION: MARKET IN EUROPE, BY COUNTRY, 2019–2022 (USD MILLION)
                    TABLE 70 BUILDING & CONSTRUCTION: MARKET IN EUROPE, BY COUNTRY, 2023–2028 (USD MILLION)
                    TABLE 71 BUILDING & CONSTRUCTION: MARKET IN ASIA PACIFIC, BY COUNTRY, 2019–2022 (USD MILLION)
                    TABLE 72 BUILDING & CONSTRUCTION: MARKET IN ASIA, BY COUNTRY, 2023–2028 (USD MILLION)
                    TABLE 73 BUILDING & CONSTRUCTION: MARKET IN ROW, BY REGION, 2019–2022 (USD MILLION)
                    TABLE 74 BUILDING & CONSTRUCTION: MARKET IN ROW, BY REGION, 2023–2028 (USD MILLION)
    9.7 PHARMACEUTICAL 
           9.7.1 BOOMING MARKET FOR PHARMACEUTICAL IN ASIA PACIFIC TO BOOST DEMAND
                    TABLE 75 PHARMACEUTICAL: BALL VALVES MARKET, BY REGION, 2019–2022 (USD MILLION)
                    TABLE 76 PHARMACEUTICAL: MARKET, BY REGION, 2023–2028 (USD MILLION)
                    TABLE 77 PHARMACEUTICAL: MARKET IN NORTH AMERICA, BY COUNTRY, 2019–2022 (USD MILLION)
                    TABLE 78 PHARMACEUTICAL: MARKET IN NORTH AMERICA, BY COUNTRY, 2023–2028 (USD MILLION)
                    TABLE 79 PHARMACEUTICAL: MARKET IN EUROPE, BY COUNTRY, 2019–2022 (USD MILLION)
                    TABLE 80 PHARMACEUTICAL: MARKET IN EUROPE, BY COUNTRY, 2023–2028 (USD MILLION)
                    TABLE 81 PHARMACEUTICAL: MARKET IN ASIA PACIFIC, BY COUNTRY, 2019–2022 (USD MILLION)
                    TABLE 82 PHARMACEUTICAL: MARKET IN ASIA PACIFIC, BY COUNTRY, 2023–2028 (USD MILLION)
                    TABLE 83 PHARMACEUTICAL: MARKET IN ROW, BY REGION, 2019–2022 (USD MILLION)
                    TABLE 84 PHARMACEUTICAL: MARKET IN ROW, BY REGION, 2023–2028 (USD MILLION)
    9.8 AGRICULTURE 
           9.8.1 EMPHASIS ON IMPROVING EFFICIENCY IN AGRICULTURE SECTOR TO ACCELERATE DEMAND
                    TABLE 85 AGRICULTURE: BALL VALVES MARKET, BY REGION, 2019–2022 (USD MILLION)
                    TABLE 86 AGRICULTURE: MARKET, BY REGION, 2023–2028 (USD MILLION)
                    TABLE 87 AGRICULTURE: MARKET IN NORTH AMERICA, BY COUNTRY, 2019–2022 (USD MILLION)
                    TABLE 88 AGRICULTURE: MARKET IN NORTH AMERICA, BY COUNTRY, 2023–2028 (USD MILLION)
                    TABLE 89 AGRICULTURE: MARKET IN EUROPE, BY COUNTRY, 2019–2022 (USD MILLION)
                    TABLE 90 AGRICULTURE: MARKET IN EUROPE, BY COUNTRY, 2023–2028 (USD MILLION)
                    TABLE 91 AGRICULTURE: ASIA PACIFIC BALL VALVES MARKET, BY COUNTRY, 2019–2022 (USD MILLION)
                    TABLE 92 AGRICULTURE: MARKET IN ASIA PACIFIC, BY COUNTRY, 2023–2028 (USD MILLION)
                    TABLE 93 AGRICULTURE: MARKET IN ROW, BY REGION, 2019–2022 (USD MILLION)
                    TABLE 94 AGRICULTURE: MARKET IN ROW, BY REGION, 2023–2028 (USD MILLION)
    9.9 METAL & MINING 
           9.9.1 GROWING DEMAND FOR PREDICTIVE MAINTENANCE TO ENCOURAGE USE OF BALL VALVES
                    TABLE 95 METAL & MINING: BALL VALVES MARKET, BY REGION, 2019–2022 (USD MILLION)
                    TABLE 96 METAL & MINING: MARKET, BY REGION, 2023–2028 (USD MILLION)
                    TABLE 97 METAL & MINING: MARKET IN NORTH AMERICA, BY COUNTRY, 2019–2022 (USD MILLION)
                    TABLE 98 METAL & MINING: MARKET IN NORTH AMERICA, BY COUNTRY, 2023–2028 (USD MILLION)
                    TABLE 99 METAL & MINING: MARKET IN EUROPE, BY COUNTRY, 2019–2022 (USD MILLION)
                    TABLE 100 METAL & MINING: MARKET IN EUROPE, BY COUNTRY, 2023–2028 (USD MILLION)
                    TABLE 101 METAL & MINING: MARKET IN ASIA PACIFIC, BY COUNTRY, 2019–2022 (USD MILLION)
                    TABLE 102 METAL & MINING: MARKET IN ASIA PACIFIC, BY COUNTRY, 2023–2028 (USD MILLION)
                    TABLE 103 METAL & MINING: MARKET IN ROW, BY REGION, 2019–2022 (USD MILLION)
                    TABLE 104 METAL & MINING: MARKET IN ROW, BY REGION, 2023–2028 (USD MILLION)
    9.10 PULP & PAPER 
           9.10.1 HIGH DEMAND FOR PACKAGING PAPER PRODUCTS TO DRIVE MARKET
                    TABLE 105 PULP & PAPER: BALL VALVES MARKET, BY REGION, 2019–2022 (USD MILLION)
                    TABLE 106 PULP & PAPER: MARKET, BY REGION, 2023–2028 (USD MILLION)
                    TABLE 107 PULP & PAPER: MARKET IN NORTH AMERICA, BY COUNTRY, 2019–2022 (USD MILLION)
                    TABLE 108 PULP & PAPER: MARKET IN NORTH AMERICA, BY COUNTRY, 2023–2028 (USD MILLION)
                    TABLE 109 PULP & PAPER: MARKET IN EUROPE, BY COUNTRY, 2019–2022 (USD MILLION)
                    TABLE 110 PULP & PAPER: MARKET IN EUROPE, BY COUNTRY, 2023–2028 (USD MILLION)
                    TABLE 111 PULP & PAPER: MARKET IN ASIA PACIFIC, BY COUNTRY, 2019–2022 (USD MILLION)
                    TABLE 112 PULP & PAPER: MARKET IN ASIA PACIFIC, BY COUNTRY, 2023–2028 (USD MILLION)
                    TABLE 113 PULP & PAPER: MARKET IN ROW, BY REGION, 2019–2022 (USD MILLION)
                    TABLE 114 PULP & PAPER: MARKET IN ROW, BY REGION, 2023–2028 (USD MILLION)
    9.11 FOOD & BEVERAGE 
           9.11.1 SANITATION, CONTAMINATION, AND PROCESS CONTROL CHALLENGES WITNESSED BY FOOD AND BEVERAGE COMPANIES TO BOOST DEMAND
                    TABLE 115 FOOD & BEVERAGE: BALL VALVES MARKET, BY REGION, 2019–2022 (USD MILLION)
                    TABLE 116 FOOD & BEVERAGE: MARKET, BY REGION, 2023–2028 (USD MILLION)
                    TABLE 117 FOOD & BEVERAGE: MARKET IN NORTH AMERICA, BY COUNTRY, 2019–2022 (USD MILLION)
                    TABLE 118 FOOD & BEVERAGE: MARKET IN NORTH AMERICA, BY COUNTRY, 2023–2028 (USD MILLION)
                    TABLE 119 FOOD & BEVERAGE: MARKET IN EUROPE, BY COUNTRY, 2019–2022 (USD MILLION)
                    TABLE 120 FOOD & BEVERAGE: MARKET IN EUROPE, BY COUNTRY, 2023–2028 (USD MILLION)
                    TABLE 121 FOOD & BEVERAGE: MARKET IN ASIA PACIFIC, BY COUNTRY, 2019–2022 (USD MILLION)
                    TABLE 122 FOOD & BEVERAGE: MARKET IN ASIA PACIFIC, BY COUNTRY, 2023–2028 (USD MILLION)
                    TABLE 123 FOOD & BEVERAGE: MARKET IN ROW, BY REGION, 2019–2022 (USD MILLION)
                    TABLE 124 FOOD & BEVERAGE: MARKET IN ROW, BY REGION, 2023–2028 (USD MILLION)
    9.12 OTHERS 
           TABLE 125 OTHERS: BALL VALVES MARKET, BY REGION, 2019–2022 (USD MILLION)
           TABLE 126 OTHERS: MARKET, BY REGION, 2023–2028 (USD MILLION)
           TABLE 127 OTHERS: MARKET IN NORTH AMERICA, BY COUNTRY, 2019–2022 (USD MILLION)
           TABLE 128 OTHERS: MARKET IN NORTH AMERICA, BY COUNTRY, 2023–2028 (USD MILLION)
           TABLE 129 OTHERS: MARKET IN EUROPE, BY COUNTRY, 2019–2022 (USD MILLION)
           TABLE 130 OTHERS: MARKET IN EUROPE, BY COUNTRY, 2023–2028 (USD MILLION)
           TABLE 131 OTHERS: MARKET IN ASIA PACIFIC, BY COUNTRY, 2019–2022 (USD MILLION)
           TABLE 132 OTHERS: MARKET IN ASIA PACIFIC, BY COUNTRY, 2023–2028 (USD MILLION)
           TABLE 133 OTHERS: MARKET IN ROW, BY REGION, 2019–2022 (USD MILLION)
           TABLE 134 OTHERS: MARKET IN ROW, BY REGION, 2023–2028 (USD MILLION)
 
10 BALL VALVES MARKET, BY REGION (Page No. - 146)
     10.1 INTRODUCTION 
             TABLE 135 BALL VALVES MARKET, BY REGION, 2019–2022 (USD MILLION)
             TABLE 136 MARKET, BY REGION, 2023–2028 (USD MILLION)
             FIGURE 44 ASIA PACIFIC TO CAPTURE LARGEST MARKET SHARE IN 2023
     10.2 NORTH AMERICA 
             FIGURE 45 NORTH AMERICA: BALL VALVES MARKET SNAPSHOT
             TABLE 137 NORTH AMERICA: MARKET, BY COUNTRY, 2019–2022 (USD MILLION)
             TABLE 138 NORTH AMERICA: MARKET, BY COUNTRY, 2023–2028 (USD MILLION)
             TABLE 139 NORTH AMERICA: MARKET, BY INDUSTRY, 2019–2022 (USD MILLION)
             TABLE 140 NORTH AMERICA: MARKET, BY INDUSTRY, 2023–2028 (USD MILLION)
             10.2.1 IMPACT OF RECESSION ON MARKET IN NORTH AMERICA
             10.2.2 US
                        10.2.2.1 Massive investments in oil & gas industry to drive market
             10.2.3 CANADA
                        10.2.3.1 Rising energy demand to augment market growth
             10.2.4 MEXICO
                        10.2.4.1 Growing focus on expansion of industrial plants to boost demand
     10.3 EUROPE 
             FIGURE 46 EUROPE: BALL VALVES MARKET SNAPSHOT
             TABLE 141 EUROPE: MARKET, BY COUNTRY, 2019–2022 (USD MILLION)
             TABLE 142 EUROPE: MARKET, BY COUNTRY, 2023–2028 (USD MILLION)
             TABLE 143 EUROPE: MARKET, BY INDUSTRY, 2019–2022 (USD MILLION)
             TABLE 144 EUROPE: MARKET, BY INDUSTRY, 2023–2028 (USD MILLION)
             10.3.1 IMPACT OF RECESSION ON MARKET IN EUROPE
             10.3.2 UK
                        10.3.2.1 Water & wastewater treatment industry to contribute to market growth
             10.3.3 GERMANY
                        10.3.3.1 Significant demand from chemical and energy & power industries to support market growth
             10.3.4 FRANCE
                        10.3.4.1 Investments in power generation technologies to fuel market growth
             10.3.5 ITALY
                        10.3.5.1 Growing use of ball valves in desalination and wastewater treatment to drive market
             10.3.6 REST OF EUROPE
     10.4 ASIA PACIFIC 
             FIGURE 47 ASIA PACIFIC: BALL VALVES MARKET SNAPSHOT
             TABLE 145 ASIA PACIFIC: MARKET, BY COUNTRY, 2019–2022 (USD MILLION)
             TABLE 146 ASIA PACIFIC: MARKET, BY COUNTRY, 2023–2028 (USD MILLION)
             TABLE 147 ASIA PACIFIC: MARKET, BY INDUSTRY, 2019–2022 (USD MILLION)
             TABLE 148 ASIA PACIFIC: MARKET, BY INDUSTRY, 2023–2028 (USD MILLION)
             10.4.1 IMPACT OF RECESSION ON MARKET IN ASIA PACIFIC
             10.4.2 CHINA
                        10.4.2.1 Significant presence of leading and mid-sized valve manufacturing firms to contribute to market growth
             10.4.3 JAPAN
                        10.4.3.1 Strong focus on personnel safety to boost demand
             10.4.4 INDIA
                        10.4.4.1 Thriving power industry to support market growth
             10.4.5 SOUTH KOREA
                        10.4.5.1 Flourishing semiconductor and chemical industry to support market
             10.4.6 REST OF ASIA PACIFIC
     10.5 ROW 
             TABLE 149 ROW: BALL VALVES MARKET, BY REGION, 2019–2022 (USD MILLION)
             TABLE 150 ROW: BALL VALVES MARKET, BY REGION, 2023–2028 (USD MILLION)
             TABLE 151 GCC COUNTRIES: MARKET, BY COUNTRY, 2019–2022 (USD MILLION)
             TABLE 152 GCC COUNTRIES: MARKET, BY COUNTRY, 2023–2028 (USD MILLION)
             TABLE 153 ROW: BALL VALVES MARKET, BY INDUSTRY, 2019–2022 (USD MILLION)
             TABLE 154 ROW: BALL VALVES MARKET, BY INDUSTRY, 2023–2028 (USD MILLION)
             10.5.1 IMPACT OF RECESSION ON MARKET IN ROW
             10.5.2 GCC COUNTRIES
                        10.5.2.1 Heightened demand in water management applications to drive market
             10.5.3 AFRICA & REST OF MIDDLE EAST
                        10.5.3.1 Government investments and water management initiatives to drive market
             10.5.4 SOUTH AMERICA
                        10.5.4.1 Emergence of region as manufacturing hub to facilitate demand
 
11 COMPETITIVE LANDSCAPE (Page No. - 165)
     11.1 KEY PLAYER STRATEGIES/RIGHT TO WIN 
             TABLE 155 KEY DEVELOPMENTS IN BALL VALVES MARKET, 2021–2023
     11.2 REVENUE ANALYSIS OF TOP FIVE COMPANIES 
             FIGURE 48 BALL VALVES MARKET: REVENUE ANALYSIS, 2022
     11.3 MARKET SHARE ANALYSIS OF TOP FIVE PLAYERS, 2022 
             TABLE 156 BALL VALVES MARKET: DEGREE OF COMPETITION
             FIGURE 49 BALL VALVES MARKET: MARKET SHARE ANALYSIS, 2022
     11.4 COMPANY EVALUATION MATRIX, 2022 
             11.4.1 STARS
             11.4.2 EMERGING LEADERS
             11.4.3 PERVASIVE PLAYERS
             11.4.4 PARTICIPANTS
                        FIGURE 50 BALL VALVES MARKET (GLOBAL): COMPANY EVALUATION MATRIX, 2022
             11.4.5 COMPANY FOOTPRINT
                        TABLE 157 COMPANY TYPE FOOTPRINT
                        TABLE 158 COMPANY INDUSTRY FOOTPRINT
                        TABLE 159 COMPANY REGION FOOTPRINT
                        TABLE 160 COMPANY FOOTPRINT
     11.5 SMALL AND MEDIUM-SIZED ENTERPRISES (SMES) EVALUATION MATRIX, 2022 
             11.5.1 PROGRESSIVE COMPANIES
             11.5.2 RESPONSIVE COMPANIES
             11.5.3 DYNAMIC COMPANIES
             11.5.4 STARTING BLOCKS
                        FIGURE 51 BALL VALVES MARKET (GLOBAL): SME EVALUATION MATRIX, 2022
             11.5.5 COMPETITIVE BENCHMARKING
                        TABLE 161 DETAILED LIST OF KEY STARTUPS/SMES
                        TABLE 162 COMPETITIVE BENCHMARKING OF KEY STARTUPS/SMES
     11.6 COMPETITIVE SCENARIO AND TRENDS 
             11.6.1 PRODUCT LAUNCHES
                        TABLE 163 BALL VALVES MARKET: PRODUCT LAUNCHES AND DEVELOPMENTS
             11.6.2 DEALS
                        TABLE 164 BALL VALVES MARKET: DEALS
             11.6.3 OTHER DEVELOPMENTS
                        TABLE 165 BALL VALVES MARKET: OTHER DEVELOPMENTS
 
12 COMPANY PROFILES (Page No. - 183)
(Business Overview, Products Offered, Recent Developments, and MnM View (Key strengths/Right to Win, Strategic Choices Made, and Weaknesses and Competitive Threats))*  
     12.1 KEY PLAYERS 
             12.1.1 EMERSON ELECTRIC CO.
                        TABLE 166 EMERSON ELECTRIC CO.: COMPANY OVERVIEW
                        FIGURE 52 EMERSON ELECTRIC CO.: COMPANY SNAPSHOT
                        TABLE 167 EMERSON ELECTRIC CO.: PRODUCTS OFFERED
                        TABLE 168 EMERSON ELECTRIC CO.: PRODUCT LAUNCHES AND DEVELOPMENTS
                        TABLE 169 EMERSON ELECTRIC CO.: DEALS
             12.1.2 FLOWSERVE CORPORATION
                        TABLE 170 FLOWSERVE CORPORATION: COMPANY OVERVIEW
                        FIGURE 53 FLOWSERVE CORPORATION: COMPANY SNAPSHOT
                        TABLE 171 FLOWSERVE CORPORATION: PRODUCTS OFFERED
                        TABLE 172 FLOWSERVE CORPORATION: PRODUCT LAUNCHES AND DEVELOPMENTS
                        TABLE 173 FLOWSERVE CORPORATION: DEALS
             12.1.3 SLB
                        TABLE 174 SLB: COMPANY OVERVIEW
                        FIGURE 54 SLB: COMPANY SNAPSHOT
                        TABLE 175 SLB: PRODUCTS OFFERED
                        TABLE 176 SLB: PRODUCT LAUNCHES AND DEVELOPMENTS
             12.1.4 IMI CRITICAL ENGINEERING
                        TABLE 177 IMI CRITICAL ENGINEERING: COMPANY OVERVIEW
                        FIGURE 55 IMI CRITICAL ENGINEERING: COMPANY SNAPSHOT
                        TABLE 178 IMI CRITICAL ENGINEERING: PRODUCTS OFFERED
                        TABLE 179 IMI CRITICAL ENGINEERING: PRODUCT LAUNCHES AND DEVELOPMENTS
                        TABLE 180 IMI CRITICAL ENGINEERING: OTHERS
             12.1.5 VALMET
                        TABLE 181 VALMET: COMPANY OVERVIEW
                        FIGURE 56 VALMET: COMPANY SNAPSHOT
                        TABLE 182 VALMET: PRODUCTS OFFERED
                        TABLE 183 VALMET: PRODUCT LAUNCHES AND DEVELOPMENTS
                        TABLE 184 VALMET: DEALS
             12.1.6 CRANE COMPANY
                        TABLE 185 CRANE COMPANY: COMPANY OVERVIEW
                        FIGURE 57 CRANE COMPANY: COMPANY SNAPSHOT
                        TABLE 186 CRANE COMPANY: PRODUCTS OFFERED
                        TABLE 187 CRANE COMPANY: PRODUCT LAUNCHES AND DEVELOPMENTS
                        TABLE 188 CRANE COMPANY: OTHERS
             12.1.7 KITZ CORPORATION
                        TABLE 189 KITZ CORPORATION: COMPANY OVERVIEW
                        FIGURE 58 KITZ CORPORATION: COMPANY SNAPSHOT
                        TABLE 190 KITZ CORPORATION: PRODUCTS OFFERED
                        TABLE 191 KITZ CORPORATION: PRODUCT LAUNCHES AND DEVELOPMENTS
                        TABLE 192 KITZ CORPORATION: OTHERS
             12.1.8 NEWAY VALVE
                        TABLE 193 NEWAY VALVE: COMPANY OVERVIEW
                        TABLE 194 NEWAY VALVE: PRODUCTS OFFERED
                        TABLE 195 NEWAY VALVE: OTHERS
             12.1.9 SPIRAX SARCO LIMITED
                        TABLE 196 SPIRAX SARCO LIMITED: COMPANY OVERVIEW
                        FIGURE 59 SPIRAX SARCO LIMITED: COMPANY SNAPSHOT
                        TABLE 197 SPIRAX SARCO LIMITED: PRODUCTS OFFERED
             12.1.10 TRILLIUM FLOW TECHNOLOGIES
                        TABLE 198 TRILLIUM FLOW TECHNOLOGIES: COMPANY OVERVIEW
                        TABLE 199 TRILLIUM FLOW TECHNOLOGIES: PRODUCTS OFFERED
     12.2 OTHER KEY PLAYERS 
             12.2.1 ALFA LAVAL
                        TABLE 200 ALFA LAVAL: COMPANY OVERVIEW
             12.2.2 PARKER HANNIFIN CORP
                        TABLE 201 PARKER HANNIFIN CORP: COMPANY OVERVIEW
             12.2.3 BRAY INTERNATIONAL
                        TABLE 202 BRAY INTERNATIONAL: COMPANY OVERVIEW
             12.2.4 XYLEM
                        TABLE 203 XYLEM: COMPANY OVERVIEW
             12.2.5 HAM-LET GROUP
                        TABLE 204 HAM-LET GROUP: COMPANY OVERVIEW
     12.3 STARTUPS AND SMES 
             12.3.1 APOLLO INDIA VALVES
                        TABLE 205 APOLLO INDIA VALVES: COMPANY OVERVIEW
             12.3.2 AVCON CONTROLS PVT. LTD.
                        TABLE 206 AVCON CONTROLS PVT. LTD.: COMPANY OVERVIEW
             12.3.3 AVK HOLDING A/S
                        TABLE 207 AVK HOLDING A/S: COMPANY OVERVIEW
             12.3.4 DWYER INSTRUMENTS LTD.
                        TABLE 208 DWYER INSTRUMENTS LTD.: COMPANY OVERVIEW
             12.3.5 FORBES MARSHALL
                        TABLE 209 FORBES MARSHALL: COMPANY OVERVIEW
             12.3.6 KLINGER HOLDING
                        TABLE 210 KLINGER HOLDING: COMPANY OVERVIEW
             12.3.7 POWELL VALVES
                        TABLE 211 POWELL VALVES: COMPANY OVERVIEW
             12.3.8 SAMSON AKTIENGESELLSCHAFT
                        TABLE 212 SAMSON AKTIENGESELLSCHAFT: COMPANY OVERVIEW
             12.3.9 SWAGELOK COMPANY
                        TABLE 213 SWAGELOK COMPANY: COMPANY OVERVIEW
             12.3.10 XHVAL VALVE CO., LTD.
                        TABLE 214 XHVAL VALVE CO., LTD.: COMPANY OVERVIEW
*Details on Business Overview, Products Offered, Recent Developments, and MnM View (Key strengths/Right to Win, Strategic Choices Made, and Weaknesses and Competitive Threats) might not be captured in case of unlisted companies.  
 
13 ADJACENT AND RELATED MARKETS (Page No. - 229)
     13.1 INTRODUCTION 
     13.2 LIMITATIONS 
     13.3 INDUSTRIAL VALVES MARKET, BY COMPONENT 
             13.3.1 INTRODUCTION
                        TABLE 215 INDUSTRIAL VALVES MARKET, BY COMPONENT, 2019–2022 (USD MILLION)
                        TABLE 216 INDUSTRIAL VALVES MARKET, BY COMPONENT, 2023–2028 (USD MILLION)
     13.4 ACTUATORS 
             13.4.1 PNEUMATIC ACTUATORS
                        13.4.1.1 Diaphragm actuators
                                     13.4.1.1.1 Growing use in control valves to boost segmental growth
                        13.4.1.2 Piston actuators
                                     13.4.1.2.1 Increasing demand for butterfly valves from food, chemical, and pharmaceutical companies to drive market
             13.4.2 ELECTRIC ACTUATORS
                        13.4.2.1 Wide use in water & wastewater treatment and chemical plants to boost segmental growth
             13.4.3 HYDRAULIC ACTUATORS
                        13.4.3.1 Rising deployment of HVAC, fire protection, and irrigation systems to boost demand
                                     TABLE 217 ACTUATORS: INDUSTRIAL VALVES MARKET, BY TYPE, 2019–2022 (USD MILLION)
                                     TABLE 218 ACTUATORS: INDUSTRIAL VALVES MARKET, BY TYPE, 2023–2028 (USD MILLION)
     13.5 VALVE BODY 
             13.5.1 RISING DEMAND FOR VALVE BODIES FEATURING HIGH CORROSION RESISTANCE AND BETTER CHEMICAL COMPATIBILITY TO SUPPORT SEGMENTAL GROWTH
     13.6 OTHER COMPONENTS 
 
14 APPENDIX (Page No. - 233)
     14.1 INSIGHTS FROM INDUSTRY EXPERTS 
     14.2 DISCUSSION GUIDE 
     14.3 KNOWLEDGESTORE: MARKETSANDMARKETS’ SUBSCRIPTION PORTAL 
     14.4 CUSTOMIZATION OPTIONS 
     14.5 RELATED REPORTS 
     14.6 AUTHOR DETAILS 


The study involves four significant activities for estimating the size of the Ball valves market. Exhaustive secondary research has been conducted to collect information related to the market. The next step is to validate these findings and assumptions related to the market size with industry experts across the value chain through primary research. Both top-down and bottom-up approaches have been employed to estimate the overall size of the Ball valves market. After that, market breakdown and data triangulation procedures were used to determine the extent of different segments and subsegments of the market.

Secondary Research

Secondary sources for this research study included corporate filings (such as annual reports, investor presentations, and financial statements); trade, business, and professional associations; white papers; certified publications, articles by recognized authors; directories; and databases. The secondary data has been collected and analyzed to determine the overall market size, further validated through primary research.

Primary Research

Extensive primary research has been conducted after gaining knowledge about the current scenario of the Ball valves market through secondary research. Several primary interviews have been conducted with experts from the demand and supply sides across four major regions—North America, Europe, Asia Pacific, and RoW. This primary data has been collected through questionnaires, emails, and telephonic interviews.

Ball Valves Market Size, and Share

To know about the assumptions considered for the study, download the pdf brochure

Market Size Estimation

In the complete market engineering process, top-down and bottom-up approaches and several data triangulation methods have been implemented to estimate and validate the size of the Ball valves market and other dependent submarkets listed in this report.

  • The key players in the industry and markets have been identified through extensive secondary research.
  • The supply chain of the industry and the market size, in terms of value, have been determined through primary and secondary research.
  • All percentage shares, splits, and breakdowns have been determined using secondary sources and verified through primary sources.

Ball valves Market: Top-Down Approach

  • In the top-down approach, the overall market size has been used to estimate the size of the individual markets (mentioned in the market segmentation) through percentage splits obtained from secondary and primary research.
  •  For calculating the Ball valves market segments, the market size obtained by implementing the bottom-up approach has been used to implement the top-down approach, which was later confirmed with the primary respondents across different regions.
  • The bottom-up approach has also been implemented for the data extracted from secondary research to validate the market size of various segments.
  • Each company’s market share has been estimated to verify the revenue shares used earlier in the bottom-up approach. With the help of data triangulation and validation of data through primaries, the size of the overall Ball valves and each market have been determined and confirmed in this study.

Ball Valves Market Size, and Top-Down Approach

Data Triangulation

After arriving at the overall market size, the total market has been split into several segments. The market breakdown and data triangulation procedures have been employed wherever applicable to complete the overall market engineering process and arrive at exact statistics for all segments. The data was then triangulated by studying various factors and trends from both the demand and supply sides. The market has also been validated using both top-down and bottom-up approaches.

Market Definition

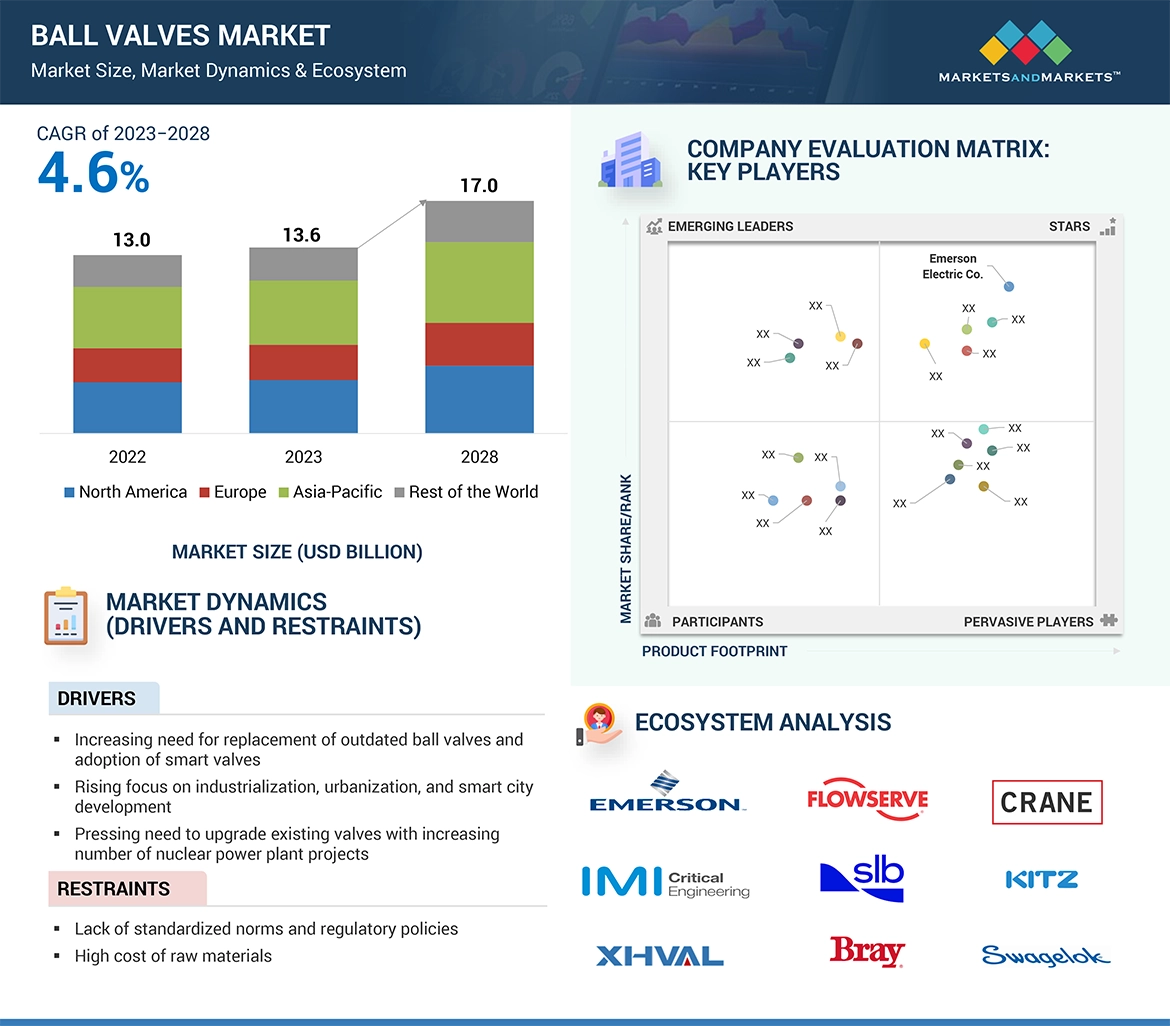
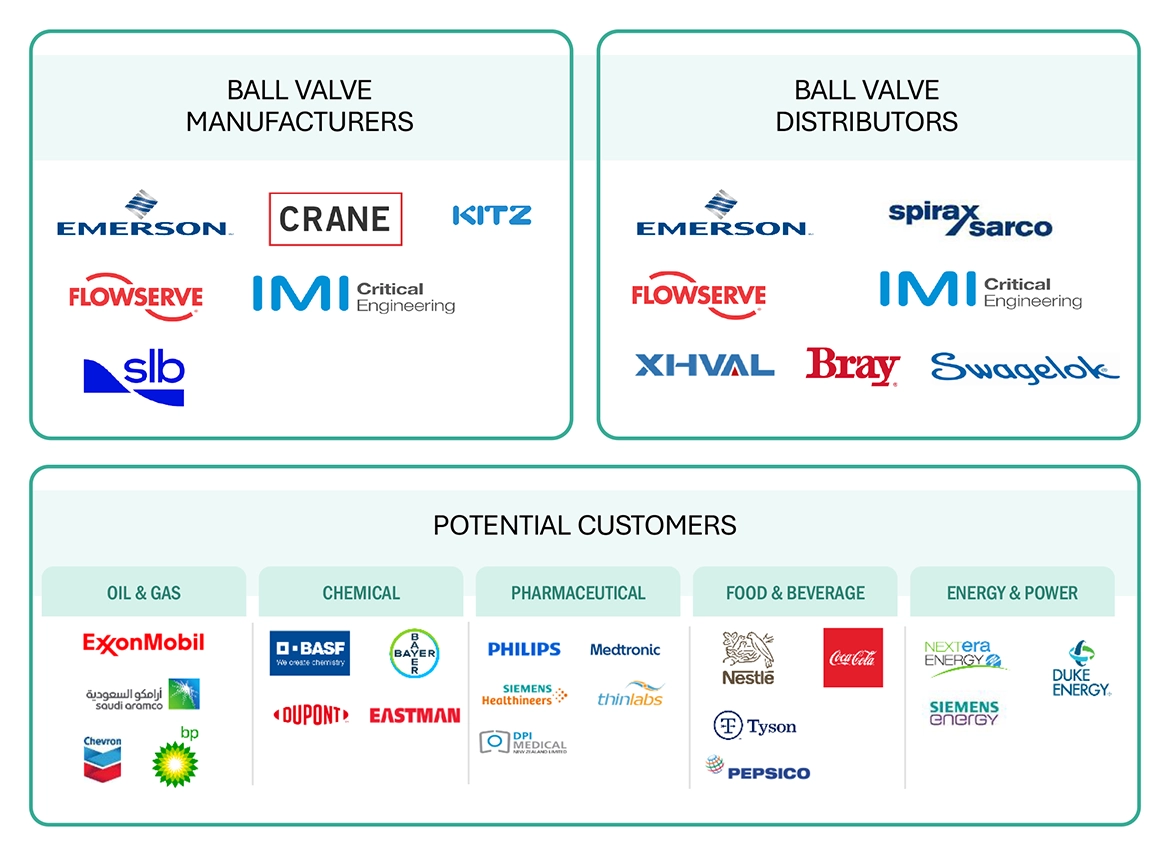
A valve is a mechanical device that regulates the flow of liquid or gas in a process stream. Ball valves are quarter-turn, straight-through valves and have a round closure element with matching rounded seats that permit uniform sealing stress. Ball valves are widely used in oil & gas, chemical, pharmaceutical, metal & mining, energy & power, and other industries for tight shutoff situations. Ball valves can be opened and closed quickly with a low-pressure drop, providing reliable leak protection, which is useful in gas applications. The major players of Ball Valves market includes Emerson Electric Co. (US), Flowserve Corporation (US), SLB (US), IMI (UK), Valmet (Finland), Crane Company (US), KITZ Corporation (Japan), Neway Valves Co. Ltd. (China), Spirax Sarco Limited (UK), Trillium Flow Technologies (US)..

Key Stakeholders

  • Original equipment manufacturers (OEMs)
  • Providers of technology solutions
  • Research institutes
  • Market research and consulting firms
  • Forums, alliances, and associations related to Ball valves
  • Technology investors
  • Governments and financial institutions
  • Analysts and strategic business planners
  • Existing end users and prospective ones

Report Objectives:

  • To describe and forecast the Ball valves market in terms of value based on Material, Type, Size, and Industry
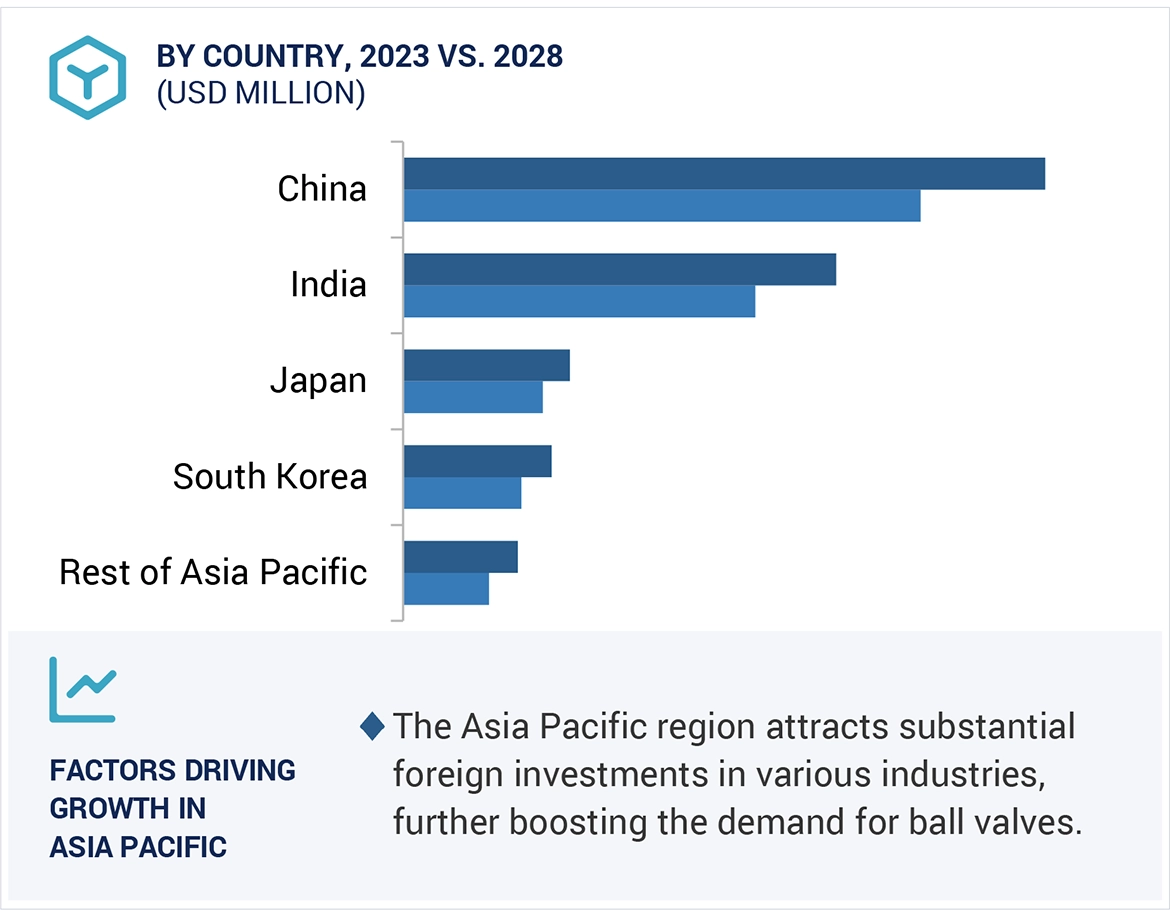
  • To describe and forecast the Ball valves market size in terms of value for four main regions, namely, North America, Europe, Asia Pacific, and the Rest of the World (RoW)
  • To provide detailed information regarding the drivers, restraints, opportunities, and challenges influencing the growth of the Ball valves market
  • To provide a detailed overview of the supply chain of the ecosystem
  • To analyze opportunities in the market for various stakeholders by identifying the high-growth segments of the market
  • To analyze the probable impact of the recession on the market in the future
  • To benchmark the market players using the proprietary company evaluation matrix framework, which analyzes the market players on various parameters within the broad categories of market ranking/share and product portfolio.
  • To analyze competitive developments such as acquisitions, product launches, partnerships, expansions, and collaborations undertaken in the Ball valves market

Available Customization:

With the given market data, MarketsandMarkets offers customizations according to the company’s specific needs. The following customization options are available for this report:

  • Company Information: Detailed analysis and profiling of additional five market players
Custom Market Research Services

We will customize the research for you, in case the report listed above does not meet with your exact requirements. Our custom research will comprehensively cover the business information you require to help you arrive at strategic and profitable business decisions.

Request Customization

Instant Answers with GPT - Ask Now!

Ask real questions. Get complete answers !
Report Code
SE 5368
Published ON
Dec, 2023
Choose License Type
BUY NOW
  • SHARE
X
Request Customization
Speak to Analyst
Speak to Analyst
OR FACE-TO-FACE MEETING
PERSONALIZE THIS RESEARCH
  • Triangulate with your Own Data
  • Get Data as per your Format and Definition
  • Gain a Deeper Dive on a Specific Application, Geography, Customer or Competitor
  • Any level of Personalization
REQUEST A FREE CUSTOMIZATION
LET US HELP YOU!
  • What are the Known and Unknown Adjacencies Impacting the Ball Valves Market
  • What will your New Revenue Sources be?
  • Who will be your Top Customer; what will make them switch?
  • Defend your Market Share or Win Competitors
  • Get a Scorecard for Target Partners
CUSTOMIZED WORKSHOP REQUEST
+1-888-600-6441
  • Call Us
  • +1-888-600-6441 (Corporate office hours)
  • +1-888-600-6441 (US/Can toll free)
  • +44-800-368-9399 (UK office hours)
CONNECT WITH US
ABOUT TRUST ONLINE
©2024 MarketsandMarkets Research Private Ltd. All rights reserved
DMCA.com Protection Status Website Feedback