Farm Management Software Market

Farm Management Software Market by Application (Precision Farming, Livestock, Aquaculture, Forestry, Smart Greenhouses), Offering (On-cloud, On-premise, Data Analytics Services), Farm Size, Farm Production and Region - Global Forecast to 2029

Report Code: SE 4449 Apr, 2024, by marketsandmarkets.com

[294 Pages Report] The Farm Management Software Market is projected to reach from USD 3.4 billion in 2024 to USD 5.8 billion by 2029; it is expected to grow at a CAGR of 11.0% from 2024 to 2029. The widespread adoption of farm management software can indeed be attributed to a multitude of factors that collectively enhance farm management practices and agricultural sustainability. One of the key factor is the efficiency and productivity afforded by these software solutions, which streamline tasks such as data collection, analysis, and decision-making.

Farm Management Software Market

Farm Management Software Market

Farm Management Software Market Forecast to 2029

To know about the assumptions considered for the study, Request for Free Sample Report

Farm Management Software Market Dynamics

Driver: Rising integration of advanced technologies for real-time farm management

The expansion of the farm management software market is primarily propelled by the escalating agricultural operations and the increasing demand for instant data for informed decision-making. Artificial intelligence and machine learning are becoming extensive technologies across various farming sectors, including precision farming, livestock monitoring, fish farming, and smart greenhouse practices. These technologies facilitate the seamless exchange of data between farming equipment and stakeholders, streamlining the farm management process. Within the farm management framework, there is a significant emphasis on comprehending the environment by analyzing data generated by diverse farm management tools like GPS, satellite imaging, and in-field sensors. Data management holds immense importance in agriculture, as management decisions rely on real-time data analysis derived from farm activities. The integration of artificial intelligence and machine learning has enabled prompt access to data, simplifying tasks such as planning, procurement, feeding, harvesting, marketing, and inventory control.

Restraint: Limited technical expertise and advanced infrastructure in developing regions

The growth of the farm management software market faces challenges as some farmers encounter difficulties in grasping the process of utilizing such software, handling agricultural data, and leveraging it for decision-making, thereby impeding market expansion. Farm management software solutions are crucial for conducting real-time data analysis of diverse farming activities with the aim of boosting profits and mitigating losses. However, utilizing these solutions in agricultural management necessitates technical expertise.

Opportunity: Rapid adoption of smart farming technologies

Smart farming relies on extensive data collected from sensors, drones, and IoT devices. Farm management software serves as a central platform, consolidating this data with traditional farming operations data like planting schedules and inventory. This integrated perspective enables farmers to base their decisions on data, guiding resource allocation, irrigation plans, and pest management strategies. The embrace of smart farming technologies represents a valuable chance for farm management software to transform into a comprehensive farm management information system. Through data integration, advanced analytics, and automation capabilities, this software empowers farmers to enhance decision-making, resource utilization, and overall efficiency and profitability. Artificial intelligence (AI) emerges as a promising technology to meet the ongoing food demand in agriculture by boosting production. AI solutions enhance the efficiency of agricultural operations by offering valuable insights. By combining IoT with advanced analytics facilitated by AI, farmers can analyze real-time data concerning weather conditions, temperatures, moisture levels, and crop prices in the market.

Challenge: Management of data for productive decision-making through single digital platform

The integration of various data sources like weather forecasts, soil health assessments, crop growth tracking, and machinery performance data into one platform can present challenges due to variations in data formats and compatibility issues. Managing data from various farm activities poses a significant challenge to the expansion of the farm management software market. Farm management software solutions generate a substantial volume of data regularly, which is crucial for informed decision-making by farmers. This data, collected from agricultural tools used on farms, is essential for tasks such as mapping, variable rate seeding, soil testing, yield monitoring, and historical crop rotation. To utilize this data effectively, it must be appropriately stored and managed in a structured format. After collection, the raw data undergoes processing to provide farmers with context, relevance, and priority, facilitating decision-making. The adoption of farm management software and related technologies is likely to increase if farmers are offered user-friendly data management solutions for their daily operations. Many farmers lack awareness of the potential of data for decision-making purposes. Therefore, it is important to provide farmers and growers with effective data management tools and techniques to acquire, manage, process, and utilize data efficiently.

Farm Management Software Market Ecosystem

The prominent players in the farm management software market are AGRIVI (UK), Trimble Inc. (US), Granular Inc. (US), Raven Industries, Inc. (US), TOPCON CORPORATION (Japan). These companies have been operating in the market for several years and possess a diversified product portfolio, state-of-the-art technologies, and strong global sales and marketing networks.

Farm Management Software Market by Ecosystem

On-cloud offering to account for the largest share of the farm management software market in 2023.

Cloud-based farm management software contributes to sustainable farming practices by optimizing resource utilization, minimizing water and chemical usage through precise irrigation and targeted pest control, and reducing environmental impact. The increasing demand for cloud-based farm management software stems from its capacity to optimize resource allocation, facilitate remote monitoring and automation, streamline inventory and supply chain operations, and promote sustainable farming practices. Consequently, this enhances farm productivity and profitability.

Large farm size segment to dominate farm management software market during the forecast period.

Several factors are propelling the growth of large-scale farms and the adoption of farm management software, including the increasing prominence of precision farming, efficient resource management, technological advancements, government support, rising demand for protein-rich aqua food, labor shortages coupled with an aging population, and a heightened emphasis on sustainable farming practices.

Precision farming application to register the highest share farm management software market in 2023.

The farm management software market is expected to grow at a significant rate, driven by the adoption of new advanced technologies and modern farming systems, including cloud services, mobile applications, data analysis tools, and high-speed imagery services. Precision agriculture is a growing application in farm management software due to its ability to improve crop quality, optimize resource use, and reduce input costs. As the world's population continues to grow, precision agriculture will play an increasingly important role in ensuring food security and sustainability.

The Asia Pacific region is projected to grow at the highest CAGR during the forecast period.

The Asia Pacific region is witnessing a notable surge in technological adoption across diverse sectors, agriculture being no exception. This surge is largely facilitated by the growing accessibility and affordability of advanced solutions. As a result, farmers are increasingly inclined to embrace precision farming practices and make investments in cutting-edge software to enhance the efficiency and effectiveness of their operations. Moreover, governments throughout the Asia Pacific region are actively advocating for the adoption of precision farming. They do so by implementing supportive policies, offering subsidies, and launching various initiatives aimed at incentivizing farmers to integrate precision farming practices into their operations. These governmental efforts play a crucial role in driving the adoption of farm management software, encouraging farmers to leverage technology to optimize resource utilization, improve productivity, and foster sustainable agricultural practices.

Farm Management Software Market by Region

Farm Management Software Market by Region

To know about the assumptions considered for the study, download the pdf brochure

Key Market Players

The major players in the farm management software companies include AGRIVI (UK), Trimble Inc. (US), Granular Inc. (US), Raven Industries, Inc. (US), TOPCON CORPORATION (Japan), AgJunction LLC (US), Agworld Pty Ltd (US), Farmers Edge Inc. (Canada), Climate LLC (US). These companies have used organic and inorganic growth strategies, such as product launches, acquisitions, and partnerships to strengthen their position in the market.

Get online access to the report on the World's First Market Intelligence Cloud

  • Easy to Download Historical Data & Forecast Numbers
  • Company Analysis Dashboard for high growth potential opportunities
  • Research Analyst Access for customization & queries
  • Competitor Analysis with Interactive dashboard
  • Latest News, Updates & Trend analysis
Request Sample

Scope of the Report

Report Metric

Details

Market Size Availability for Years

2020–2029

Base Year

2023

Forecast Period

2024–2029

Forecast Units

Value (USD)

Segments Covered

By Offering, By Farm Size, By Farm Production, By Application

Geographies Covered

Americas, Europe, Asia Pacific, and RoW

Companies Covered

AGRIVI (UK), Trimble Inc. (US), Granular Inc. (US), Raven Industries, Inc. (US), TOPCON CORPORATION (Japan), AgJunction LLC (US), Agworld Pty Ltd (US), Farmers Edge Inc. (Canada), Climate LLC (US), IBM (US), Afimilk Ltd. (Israel), ABACO S.p.A. (Italy), Deere & Company (US), Microsoft (US), GEA Group Aktiengesellschaft (Germany), SST Software (US), CropX Inc. (Israel), CropIn Technology Solutions Private Limited (India), Conservis (US), Gamaya (Switzerland), Eruvaka Technologies (India), Ag Leader Technology (US),  DICKEY-john (US), DeLaval (Sweden), and BouMatic (US)

Farm Management Software Market Highlights

This research report categorizes the farm management software market based on offering, farm size, farm production, application, and region.

Segment

Subsegment

By Offering

  • Introduction
  • On-cloud
  • On-premise
  • Data Analytics Services

By Farm Size

  • Introduction
  • Small
  • Medium
  • Large

By Farm Production

  • Introduction
  • Pre-production Planning
  • Production Planning
  • Post-production Planning

By Application

  • Introduction
  • Precision Farming
  • Precision Livestock
  • Precision Aquaculture
  • Precision Forestry
  • Smart Greenhouses
  • Other Applications

By Region

  • Introduction
  • Americas
    • Impact of Recession
    • North America
    • US
    • Canada
    • Mexico
  • South America
    • Brazil
    • Argentina
    • Rest of South America
  • Europe
    • Impact of Recession
    • UK
    • Germany
    • France
    • Italy
    • Netherlands
    • Spain
    • Rest of the Europe
  • Asia Pacific
    • Impact of Recession
    • China
    • Japan
    • South Korea
    • India
    • Australia & New Zealand
    • Rest of Asia Pacific
  • ROW
    • Impact of Recession
    • Middle East & Africa
      • GCC
      • Rest of Middle East & Africa

Recent Developments

  • In October 2023, AGRIVI joined forces with ReddAgro, a leading Agri-Tech firm known for its expertise in precision farming, greenhouse control and automation, and agricultural supply chain management solutions. Together, they aim to transform farming methods, fostering innovation and sustainability across the agricultural sector in Jordan, Sudan, Saudi Arabia, Egypt, and Iraq. Both ReddAgro and AGRIVI are aligned in their vision of a more sustainable and efficient agricultural future. Through this partnership, they seek to bring this vision to fruition by leveraging their respective strengths, knowledge, and international presence.
  • In September 2023, Trimble Inc. disclosed a definitive agreement to establish a joint venture with AGCO, aiming to enhance support for farmers in the mixed fleet precision agriculture market through factory-fitted and aftermarket applications. Together, Trimble and AGCO share the vision of creating a global leader in smart farming and autonomy solutions for mixed fleets.
  • In June 2023, TOPCON CORPORATION introduced significant advancements to its cloud-based software platform, TAP FEED management, catering to dairy and beef operations. The platform now offers several options, including the free TAP FEED App and subscription-based choices like TAP FEED Lite and TAP FEED Pro, designed specifically for dairy producers. Additionally, Topcon Agriculture has unveiled the TAP FEED Advisor customer management tool, tailored for feed advisors, consultants, and nutritionists.
  • In August 2023, Raven Industries indeed stands out as a frontrunner in the realm of agricultural technology, consistently demonstrating its dedication to advancing farming practices through innovative solutions. By forging strategic partnerships and leveraging its expertise in innovation, Raven not only enhances its own offerings but also contributes to the overall efficiency and productivity of the agricultural sector.
  • In November 2023, Kubota and Chouette have collaborated aimed at creating solutions that minimize the use of chemical pesticides while also reducing the labor needed for growth monitoring. This partnership integrates Chouette's AI-driven technology, which detects diseases and assesses growth issues through vineyard imagery, with Kubota's tractors and sprayers. The result is the generation of maps highlighting optimal locations and volumes for chemical application, enhancing efficiency and sustainability in agricultural practices.

Frequently Asked Questions (FAQs):

To speak to our analyst for a discussion on the above findings, click Speak to Analyst

TABLE OF CONTENTS
 
1 INTRODUCTION (Page No. - 34)
    1.1 STUDY OBJECTIVES 
    1.2 MARKET DEFINITION 
           1.2.1 INCLUSIONS AND EXCLUSIONS
    1.3 STUDY SCOPE 
           1.3.1 MARKETS COVERED
                    FIGURE 1 FARM MANAGEMENT SOFTWARE MARKET SEGMENTATION
           1.3.2 REGIONAL SCOPE
           1.3.3 YEARS CONSIDERED
    1.4 CURRENCY 
    1.5 LIMITATIONS 
    1.6 UNITS CONSIDERED 
    1.7 STAKEHOLDERS 
    1.8 SUMMARY OF CHANGES 
 
2 RESEARCH METHODOLOGY (Page No. - 40)
    2.1 RESEARCH APPROACH 
           FIGURE 2 FARM MANAGEMENT SOFTWARE MARKET: PROCESS FLOW FOR MARKET SIZE ESTIMATION
           FIGURE 3 FARM MANAGEMENT SOFTWARE MARKET: RESEARCH DESIGN
           2.1.1 SECONDARY DATA
                    2.1.1.1 List of major secondary sources
                    2.1.1.2 Key data from secondary sources
           2.1.2 PRIMARY DATA
                    2.1.2.1 Primary interviews with experts
                    2.1.2.2 List of key primary interview participants
                    2.1.2.3 Breakdown of primaries
                    2.1.2.4 Key data from primary sources
                    2.1.2.5 Key industry insights
           2.1.3 SECONDARY AND PRIMARY RESEARCH
    2.2 MARKET SIZE ESTIMATION 
           2.2.1 BOTTOM-UP APPROACH
                    FIGURE 4 BOTTOM-UP APPROACH: FARM MANAGEMENT SOFTWARE MARKET
                    2.2.1.1 Approach for capturing market share through bottom-up analysis (demand side)
           2.2.2 SUPPLY-SIDE ANALYSIS
                    FIGURE 5 SUPPLY-SIDE ESTIMATION: FARM MANAGEMENT SOFTWARE MARKET
           2.2.3 TOP-DOWN APPROACH
                    2.2.3.1 Approach for capturing market share through top-down analysis (supply side)
                               FIGURE 6 TOP-DOWN APPROACH: FARM MANAGEMENT SOFTWARE MARKET
           2.2.4 DEMAND-SIDE ANALYSIS
                    FIGURE 7 FARM MANAGEMENT SOFTWARE MARKET: DEMAND-SIDE ESTIMATION
    2.3 MARKET BREAKDOWN AND DATA TRIANGULATION 
           FIGURE 8 DATA TRIANGULATION: FARM MANAGEMENT SOFTWARE MARKET
           2.3.1 MARKET GROWTH FORECAST
                    TABLE 1 REMOTE SENSING TECHNOLOGY PENETRATION IN MAJOR COUNTRIES
    2.4 RESEARCH ASSUMPTIONS 
    2.5 RESEARCH LIMITATIONS 
    2.6 RISK ASSESSMENT 
    2.7 IMPACT OF RECESSION ON FARM MANAGEMENT SOFTWARE MARKET 
 
3 EXECUTIVE SUMMARY (Page No. - 55)
    FIGURE 9 FARM MANAGEMENT SOFTWARE MARKET GROWTH, 2020−2029 (USD BILLION)
    FIGURE 10 PRECISION FARMING APPLICATION TO BE LARGEST SEGMENT OF FARM MANAGEMENT SOFTWARE MARKET
    FIGURE 11 DATA ANALYTICS SERVICES TO REGISTER HIGHEST CAGR IN FARM MANAGEMENT SOFTWARE MARKET
    FIGURE 12 MEDIUM-SIZED FARMS TO ACCOUNT FOR LARGEST SHARE OF FARM MANAGEMENT SOFTWARE MARKET
    FIGURE 13 PRODUCTION PLANNING TO BE LARGEST SEGMENT OF FARM MANAGEMENT SOFTWARE MARKET
    FIGURE 14 AMERICAS ACCOUNTED FOR LARGEST SHARE OF FARM MANAGEMENT SOFTWARE MARKET IN 2023
 
4 PREMIUM INSIGHTS (Page No. - 60)
    4.1 ATTRACTIVE GROWTH OPPORTUNITIES FOR PLAYERS IN FARM MANAGEMENT SOFTWARE MARKET 
           FIGURE 15 NEED FOR REAL-TIME DATA MANAGEMENT TO DRIVE FARM MANAGEMENT SOFTWARE MARKET
    4.2 FARM MANAGEMENT SOFTWARE MARKET, BY APPLICATION AND OFFERING 
           FIGURE 16 PRECISION FARMING ACCOUNTED FOR LARGER SHARE OF FARM MANAGEMENT SOFTWARE MARKET
    4.3 FARM MANAGEMENT SOFTWARE MARKET, BY OFFERING 
           FIGURE 17 ON-CLOUD SEGMENT TO DOMINATE OVERALL FARM MANAGEMENT SOFTWARE MARKET
    4.4 FARM MANAGEMENT SOFTWARE MARKET, BY FARM SIZE 
           FIGURE 18 MEDIUM-SIZED FARMS TO ACCOUNT FOR LARGEST MARKET SHARE DURING FORECAST PERIOD
    4.5 FARM MANAGEMENT SOFTWARE MARKET, BY FARM PRODUCTION 
           FIGURE 19 PRODUCTION PLANNING SEGMENT TO ACCOUNT FOR LARGEST MARKET SHARE DURING FORECAST PERIOD
    4.6 FARM MANAGEMENT SOFTWARE MARKET, BY REGION 
           FIGURE 20 ASIA PACIFIC TO REGISTER HIGHEST CAGR IN FARM MANAGEMENT SOFTWARE MARKET
 
5 MARKET OVERVIEW (Page No. - 63)
    5.1 INTRODUCTION 
    5.2 MARKET DYNAMICS 
           FIGURE 21 DRIVERS, RESTRAINTS, OPPORTUNITIES, AND CHALLENGES IN FARM MANAGEMENT SOFTWARE MARKET
           5.2.1 DRIVERS
                    5.2.1.1 Increasing integration of advanced technologies for real-time farm management
                    5.2.1.2 Climate change and growing food security concerns
                    5.2.1.3 Initiatives by governments on digitalization of agriculture sector
                               TABLE 2 MAJOR RECENT INITIATIVES UNDERTAKEN BY GOVERNMENT OF INDIA IN AGRICULTURAL INDUSTRY
                    5.2.1.4 Focus on livestock monitoring and tracking health-related data in real time to increase farm efficiency
                    5.2.1.5 Growing adoption of advanced technologies, such as IoT, RoVs, and AI, in aquaculture farms
                    5.2.1.6 Implementation of big data analytics in agriculture
                               FIGURE 22 IMPACT ANALYSIS OF DRIVERS ON FARM MANAGEMENT SOFTWARE MARKET
           5.2.2 RESTRAINTS
                    5.2.2.1 Limited technical expertise and lack of advanced infrastructure in developing regions
                    5.2.2.2 Requirement of high initial capital investment
                               FIGURE 23 IMPACT ANALYSIS OF RESTRAINTS ON FARM MANAGEMENT SOFTWARE MARKET
           5.2.3 OPPORTUNITIES
                    5.2.3.1 Rapid adoption of smart farming technologies
                    5.2.3.2 Convergence of digital technologies with farming practices
                    5.2.3.3 Increasing use of drones and remote sensing for farm management
                               FIGURE 24 IMPACT ANALYSIS OF OPPORTUNITIES FOR FARM MANAGEMENT SOFTWARE MARKET
           5.2.4 CHALLENGES
                    5.2.4.1 Large presence of fragmented farms in developing countries
                    5.2.4.2 Management of data for productive decision-making through single digital platform
                               FIGURE 25 IMPACT ANALYSIS OF CHALLENGES ON FARM MANAGEMENT SOFTWARE MARKET
    5.3 SUPPLY CHAIN ANALYSIS 
           FIGURE 26 FARM MANAGEMENT SOFTWARE MARKET: SUPPLY CHAIN ANALYSIS
    5.4 ECOSYSTEM 
           FIGURE 27 FARM MANAGEMENT SOFTWARE MARKET: ECOSYSTEM ANALYSIS
           TABLE 3 FARM MANAGEMENT SOFTWARE MARKET: COMPANIES AND THEIR ROLE IN ECOSYSTEM
    5.5 INVESTMENT AND FUNDING 
           FIGURE 28 FARM MANAGEMENT SOFTWARE MARKET: INVESTMENT AND FUNDING
    5.6 PRICING ANALYSIS 
           FIGURE 29 AVERAGE SUBSCRIPTION PRICING OF PREMIUM FARM MANAGEMENT SOFTWARE
           5.6.1 PRICING ANALYSIS FOR KEY PLAYERS, BY FARM MANAGEMENT SOFTWARE
                    TABLE 4 SUBSCRIPTION PRICE ANALYSIS FOR KEY PLAYERS, BY FARM MANAGEMENT SOFTWARE, 2023 (USD)
           5.6.2 AVERAGE SUBSCRIPTION PRICE OF FARM MANAGEMENT SOFTWARE FOR CLOUD-BASED DELIVERY MODEL, BY REGION
                    TABLE 5 AVERAGE SUBSCRIPTION PRICE TREND, BY REGION (USD)
    5.7 TRENDS/DISRUPTIONS IMPACTING CUSTOMERS' BUSINESSES 
           FIGURE 30 NEW REVENUE POCKETS FOR PLAYERS IN FARM MANAGEMENT SOFTWARE MARKET
    5.8 TECHNOLOGY ANALYSIS 
           5.8.1 KEY TECHNOLOGY
                    5.8.1.1 Blockchain
                    5.8.1.2 GIS-based agriculture
                    5.8.1.3 Artificial intelligence in agriculture
           5.8.2 COMPLEMENTARY TECHNOLOGY
                    5.8.2.1 Remote sensing in agriculture
                    5.8.2.2 Satellite-derived data
                    5.8.2.3 RFID and identification technologies
                    5.8.2.4 Sky-drones
           5.8.3 ADJACENT TECHNOLOGY
                    5.8.3.1 Smartphone technology
                    5.8.3.2 Big data and analytics
    5.9 PORTER'S FIVE FORCES ANALYSIS 
           TABLE 6 PORTER'S FIVE FORCES ANALYSIS: FARM MANAGEMENT SOFTWARE MARKET
           FIGURE 31 IMPACT OF PORTER'S FIVE FORCES ON FARM MANAGEMENT SOFTWARE MARKET, 2023
           FIGURE 32 FARM MANAGEMENT SOFTWARE MARKET: PORTER'S FIVE FORCES ANALYSIS
           5.9.1 THREAT OF NEW ENTRANTS
           5.9.2 THREAT OF SUBSTITUTES
           5.9.3 BARGAINING POWER OF SUPPLIERS
           5.9.4 BARGAINING POWER OF BUYERS
           5.9.5 INTENSITY OF COMPETITIVE RIVALRY
    5.10 KEY STAKEHOLDERS AND BUYING CRITERIA 
           5.10.1 KEY STAKEHOLDERS IN BUYING PROCESS
                    FIGURE 33 INFLUENCE OF STAKEHOLDERS ON BUYING PROCESS, BY APPLICATION
                    TABLE 7 INFLUENCE OF STAKEHOLDERS ON BUYING PROCESS, BY APPLICATION (%)
           5.10.2 BUYING CRITERIA
                    FIGURE 34 KEY BUYING CRITERIA, BY APPLICATION
                    TABLE 8 KEY BUYING CRITERIA, BY APPLICATION
    5.11 CASE STUDIES 
           5.11.1 CANOLA HEAT BLAST COVERAGE FROM FARMERS EDGE INC.
           5.11.2 IMPROVING FARM WORK MANAGEMENT EFFICIENCY WITH FMS
           5.11.3 MAXIMIZED YIELD FOR CASSAVA PLANTATION BUSINESS
           5.11.4 ANNA BINNA FARMS USED AGWORLD SOFTWARE PLATFORM FOR FARM RECORD-KEEPING SYSTEM AND PRE-EMERGENT HERBICIDES
           5.11.5 LILLIPUT AG AIMS TO IMPROVE PLANNING BY CAPTURING DATA WITH AGWORLD PLATFORM
           5.11.6 FARMERP BOLSTERS OPERATIONAL EFFICIENCY OF SINGAPORE'S BIGGEST HYDROPONIC ENTERPRISE
    5.12 TRADE DATA ANALYSIS 
           TABLE 9 IMPORT DATA OF AGRICULTURAL, HORTICULTURAL, OR FORESTRY MACHINERY OF SOIL PREPARATION OR CULTIVATION, BY COUNTRY, 2018–2022 (USD MILLION)
           FIGURE 35 IMPORT DATA FOR PRODUCTS COVERED UNDER HS CODE 8432, BY COUNTRY, 2018–2022 (USD MILLION)
           TABLE 10 EXPORT DATA OF AGRICULTURAL, HORTICULTURAL, OR FORESTRY MACHINERY OF SOIL PREPARATION OR CULTIVATION, BY COUNTRY, 2018–2022 (USD MILLION)
           FIGURE 36 EXPORT DATA FOR PRODUCTS COVERED UNDER HS CODE 8432, BY COUNTRY, 2018–2022 (USD MILLION)
    5.13 PATENT ANALYSIS 
           TABLE 11 MAJOR PATENTS RELATED TO FARM MANAGEMENT SOFTWARE MARKET, 2020–2024
           FIGURE 37 NUMBER OF PATENTS GRANTED IN FARM MANAGEMENT SOFTWARE MARKET, 2014–2023
    5.14 KEY CONFERENCES AND EVENTS, 2024 
           TABLE 12 FARM MANAGEMENT SOFTWARE MARKET: DETAILED LIST OF CONFERENCES AND EVENTS
    5.15 STANDARDS AND REGULATORY LANDSCAPE 
           5.15.1 REGULATORY BODIES, GOVERNMENT AGENCIES, AND OTHER ORGANIZATIONS
                    TABLE 13 NORTH AMERICA: LIST OF REGULATORY BODIES, GOVERNMENT AGENCIES, AND OTHER ORGANIZATIONS
                    TABLE 14 EUROPE: LIST OF REGULATORY BODIES, GOVERNMENT AGENCIES, AND OTHER ORGANIZATIONS
                    TABLE 15 ASIA PACIFIC: LIST OF REGULATORY BODIES, GOVERNMENT AGENCIES, AND OTHER ORGANIZATIONS
           5.15.2 CARBON POLICY TRENDS IN AGRICULTURE
           5.15.3 GROWING CLIMATE SOLUTIONS ACT
           5.15.4 REGULATIONS IN PRECISION FARMING AND SMART GREENHOUSES
                    TABLE 16 REGULATIONS: PRECISION FARMING AND SMART GREENHOUSES
 
6 FARM MANAGEMENT SOFTWARE MARKET, BY OFFERING (Page No. - 103)
    6.1 INTRODUCTION 
           TABLE 17 FARM MANAGEMENT SOFTWARE MARKET, BY OFFERING, 2020–2023 (USD MILLION)
           FIGURE 38 DATA ANALYTICS SERVICES SEGMENT TO WITNESS HIGHEST CAGR DURING FORECAST PERIOD
           TABLE 18 FARM MANAGEMENT SOFTWARE MARKET, BY OFFERING, 2024–2029 (USD MILLION)
    6.2 ON-CLOUD 
           TABLE 19 ON-CLOUD: FARM MANAGEMENT SOFTWARE MARKET, BY APPLICATION, 2020–2023 (USD MILLION)
           TABLE 20 ON-CLOUD: FARM MANAGEMENT SOFTWARE MARKET, BY APPLICATION, 2024–2029 (USD MILLION)
           TABLE 21 ON-CLOUD: FARM MANAGEMENT SOFTWARE MARKET, BY DEPLOYMENT, 2020–2023 (USD MILLION)
           TABLE 22 ON-CLOUD: FARM MANAGEMENT SOFTWARE MARKET, BY DEPLOYMENT, 2024–2029 (USD MILLION)
           6.2.1 SOFTWARE AS A SERVICE (SAAS)
                    6.2.1.1 Farmers adopting SaaS applications for ease of use and scalability
           6.2.2 PLATFORM AS A SERVICE (PAAS)
                    6.2.2.1 Farmers adopting PaaS applications for customized insights
    6.3 ON-PREMISES 
           6.3.1 HIGHER DATA SECURITY AND LOWER INTERNET COSTS TO DRIVE ON-PREMISES FARM MANAGEMENT SOFTWARE MARKET
                    TABLE 23 ON-PREMISES: FARM MANAGEMENT SOFTWARE MARKET, BY APPLICATION, 2020–2023 (USD MILLION)
                    TABLE 24 ON-PREMISES: FARM MANAGEMENT SOFTWARE MARKET, BY APPLICATION, 2024–2029 (USD MILLION)
    6.4 DATA ANALYTICS SERVICES 
           6.4.1 FARMERS ADOPTING DATA ANALYTICS SERVICES TO ENHANCE PROFITABILITY AND CUT COSTS
                    TABLE 25 DATA ANALYTICS SERVICES: FARM MANAGEMENT SOFTWARE MARKET, BY APPLICATION, 2020–2023 (USD MILLION)
                    TABLE 26 DATA ANALYTICS SERVICES: FARM MANAGEMENT SOFTWARE MARKET, BY APPLICATION, 2024–2029 (USD MILLION)
 
7 FARM MANAGEMENT SOFTWARE MARKET, BY FARM SIZE 
    7.1 INTRODUCTION 
           TABLE 27 FARM MANAGEMENT SOFTWARE MARKET, BY FARM SIZE, 2020–2023 (USD MILLION)
           FIGURE 39 MEDIUM-SIZED FARMS TO ACCOUNT FOR LARGEST SHARE OF FARM MANAGEMENT SOFTWARE MARKET
           TABLE 28 FARM MANAGEMENT SOFTWARE MARKET, BY FARM SIZE, 2024–2029 (USD MILLION)
    7.2 LARGE FARMS 
           7.2.1 LARGE FARMS ADOPTING TECHNOLOGY TO INCREASE PRODUCTIVITY
                    TABLE 29 LARGE: FARM MANAGEMENT SOFTWARE MARKET, BY REGION, 2020–2023 (USD MILLION)
                    TABLE 30 LARGE: FARM MANAGEMENT SOFTWARE MARKET, BY REGION, 2024–2029 (USD MILLION)
    7.3 MEDIUM FARMS 
           7.3.1 MEDIUM-SIZED FARMS TO DOMINATE FARM MANAGEMENT SOFTWARE MARKET THROUGH 2028
                    TABLE 31 MEDIUM-SIZED: FARM MANAGEMENT SOFTWARE MARKET, BY REGION, 2020–2023 (USD MILLION)
                    TABLE 32 MEDIUM-SIZED: FARM MANAGEMENT SOFTWARE MARKET, BY REGION, 2024–2029 (USD MILLION)
    7.4 SMALL FARMS 
           7.4.1 SMALL FARM OWNERS USING FARM MANAGEMENT SOFTWARE TO INCREASE PRODUCTION AND REDUCE OPERATIONAL COSTS
                    TABLE 33 SMALL: FARM MANAGEMENT SOFTWARE MARKET, BY REGION, 2020–2023 (USD MILLION)
                    TABLE 34 SMALL: FARM MANAGEMENT SOFTWARE MARKET, BY REGION, 2024–2029 (USD MILLION)
 
8 FARM MANAGEMENT SOFTWARE MARKET, BY APPLICATION (Page No. - 118)
    8.1 INTRODUCTION 
           FIGURE 40 FARM MANAGEMENT SOFTWARE MARKET, BY APPLICATION
           TABLE 35 FARM MANAGEMENT SOFTWARE MARKET, BY APPLICATION, 2020–2023 (USD MILLION)
           FIGURE 41 PRECISION FARMING TO ACCOUNT FOR LARGEST SHARE OF FARM MANAGEMENT SOFTWARE MARKET
           TABLE 36 FARM MANAGEMENT SOFTWARE MARKET, BY APPLICATION, 2024–2029 (USD MILLION)
    8.2 PRECISION FARMING 
           TABLE 37 PRECISION FARMING: FARM MANAGEMENT SOFTWARE MARKET, BY APPLICATION, 2020–2023 (USD MILLION)
           TABLE 38 PRECISION FARMING: FARM MANAGEMENT SOFTWARE MARKET, BY APPLICATION, 2024–2029 (USD MILLION)
           TABLE 39 PRECISION FARMING: FARM MANAGEMENT SOFTWARE MARKET, BY REGION, 2020–2023 (USD MILLION)
           TABLE 40 PRECISION FARMING: FARM MANAGEMENT SOFTWARE MARKET, BY REGION, 2024–2029 (USD MILLION)
           TABLE 41 PRECISION FARMING: FARM MANAGEMENT SOFTWARE MARKET, BY OFFERING, 2020–2023 (USD MILLION)
           TABLE 42 PRECISION FARMING: FARM MANAGEMENT SOFTWARE MARKET, BY OFFERING, 2024–2029 (USD MILLION)
           8.2.1 CROP SCOUTING
                    8.2.1.1 Soil and crop monitoring help gain data on soil properties and predict crop yield
           8.2.2 YIELD MONITORING
                    8.2.2.1 Yield and harvesting monitoring systems facilitating resource allocation to meet needs of plants
           8.2.3 FIELD MAPPING
                    8.2.3.1 Increasing demand for soil identification to support market growth
           8.2.4 VARIABLE RATE APPLICATIONS
                    8.2.4.1 Increasing climate variability to drive market
           8.2.5 WEATHER TRACKING & FORECASTING
                    8.2.5.1 Weather tracking and real-time data helping farmers protect farms from natural calamities
           8.2.6 INVENTORY MANAGEMENT
                    8.2.6.1 Helps in monitoring operations and lower costs
           8.2.7 FINANCIAL MANAGEMENT
                    8.2.7.1 Farmers adopting farm management software for financial management to streamline business operations
           8.2.8 EQUIPMENT MONITORING AND MAINTENANCE
                    8.2.8.1 Need to record output and efficiency of equipment used for farming to drive demand
           8.2.9 FARM LABOR MANAGEMENT
                    8.2.9.1 Farm management software adopted to use labor effectively based on requirement
           8.2.10 OTHER PRECISION FARMING APPLICATIONS
    8.3 PRECISION LIVESTOCK 
           TABLE 43 PRECISION LIVESTOCK: FARM MANAGEMENT SOFTWARE MARKET, BY APPLICATION, 2020–2023 (USD MILLION)
           TABLE 44 PRECISION LIVESTOCK: FARM MANAGEMENT SOFTWARE MARKET, BY APPLICATION, 2024–2029 (USD MILLION)
           TABLE 45 PRECISION LIVESTOCK: FARM MANAGEMENT SOFTWARE MARKET, BY REGION, 2020–2023 (USD MILLION)
           TABLE 46 PRECISION LIVESTOCK: FARM MANAGEMENT SOFTWARE MARKET, BY REGION, 2024–2029 (USD MILLION)
           TABLE 47 PRECISION LIVESTOCK: FARM MANAGEMENT SOFTWARE MARKET, BY OFFERING, 2020–2023 (USD MILLION)
           TABLE 48 PRECISION LIVESTOCK: FARM MANAGEMENT SOFTWARE MARKET, BY OFFERING, 2024–2029 (USD MILLION)
           8.3.1 IDENTIFICATION AND TRACKING
                    8.3.1.1 Identification and tracking systems adopted to enable immediate attention to animals deviating from normal behavioral patterns
           8.3.2 FEEDING MANAGEMENT
                    8.3.2.1 Ensures optimum feed intake for improved productivity
           8.3.3 MILK HARVESTING
                    8.3.3.1 Adoption of automated milk harvesting to drive market
           8.3.4 OTHER PRECISION LIVESTOCK APPLICATIONS
    8.4 PRECISION AQUACULTURE 
           TABLE 49 PRECISION AQUACULTURE: FARM MANAGEMENT SOFTWARE MARKET, BY APPLICATION, 2020–2023 (USD MILLION)
           TABLE 50 PRECISION AQUACULTURE: FARM MANAGEMENT SOFTWARE MARKET, BY APPLICATION, 2024–2029 (USD MILLION)
           TABLE 51 PRECISION AQUACULTURE: FARM MANAGEMENT SOFTWARE MARKET, BY REGION, 2020–2023 (USD MILLION)
           TABLE 52 PRECISION AQUACULTURE: FARM MANAGEMENT SOFTWARE MARKET, BY REGION, 2024–2029 (USD MILLION)
           TABLE 53 PRECISION AQUACULTURE: FARM MANAGEMENT SOFTWARE MARKET, BY OFFERING, 2020–2023 (USD MILLION)
           TABLE 54 PRECISION AQUACULTURE: FARM MANAGEMENT SOFTWARE MARKET, BY OFFERING, 2024–2029 (USD MILLION)
           8.4.1 FARM MONITORING AND SURVEILLANCE
                    8.4.1.1 Farm management software used to effectively monitor health and activities of fish to ensure improved productivity
           8.4.2 FEEDING MANAGEMENT
                    8.4.2.1 Need for optimum feed intake for higher productivity of aquaculture farms to drive market
           8.4.3 OTHER PRECISION AQUACULTURE APPLICATIONS
    8.5 PRECISION FORESTRY 
           TABLE 55 PRECISION FORESTRY: FARM MANAGEMENT SOFTWARE MARKET, BY APPLICATION, 2020–2023 (USD MILLION)
           TABLE 56 PRECISION FORESTRY: FARM MANAGEMENT SOFTWARE MARKET, BY APPLICATION, 2024–2029 (USD MILLION)
           TABLE 57 PRECISION FORESTRY: FARM MANAGEMENT SOFTWARE MARKET, BY REGION, 2020–2023 (USD MILLION)
           TABLE 58 PRECISION FORESTRY: FARM MANAGEMENT SOFTWARE MARKET, BY REGION, 2024–2029 (USD MILLION)
           TABLE 59 PRECISION FORESTRY: FARM MANAGEMENT SOFTWARE MARKET, BY OFFERING, 2020–2023 (USD MILLION)
           TABLE 60 PRECISION FORESTRY: FARM MANAGEMENT SOFTWARE MARKET, BY OFFERING, 2024–2029 (USD MILLION)
           8.5.1 HARVESTING MANAGEMENT
                    8.5.1.1 Improved operational control over forestry to increase demand
           8.5.2 SILVICULTURE AND FIRE MANAGEMENT
                    8.5.2.1 Identification of fire hotspots in forests and minimization of damages to boost demand
           8.5.3 INVENTORY AND LOGISTICS MANAGEMENT
                    8.5.3.1 Reduced inventory costs associated with precision forestry to drive market
           8.5.4 GENETICS AND NURSERIES
                    8.5.4.1 Enables assessing soil quality in nurseries through GPS or satellite-based imaging
    8.6 SMART GREENHOUSES 
           TABLE 61 SMART GREENHOUSES: FARM MANAGEMENT SOFTWARE MARKET, BY APPLICATION, 2020–2023 (USD MILLION)
           TABLE 62 SMART GREENHOUSES: FARM MANAGEMENT SOFTWARE MARKET, BY APPLICATION, 2024–2029 (USD MILLION)
           TABLE 63 SMART GREENHOUSES: FARM MANAGEMENT SOFTWARE MARKET, BY REGION, 2020–2023 (USD MILLION)
           TABLE 64 SMART GREENHOUSES: FARM MANAGEMENT SOFTWARE MARKET, BY REGION, 2024–2029 (USD MILLION)
           TABLE 65 SMART GREENHOUSES: FARM MANAGEMENT SOFTWARE MARKET, BY OFFERING, 2020–2023 (USD MILLION)
           TABLE 66 SMART GREENHOUSES: FARM MANAGEMENT SOFTWARE MARKET, BY OFFERING, 2024–2029 (USD MILLION)
           8.6.1 HVAC AND CLIMATE CONTROL
                    8.6.1.1 Necessity for maintaining optimal temperatures for healthy plant growth to fuel demand
           8.6.2 CROP HEALTH AND YIELD MONITORING
                    8.6.2.1 High demand for crop health and yield monitoring for making strategic decisions to drive market
           8.6.3 AUTOMATED IRRIGATION SCHEDULING
                    8.6.3.1 Need to conserve water for automated irrigation scheduling applications to drive market
           8.6.4 OTHER SMART GREENHOUSE APPLICATIONS
    8.7 OTHER APPLICATIONS 
           TABLE 67 OTHER APPLICATIONS: FARM MANAGEMENT SOFTWARE MARKET, BY APPLICATION TYPE, 2020–2023 (USD MILLION)
           TABLE 68 OTHER APPLICATIONS: FARM MANAGEMENT SOFTWARE MARKET, BY APPLICATION TYPE, 2024–2029 (USD MILLION)
           TABLE 69 OTHER APPLICATIONS: FARM MANAGEMENT SOFTWARE MARKET, BY REGION, 2020–2023 (USD MILLION)
           TABLE 70 OTHER APPLICATIONS: FARM MANAGEMENT SOFTWARE MARKET, BY REGION, 2024–2029 (USD MILLION)
           TABLE 71 OTHER APPLICATIONS: FARM MANAGEMENT SOFTWARE MARKET, BY OFFERING, 2020–2023 (USD MILLION)
           TABLE 72 OTHER APPLICATIONS: FARM MANAGEMENT SOFTWARE MARKET, BY OFFERING, 2024–2029 (USD MILLION)
    8.8 IMPACT OF RECESSION ON FARM MANAGEMENT SOFTWARE MARKET 
           TABLE 73 FARM MANAGEMENT SOFTWARE MARKET: IMPACT OF RECESSION
 
9 FARM MANAGEMENT SOFTWARE MARKET, BY FARM PRODUCTION (Page No. - 150)
    9.1 INTRODUCTION 
           TABLE 74 FARM MANAGEMENT SOFTWARE MARKET, BY FARM PRODUCTION, 2020–2023 (USD MILLION)
           FIGURE 42 PRODUCTION PLANNING TO ACCOUNT FOR LARGEST SHARE OF FARM MANAGEMENT SOFTWARE MARKET
           TABLE 75 FARM MANAGEMENT SOFTWARE MARKET, BY FARM PRODUCTION, 2024–2029 (USD MILLION)
    9.2 PRE-PRODUCTION PLANNING 
           9.2.1 NEED TO IDENTIFY APPROPRIATE FARMS FOR CULTIVATION TO DRIVE DEMAND
    9.3 PRODUCTION PLANNING 
           9.3.1 FARM MANAGEMENT SOFTWARE USED FOR MONITORING CROPS AND PRODUCTION PROCESSES TO IMPROVE PRODUCTIVITY
    9.4 POST-PRODUCTION PLANNING 
           9.4.1 FARM MANAGEMENT SOFTWARE USED TO MINIMIZE MANUAL ERRORS AND ASSIST IN STRATEGIC POST-PRODUCTION PLANNING
 
10 FARM MANAGEMENT SOFTWARE MARKET, BY REGION (Page No. - 155)
     10.1 INTRODUCTION 
             FIGURE 43 FARM MANAGEMENT SOFTWARE MARKET SEGMENTATION, BY REGION
             FIGURE 44 ASIA PACIFIC TO REGISTER HIGHEST CAGR DURING FORECAST PERIOD
             TABLE 76 FARM MANAGEMENT SOFTWARE MARKET, BY REGION, 2020–2023 (USD MILLION)
             TABLE 77 FARM MANAGEMENT SOFTWARE MARKET, BY REGION, 2024–2029 (USD MILLION)
     10.2 AMERICAS 
           FIGURE 45 AMERICAS FARM MANAGEMENT SOFTWARE MARKET SEGMENTATION, BY REGION
             10.2.1 IMPACT OF RECESSION IN AMERICAS
                        TABLE 78 AMERICAS: FARM MANAGEMENT SOFTWARE MARKET, BY REGION, 2020–2023 (USD MILLION)
                        TABLE 79 AMERICAS: FARM MANAGEMENT SOFTWARE MARKET, BY REGION, 2024–2029 (USD MILLION)
                        TABLE 80 AMERICAS: FARM MANAGEMENT SOFTWARE MARKET, BY FARM PRODUCTION, 2020–2023 (USD MILLION)
                        TABLE 81 AMERICAS: FARM MANAGEMENT SOFTWARE MARKET, BY FARM PRODUCTION, 2024–2029 (USD MILLION)
                        TABLE 82 AMERICAS: FARM MANAGEMENT SOFTWARE MARKET, BY APPLICATION, 2020–2023 (USD MILLION)
                        TABLE 83 AMERICAS: FARM MANAGEMENT SOFTWARE MARKET, BY APPLICATION, 2024–2029 (USD MILLION)
                        TABLE 84 AMERICAS: FARM MANAGEMENT SOFTWARE MARKET, BY FARM SIZE, 2020–2023 (USD MILLION)
                        TABLE 85 AMERICAS: FARM MANAGEMENT SOFTWARE MARKET, BY FARM SIZE, 2024–2029 (USD MILLION)
             10.2.2 NORTH AMERICA
                        FIGURE 46 AMERICAS: FARM MANAGEMENT SOFTWARE MARKET SNAPSHOT
                        TABLE 86 NORTH AMERICA: FARM MANAGEMENT SOFTWARE MARKET, BY COUNTRY, 2020–2023 (USD MILLION)
                        TABLE 87 NORTH AMERICA: FARM MANAGEMENT SOFTWARE MARKET, BY COUNTRY, 2024–2029 (USD MILLION)
                        10.2.2.1 US
                                     10.2.2.1.1 Higher adoption of advanced technologies and presence of prominent market players to foster market growth
                        10.2.2.2 Canada
                                     10.2.2.2.1 Government support to be instrumental in driving growth
                        10.2.2.3 Mexico
                                     10.2.2.3.1 Investment by key players and research organizations to drive market
             10.2.3 SOUTH AMERICA
                        TABLE 88 SOUTH AMERICA: FARM MANAGEMENT SOFTWARE MARKET, BY COUNTRY, 2020–2023 (USD MILLION)
                        TABLE 89 SOUTH AMERICA: FARM MANAGEMENT SOFTWARE MARKET, BY COUNTRY, 2023–2028 (USD MILLION)
 
                                     10.2.3.1.1 Large number of average-sized farms and investments from multiple stakeholders to drive market
                        10.2.3.2 Argentina
                                     10.2.3.2.1 Established agricultural machinery industry to support market growth
                        10.2.3.3 Rest of South America
     10.3 EUROPE 
             10.3.1 IMPACT OF RECESSION IN EUROPE
                        FIGURE 47 EUROPE: FARM MANAGEMENT SOFTWARE MARKET SNAPSHOT
                        TABLE 90 EUROPE: FARM MANAGEMENT SOFTWARE MARKET, BY COUNTRY, 2020–2023 (USD MILLION)
                        TABLE 91 EUROPE: FARM MANAGEMENT SOFTWARE MARKET, BY COUNTRY, 2024–2029 (USD MILLION)
                        TABLE 92 EUROPE: FARM MANAGEMENT SOFTWARE MARKET, BY FARM PRODUCTION, 2020–2023 (USD MILLION)
                        TABLE 93 EUROPE: FARM MANAGEMENT SOFTWARE MARKET, BY FARM PRODUCTION, 2024–2029 (USD MILLION)
                        TABLE 94 EUROPE: FARM MANAGEMENT SOFTWARE MARKET, BY APPLICATION, 2020–2023 (USD MILLION)
                        TABLE 95 EUROPE: FARM MANAGEMENT SOFTWARE MARKET, BY APPLICATION, 2024–2029 (USD MILLION)
                        TABLE 96 EUROPE: FARM MANAGEMENT SOFTWARE MARKET, BY FARM SIZE, 2020–2023 (USD MILLION)
                        TABLE 97 EUROPE: FARM MANAGEMENT SOFTWARE MARKET, BY FARM SIZE, 2024–2029 (USD MILLION)
             10.3.2 GERMANY
                        10.3.2.1 Increasing precision livestock-related activities to fuel market growth
             10.3.3 FRANCE
                        10.3.3.1 Significant progress in satellite imaging techniques to foster market growth
             10.3.4 UK
                        10.3.4.1 Reduced technology costs and government grants and incentives to boost market growth
             10.3.5 ITALY
                        10.3.5.1 Government support and incentive schemes to drive growth
 
             10.3.6 NETHERLANDS
                        10.3.6.1 Strong export of agriculture products to drive demand
             10.3.7 SPAIN
                        10.3.7.1 Increasing adoption of farm management software tools to improve crop yield
             10.3.8 REST OF EUROPE
     10.4 ASIA PACIFIC 
             10.4.1 IMPACT OF RECESSION IN ASIA PACIFIC
                        FIGURE 48 ASIA PACIFIC: FARM MANAGEMENT SOFTWARE MARKET SNAPSHOT
                        TABLE 98 ASIA PACIFIC: FARM MANAGEMENT SOFTWARE MARKET, BY COUNTRY, 2020–2023 (USD MILLION)
                        TABLE 99 ASIA PACIFIC: FARM MANAGEMENT SOFTWARE MARKET, BY COUNTRY, 2024–2029 (USD MILLION)
                        TABLE 100 ASIA PACIFIC: FARM MANAGEMENT SOFTWARE MARKET, BY FARM PRODUCTION, 2020–2023 (USD MILLION)
                        TABLE 101 ASIA PACIFIC: FARM MANAGEMENT SOFTWARE MARKET, BY FARM PRODUCTION, 2024–2029 (USD MILLION)
                        TABLE 102 ASIA PACIFIC: FARM MANAGEMENT SOFTWARE MARKET, BY APPLICATION, 2020–2023 (USD MILLION)
                        TABLE 103 ASIA PACIFIC: FARM MANAGEMENT SOFTWARE MARKET, BY APPLICATION, 2024–2029 (USD MILLION)
                        TABLE 104 ASIA PACIFIC: FARM MANAGEMENT SOFTWARE MARKET, BY FARM SIZE, 2020–2023 (USD MILLION)
                        TABLE 105 ASIA PACIFIC: FARM MANAGEMENT SOFTWARE MARKET, BY FARM SIZE, 2024–2029 (USD MILLION)
             10.4.2 CHINA
                        10.4.2.1 Increased government funding to support adoption of farm management software
             10.4.3 JAPAN
                        10.4.3.1 Technological advancements to drive adoption of farm management software
             10.4.4 SOUTH KOREA
                        10.4.4.1 High per capita income of farmers to increase demand
             10.4.5 AUSTRALIA & NEW ZEALAND
                        10.4.5.1 Extensive use of technologies to automate farming processes and monitor livestock to support market growth
             10.4.6 INDIA
                        10.4.6.1 Unpredictable weather conditions encouraging farmers to adopt agricultural software
             10.4.7 REST OF ASIA PACIFIC
     10.5 REST OF WORLD 
             10.5.1 IMPACT OF RECESSION IN ROW
                        TABLE 106 ROW: FARM MANAGEMENT SOFTWARE MARKET, BY COUNTRY, 2020–2023 (USD MILLION)
                        TABLE 107 ROW: FARM MANAGEMENT SOFTWARE MARKET, BY COUNTRY, 2024–2029 (USD MILLION)
                        TABLE 108 ROW: FARM MANAGEMENT SOFTWARE MARKET, BY FARM PRODUCTION, 2020–2023 (USD MILLION)
                        TABLE 109 ROW: FARM MANAGEMENT SOFTWARE MARKET, BY FARM PRODUCTION, 2024–2029 (USD MILLION)
                        TABLE 110 ROW: FARM MANAGEMENT SOFTWARE MARKET, BY APPLICATION, 2020–2023 (USD MILLION)
                        TABLE 111 ROW: FARM MANAGEMENT SOFTWARE MARKET, BY APPLICATION, 2024–2029 (USD MILLION)
                        TABLE 112 ROW: FARM MANAGEMENT SOFTWARE MARKET, BY FARM SIZE, 2020–2023 (USD MILLION)
                        TABLE 113 ROW: FARM MANAGEMENT SOFTWARE MARKET, BY FARM SIZE, 2024–2029 (USD MILLION)
             10.5.2 MIDDLE EAST & AFRICA
                        10.5.2.1 Focus on water conservation to support adoption of farm management software
                        10.5.2.2 GCC countries
                        10.5.2.3 Rest of Middle East & Africa
 
11 COMPETITIVE LANDSCAPE (Page No. - 190)
     11.1 INTRODUCTION 
     11.2 KEY PLAYER STRATEGIES/RIGHT TO WIN 
             TABLE 114 OVERVIEW OF STRATEGIES ADOPTED BY KEY FARM MANAGEMENT SOFTWARE MARKET PLAYERS
             11.2.1 PRODUCT PORTFOLIO
             11.2.2 REGIONAL FOCUS
             11.2.3 MANUFACTURING FOOTPRINT
             11.2.4 ORGANIC/INORGANIC GROWTH STRATEGIES
     11.3 MARKET SHARE ANALYSIS 
             FIGURE 49 FARM MANAGEMENT SOFTWARE MARKET SHARE ANALYSIS, 2023
             TABLE 115 FARM MANAGEMENT SOFTWARE MARKET: DEGREE OF COMPETITION, 2023
     11.4 REVENUE ANALYSIS OF FIVE COMPANIES 
             FIGURE 50 FIVE-YEAR COMPANY REVENUE ANALYSIS OF LEADING MARKET PLAYERS
     11.5 COMPANY VALUATION AND FINANCIAL METRICS 
             FIGURE 51 ENTERPRISE VALUATION: FARM MANAGEMENT SOFTWARE MARKET
             FIGURE 52 FINANCIAL METRICS: FARM MANAGEMENT SOFTWARE MARKET
     11.6 BRAND/PRODUCT COMPARISON 
           FIGURE 53 FARM MANAGEMENT SOFTWARE: BRAND/PRODUCT COMPARISON
     11.7 COMPANY EVALUATION MATRIX: KEY PLAYERS, 2023 
             11.7.1 STARS
             11.7.2 EMERGING LEADERS
             11.7.3 PERVASIVE PLAYERS
             11.7.4 PARTICIPANTS
                        FIGURE 54 FARM MANAGEMENT SOFTWARE MARKET: COMPANY EVALUATION MATRIX, 2023
             11.7.5 COMPANY FOOTPRINT: KEY PLAYERS, 2023
                        11.7.5.1 Overall footprint
                                     FIGURE 55 FARM MANAGEMENT SOFTWARE MARKET: OVERALL FOOTPRINT (26 COMPANIES)
                        11.7.5.2 Application footprint
                                     TABLE 116 COMPANY APPLICATION FOOTPRINT
                        11.7.5.3 Offering footprint
                                     TABLE 117 COMPANY OFFERING FOOTPRINT
                        11.7.5.4 Region footprint
                                     TABLE 118 COMPANY REGION FOOTPRINT
     11.8 COMPANY EVALUATION MATRIX: STARTUPS/SMES, 2023 
             11.8.1 PROGRESSIVE COMPANIES
             11.8.2 RESPONSIVE COMPANIES
             11.8.3 DYNAMIC COMPANIES
             11.8.4 STARTING BLOCKS
                        FIGURE 56 FARM MANAGEMENT SOFTWARE MARKET: STARTUPS/SMES EVALUATION MATRIX, 2023
             11.8.5 COMPETITIVE BENCHMARKING
                        11.8.5.1 List of key start-ups/SMEs
                                     TABLE 119 FARM MANAGEMENT SOFTWARE MARKET: LIST OF KEY STARTUPS/SMES
                        11.8.5.2 Competitive benchmarking of key start-ups/SMEs
                                     TABLE 120 FARM MANAGEMENT SOFTWARE MARKET: COMPETITIVE BENCHMARKING OF KEY STARTUPS/SMES
     11.9 COMPETITIVE SCENARIOS 
             11.9.1 PRODUCT LAUNCHES AND DEVELOPMENTS
                        TABLE 121 PRODUCT LAUNCHES AND DEVELOPMENTS, JANUARY 2020– JANUARY 2024
             11.9.2 DEALS
                        TABLE 122 FARM MANAGEMENT SOFTWARE MARKET: DEALS, JANUARY 2020–JANUARY 2024
             11.9.3 OTHERS
                        TABLE 123 FARM MANAGEMENT SOFTWARE MARKET: OTHERS, JANUARY 2020-JANUARY 2024
 
12 COMPANY PROFILES (Page No. - 220)
(Business Overview, Products/Solutions/Services Offered, Recent Developments, and MnM View (Key strengths/Right to Win, Strategic Choices Made, and Weaknesses and Competitive Threats))*  
     12.1 KEY PLAYERS 
             12.1.1 AGRIVI
                        TABLE 124 AGRIVI: COMPANY OVERVIEW
                        TABLE 125 AGRIVI: PRODUCTS/SOLUTIONS/SERVICES OFFERED
                        TABLE 126 AGRIVI: PRODUCT LAUNCHES, JANUARY 2020-JANUARY 2024
                        TABLE 127 AGRIVI: DEALS, JANUARY 2020-JANUARY 2024
             12.1.2 GRANULAR INC.
                        TABLE 128 GRANULAR INC.: COMPANY OVERVIEW
                        TABLE 129 GRANULAR INC.: PRODUCTS/SOLUTIONS/SERVICES OFFERED
                        TABLE 130 GRANULAR INC.: PRODUCTS LAUNCHES, JANUARY 2020-JANUARY 2024
                        TABLE 131 GRANULAR INC.: DEALS, JANUARY 2020-JANUARY 2024
             12.1.3 TRIMBLE INC.
                        TABLE 132 TRIMBLE INC.: COMPANY OVERVIEW
                        FIGURE 57 TRIMBLE INC.: COMPANY SNAPSHOT
                        TABLE 133 TRIMBLE INC.: PRODUCTS/SOLUTIONS/SERVICES OFFERED
                        TABLE 134 TRIMBLE INC.: PRODUCTS LAUNCHES, JANUARY 2020-JANUARY 2024
                        TABLE 135 TRIMBLE INC.: DEALS, JANUARY 2020-JANUARY 2024
                        TABLE 136 TRIMBLE INC.: OTHERS, JANUARY 2020-JANUARY 2024
             12.1.4 TOPCON CORPORATION
                        TABLE 137 TOPCON CORPORATION: COMPANY OVERVIEW
                        FIGURE 58 TOPCON CORPORATION: COMPANY SNAPSHOT
                        TABLE 138 TOPCON CORPORATION: PRODUCTS/SOLUTIONS/SERVICES OFFERED
                        TABLE 139 TOPCON CORPORATION: PRODUCT LAUNCHES, JANUARY 2020-JANUARY 2024
                        TABLE 140 TOPCON CORPORATION: DEALS, JANUARY 2020-JANUARY 2024
             12.1.5 RAVEN INDUSTRIES, INC. (PART OF CNH INDUSTRIAL)
                        TABLE 141 RAVEN INDUSTRIES, INC.: COMPANY OVERVIEW
                        FIGURE 59 RAVEN INDUSTRIES, INC.: COMPANY SNAPSHOT
                        TABLE 142 RAVEN INDUSTRIES, INC.: PRODUCTS/SOLUTIONS/SERVICES OFFERED
                        TABLE 143 RAVEN INDUSTRIES, INC.: PRODUCTS LAUNCHES, JANUARY 2020-JANUARY 2024
                        TABLE 144 RAVEN INDUSTRIES: DEALS, JANUARY 2020-JANUARY 2024
                        TABLE 145 RAVEN INDUSTRIES, INC.: OTHERS, JANUARY 2020-JANUARY 2024
             12.1.6 DEERE & COMPANY
                        TABLE 146 DEERE & COMPANY: COMPANY OVERVIEW
                        FIGURE 60 DEERE & COMPANY: COMPANY SNAPSHOT
                        TABLE 147 DEERE & COMPANY: PRODUCTS/SOLUTIONS/SERVICES OFFERED
                        TABLE 148 DEERE & COMPANY: PRODUCT LAUNCHES AND DEVELOPMENTS, JANUARY 2020-JANUARY 2024
                        TABLE 149 DEERE & COMPANY: DEALS, JANUARY 2020-JANUARY 2024
             12.1.7 AGJUNCTION INC.
                        TABLE 150 AGJUNCTION INC.: COMPANY OVERVIEW
                        TABLE 151 AGJUNCTION INC.: PRODUCTS/SOLUTIONS/SERVICES OFFERED
                        TABLE 152 AGJUNCTION INC.: PRODUCTS LAUNCHES, JANUARY 2020-JANUARY 2024
                        TABLE 153 AGJUNCTION INC.: DEALS, JANUARY 2020-JANUARY 2024
             12.1.8 AGWORLD PTY LTD.
                        TABLE 154 AGWORLD PTY LTD.: COMPANY OVERVIEW
                        TABLE 155 AGWORLD PTY LTD: PRODUCTS/SOLUTIONS/SERVICES OFFERED
                        TABLE 156 AGWORLD PTY LTD: PRODUCT LAUNCHES, JANUARY 2020-JANUARY 2024
                        TABLE 157 AGWORLD PTY LTD.: DEALS, JANUARY 2020-JANUARY 2024
             12.1.9 FARMERS EDGE INC.
                        TABLE 158 FARMERS EDGE INC.: COMPANY OVERVIEW
                        FIGURE 61 FARMERS EDGE INC.: COMPANY SNAPSHOT
                        TABLE 159 FARMERS EDGE INC.: PRODUCTS/SOLUTIONS/SERVICES OFFERED
                        TABLE 160 FARMERS EDGE INC.: PRODUCTS LAUNCHES, JANUARY 2020-JANUARY 2024
                        TABLE 161 FARMERS EDGE INC.: DEALS, JANUARY 2020-JANUARY 2024
             12.1.10 CLIMATE LLC
                        TABLE 162 CLIMATE LLC: COMPANY OVERVIEW
                        TABLE 163 CLIMATE LLC: PRODUCTS/SOLUTIONS/SERVICES OFFERED
                        TABLE 164 CLIMATE LLC: PRODUCTS LAUNCHES, JANUARY 2020-JANUARY 2024
                        TABLE 165 CLIMATE LLC: DEALS, JANUARY 2020-JANUARY 2024
     12.2 OTHER PLAYERS 
             12.2.1 AFIMILK LTD.
             12.2.2 ABACO S.P.A.
             12.2.3 IBM CORPORATION
             12.2.4 MICROSOFT
             12.2.5 GEA FARM TECHNOLOGIES (GEA GROUP)
             12.2.6 SST SOFTWARE
             12.2.7 CROPX INC.
             12.2.8 CROPIN TECHNOLOGY SOLUTIONS PRIVATE LIMITED
             12.2.9 CONSERVIS
             12.2.10 GAMAYA
             12.2.11 ERUVAKA TECHNOLOGIES
             12.2.12 AG LEADER TECHNOLOGY
             12.2.13 DICKEY-JOHN
             12.2.14 DELAVAL (PART OF TETRA LAVAL GROUP)
             12.2.15 BOUMATIC
*Details on Business Overview, Products/Solutions/Services Offered, Recent Developments, and MnM View (Key strengths/Right to Win, Strategic Choices Made, and Weaknesses and Competitive Threats) might not be captured in case of unlisted companies.  
 
13 APPENDIX (Page No. - 287)
     13.1 DISCUSSION GUIDE 
     13.2 KNOWLEDGESTORE: MARKETSANDMARKETS’ SUBSCRIPTION PORTAL 
     13.3 CUSTOMIZATION OPTIONS 
     13.4 RELATED REPORTS 
     13.5 AUTHOR DETAILS 


The study involved four major activities in estimating the size of the farm management software market. Exhaustive secondary research has been conducted to collect information on the market, the peer markets, and the parent market. Both top-down and bottom-up approaches have been employed to estimate the total market size. Market breakdown and data triangulation methods have also been used to estimate the market for segments and subsegments.

Secondary Research

Revenues of companies offering farm management software have been obtained from the secondary data available through paid and unpaid sources. The revenues have also been derived by analyzing the product portfolio of key companies, and these companies have been rated according to the performance and quality of their products.

Various secondary sources have been referred to in the secondary research process for identifying and collecting information important for this study. Secondary sources include corporate filings (such as annual reports, investor presentations, and financial statements); trade, business, and professional associations; white papers; IoT technologies journals and certified publications; articles by recognized authors; gold-standard and silver-standard websites; directories; and databases.

Secondary research has been conducted mainly to obtain critical information about the market’s value chain, the total pool of key players, market classification and segmentation according to the industry trends to the bottom-most level, geographic markets, and key developments from both demand- and technology-oriented perspectives. Secondary data has been collected and analyzed to determine the overall market size, further validated by primary research.

Primary Research

Extensive primary research has been conducted after understanding and analyzing the current scenario of the farm management software market through secondary research. Several primary interviews have been conducted with key opinion leaders from both demand and supply sides across 4 major regions: Americas, Europe, Asia Pacific, and RoW. Approximately 25% of the primary interviews have been conducted with the demand side, while 75% have been conducted with the supply side. Primary data has been collected mainly through telephonic interviews, which consist of 80% of the total primary interviews. questionnaires and e-mails have also been used to collect data.

After interacting with industry experts, brief sessions were conducted with highly experienced independent consultants to reinforce the findings from our primary. This, along with the in-house subject matter experts’ opinions, has led us to the findings as described in the remainder of this report. The breakdown of primary respondents is as follows:

Farm Management Software Market
 Size, and Share

To know about the assumptions considered for the study, download the pdf brochure

Market Size Estimation

The bottom-up procedure has been employed to arrive at the overall size of the farm management software market.

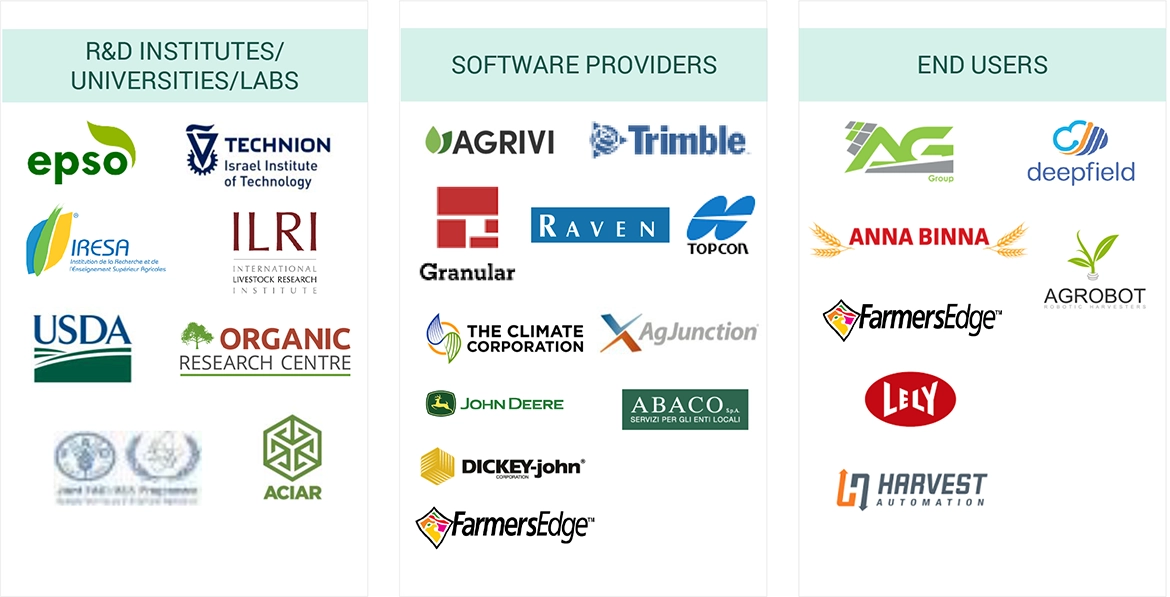
  • Analyzing the agriculture technology ecosystem in each country and identifying the major companies in the market
  • Analyzing the market for farm management software for each country
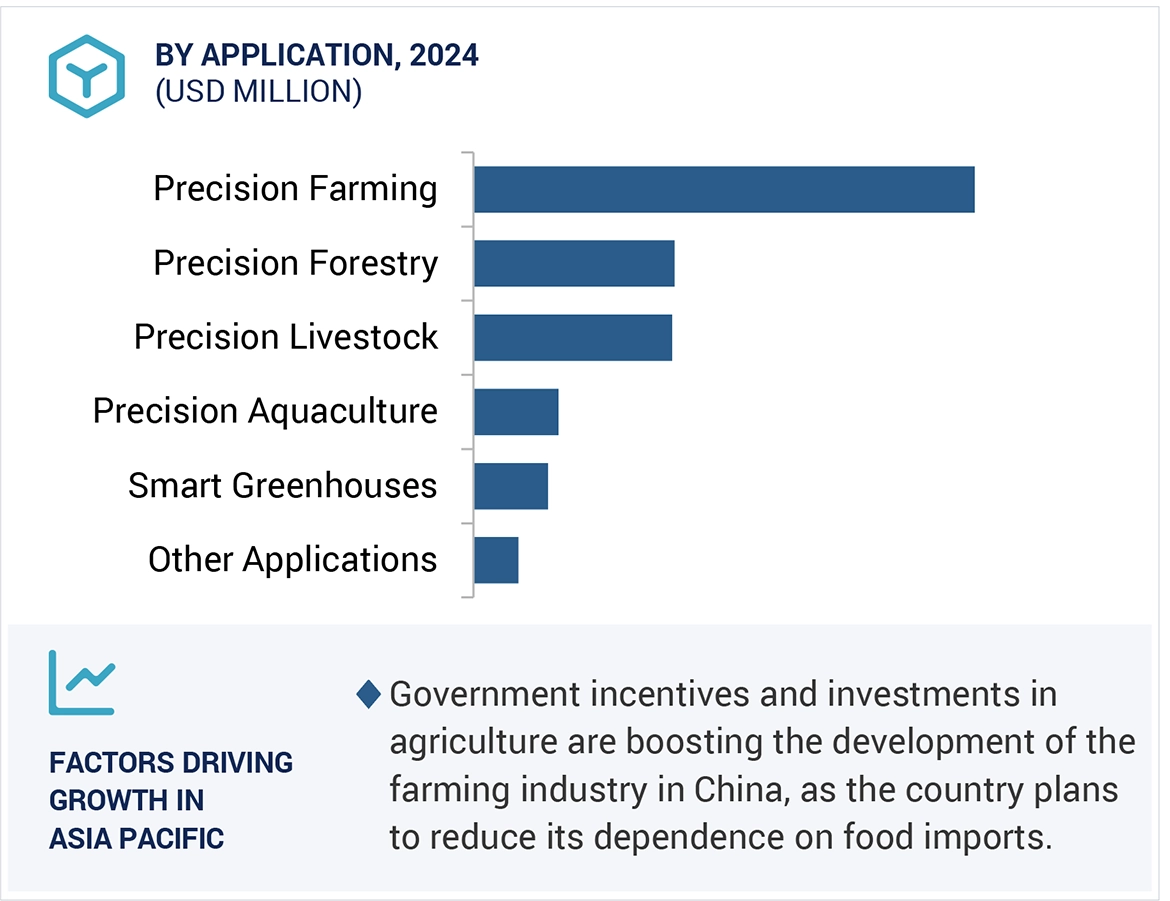
  • Identifying major farm management software applications, including precision farming, precision livestock, precision aquaculture, smart greenhouses, and precision forestry, along with the types of software and services required for various applications and sub-applications.
  • Estimating the market size in each region by summation of country-wise market size
  • Tracking the ongoing and upcoming implementation projects of farm management software by various companies in each region and forecasting the farm management software market size based on these developments and other critical parameters, including ongoing recession scenario and its impact on the farm management software market
  • Arriving at the global farm management software market size through the summation of all the regions

Farm Management Software Market
 Size, and Bottom-Up Approach

The top-down approach has been used to estimate and validate the total size of the farm management software market.

  • Initially, MarketsandMarkets focused on the top-line investment and expenditure in the ecosystems of agriculture technology, which also includes farm management software. software upgrades, and major developments in the key market area.
  • Further information was derived from the market revenue the key farm management software and service providers generated.
  • Multiple on-field discussions were conducted with key opinion leaders from each major company involved in the development of farm management software and services.
  • The geographic splits were estimated using secondary sources based on various factors, such as the number of players in a specific country and region, the level of services offered, and the type of software implemented.

Farm Management Software Market
 Size, and Top-Down Approach

Data Triangulation

After arriving at the overall size of the farm management software market through the process explained, the total market has been split into several segments and subsegments. Market breakdown and data triangulation procedures have been employed, wherever applicable, to complete the overall market engineering process and arrive at the exact statistics for all segments and subsegments. The data has been triangulated by studying various factors and trends from the demand and supply sides. The market has also been validated using the top-down and bottom-up approaches.

Market Definition

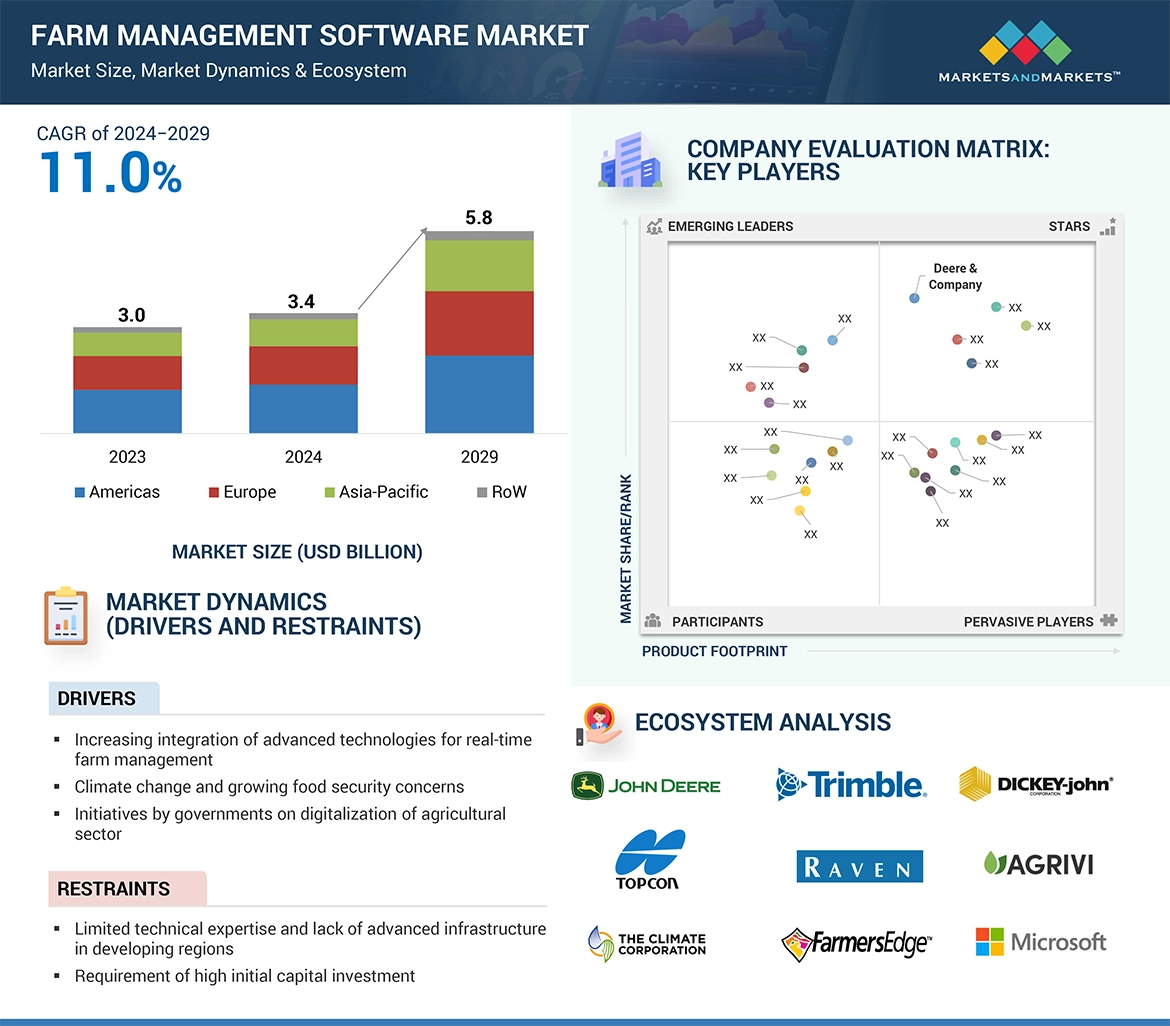
Farm management is a technique to optimize and manage farm operations by automating farm activities such as record keeping, data management, crop health analysis, livestock monitoring, and aquaculture farm optimization. The software is customized to meet specific farm requirements since each farm carries out different activities. Farm management software is used for planning, implementation, assessment, and optimization of tasks performed on farms. It helps farmers improve better plan and track, save on input and labor costs, and improve yield.

The software helps enhance farm productivity and reduce input wastage. The software is integrated with hardware equipment and devices to enhance the productivity of the farmland with the help of the Global Positioning System (GPS), sensing, and communication technologies.

Key Stakeholders

  • Satellite service providers, UAVs/drone service providers, and data collection and analysis service providers
  • Electronic components (sensors, GPSs, yield monitoring systems) and device manufacturers
  • Agriculture original equipment manufacturers (OEMs)
  • Component and device suppliers, system integrators, and distributors
  • Software providers, including Software as a Service (SaaS) and Platform as a Service (SaaS) providers
  • Data analytics service providers, agricultural IoT infrastructure providers, and technology providers
  • Standardization and testing firms
  • Government bodies such as regulatory authorities, policymakers, and agricultural ministry
  • Associations, organizations, forums, and alliances related to agriculture technology
  • Research institutes and organizations
  • Market research and consulting firms
  • Agri-food companies, contract farming companies, farm-input providers, agronomists, and independent agriculture consultants

Report Objectives

  • To define, describe, segment, and forecast the size of the farm management software market, by offering, farm size, application, and farm production planning, in terms of value
  • To forecast the market size for various segments with respect to four main regions, namely, the Americas, Europe, Asia Pacific, and Rest of the World (RoW), in terms of value
  • To provide detailed information regarding the drivers, restraints, opportunities, and challenges influencing the growth of the farm management software market
  • To study the complete value chain and allied industry segments and perform a value chain analysis of the farm management software market landscape
  • To strategically analyze macro and micromarkets1 with respect to growth trends, prospects, and their contributions to the overall market
  • To analyze industry trends, pricing data, patents and innovations, and trade data (export and import data) in the farm management software market
  • To analyze opportunities in the market for stakeholders and provide a detailed competitive landscape of the market
  • To strategically profile key players in the market and comprehensively analyze their market share/ranking and core competencies
  • To analyze competitive developments such as contracts, product launches/developments, expansions, and research & development (R&D) activities carried out by players in the farm management software market.

Available customizations:

With the given market data, MarketsandMarkets offers customizations according to the specific requirements of companies. The following customization options are available for the report:

  • Detailed analysis and profiling of additional market players based on various blocks of the supply chain
Custom Market Research Services

We will customize the research for you, in case the report listed above does not meet with your exact requirements. Our custom research will comprehensively cover the business information you require to help you arrive at strategic and profitable business decisions.

Request Customization

Instant Answers with GPT - Ask Now!

Ask real questions. Get complete answers !
Report Code
SE 4449
Published ON
Apr, 2024
Choose License Type
BUY NOW
  • SHARE
X
Request Customization
Speak to Analyst
Speak to Analyst
OR FACE-TO-FACE MEETING
PERSONALIZE THIS RESEARCH
  • Triangulate with your Own Data
  • Get Data as per your Format and Definition
  • Gain a Deeper Dive on a Specific Application, Geography, Customer or Competitor
  • Any level of Personalization
REQUEST A FREE CUSTOMIZATION
LET US HELP YOU!
  • What are the Known and Unknown Adjacencies Impacting the Farm Management Software Market
  • What will your New Revenue Sources be?
  • Who will be your Top Customer; what will make them switch?
  • Defend your Market Share or Win Competitors
  • Get a Scorecard for Target Partners
CUSTOMIZED WORKSHOP REQUEST
+1-888-600-6441
  • Call Us
  • +1-888-600-6441 (Corporate office hours)
  • +1-888-600-6441 (US/Can toll free)
  • +44-800-368-9399 (UK office hours)
CONNECT WITH US
ABOUT TRUST ONLINE
©2024 MarketsandMarkets Research Private Ltd. All rights reserved
DMCA.com Protection Status Website Feedback