
Heat Exchanger Market

Heat Exchanger Market by Type (Shell & Tube, Plate & Frame, Air Cooled), Material (Metals, Alloys, Brazing Clad Materials), End-use Industry (Chemical, Energy, HVACR, Food & Beverage, Power, Pulp & Paper), and Region - Global Forecast to 2030


HEAT EXCHANGER MARKET SIZE & SHARE
Source: Secondary Research, Interviews with Experts, MarketsandMarkets Analysis | Updated on : January 27, 2026
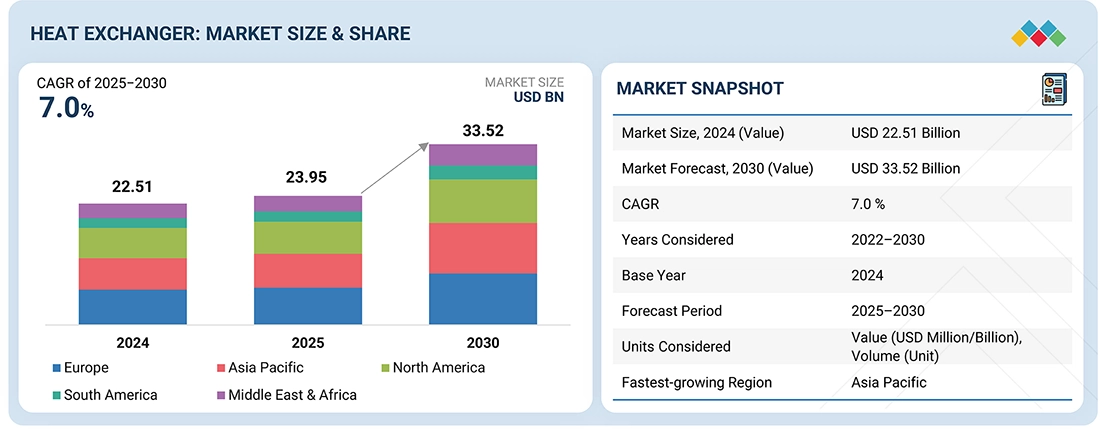
The global heat exchanger market is projected to reach USD 33.52 billion by 2030 from USD 23.95 billion in 2025, at a CAGR of 7.0%. The market for heat exchangers is experiencing robust growth, driven by growing demand from major end-use industries. The heat exchanger market is growing due to demand from key industries such as chemical processing, oil & gas, power generation, HVACR, and food and beverage. These sectors rely on heat exchangers for precise temperature control and effective heat transfer, which are vital for operational efficiency. The diverse needs of these industries are driving innovation and expansion within the market.
KEY TAKEAWAYS
-
BY TYPEThe shell & tube design is set to dominate the heat exchanger market due to its robustness, versatility, and ability to handle high pressures and temperatures. It is widely used across industries like chemical, oil & gas, and power generation for efficient heat transfer. Its proven reliability and scalability make it the preferred choice over other heat exchanger types.
-
BY MATERIALThe heat exchanger market by material type includes metals, alloys, and brazing clad materials. Metals lead the heat exchanger material segment due to their excellent thermal conductivity, durability, and resistance to high temperatures and pressures. Common metals like stainless steel, copper, and aluminum ensure efficient heat transfer and long service life. Their widespread availability and reliability make them the preferred choice across industrial applications.
-
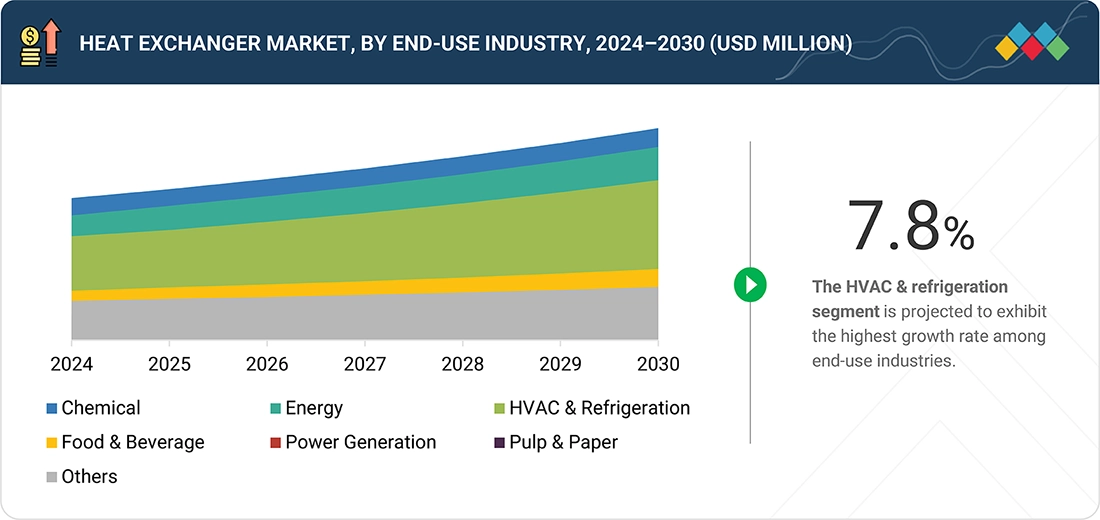
BY END-USE INDUSTRYThe heat exchanger market by end-use industry includes chemical, energy, HVAC & refrigeration, food & beverage, power, pulp & paper, and other end-use industries. The chemical industry leads the heat exchanger end-use segment due to its high demand for efficient thermal management in processes like reactors, distillation, and condensation. Heat exchangers ensure precise temperature control, enhancing process efficiency and product quality. Their critical role in large-scale chemical manufacturing drives market dominance in this sector.
-
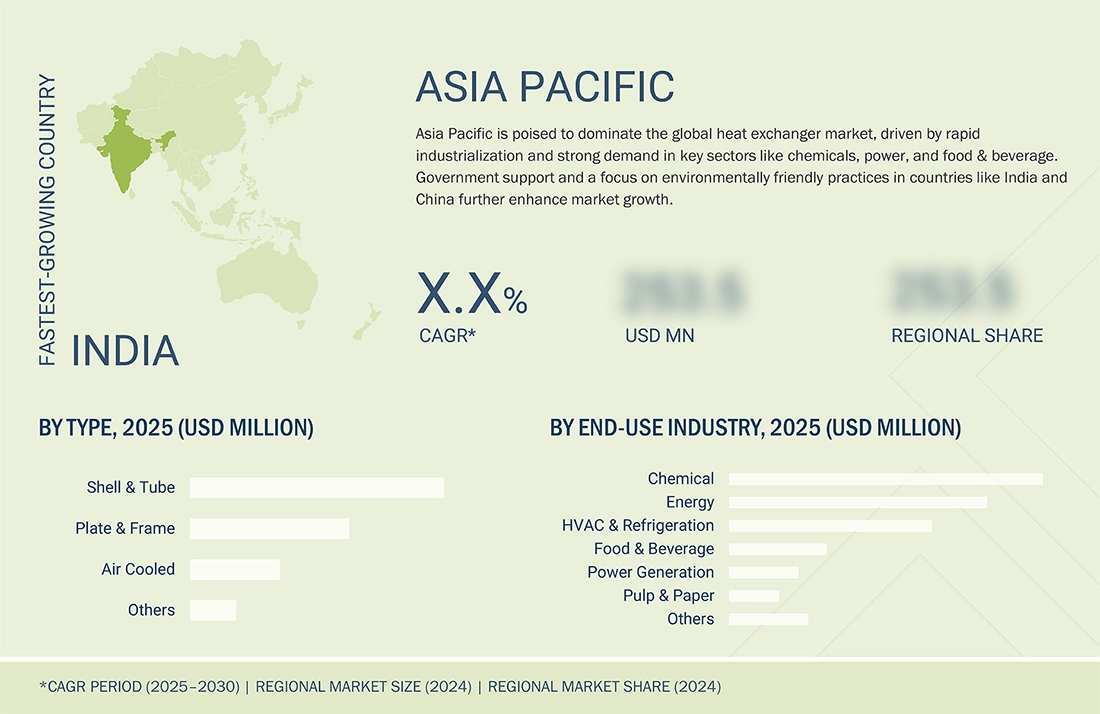
BY REGIONAsia Pacific is estimated to grow the fastest, driven by industrialization, urbanization, and rising energy efficiency demands. Expanding sectors such as HVAC, power generation, chemicals, and EVs further accelerate adoption across the region.
-
COMPETITIVE LANDSCAPEThe market is driven by strategic collaborations, capacity expansions, and technological innovations from leading players such as Alfa Laval (Sweden), Kelvion Holding GmbH (Germany), Danfoss (Denmark), Exchanger Industries Limited (Canada), Mersen (France), API Heat Transfer (US), BOYD (US), Johnson Controls (Ireland), Xylem (US), Wabtec Corporation (US), SPX Flow (US), Lennox International Inc. (US), Modine Manufacturing Company (US), Wieland (Germany), and Air Products & Chemicals, Inc. (US). These companies are heavily investing in new technologies.
The heat exchanger market is experiencing significant growth, fueled by an increasing demand for energy-efficient thermal solutions across various industries. This trend is largely attributed to the rapid expansion of industrial operations that necessitate precise temperature control and advanced heat transfer systems. Furthermore, the rising levels of industrialization in emerging economies, such as China, India, and Brazil, along with ongoing advancements in manufacturing technologies, are playing a crucial role in driving this market's development.
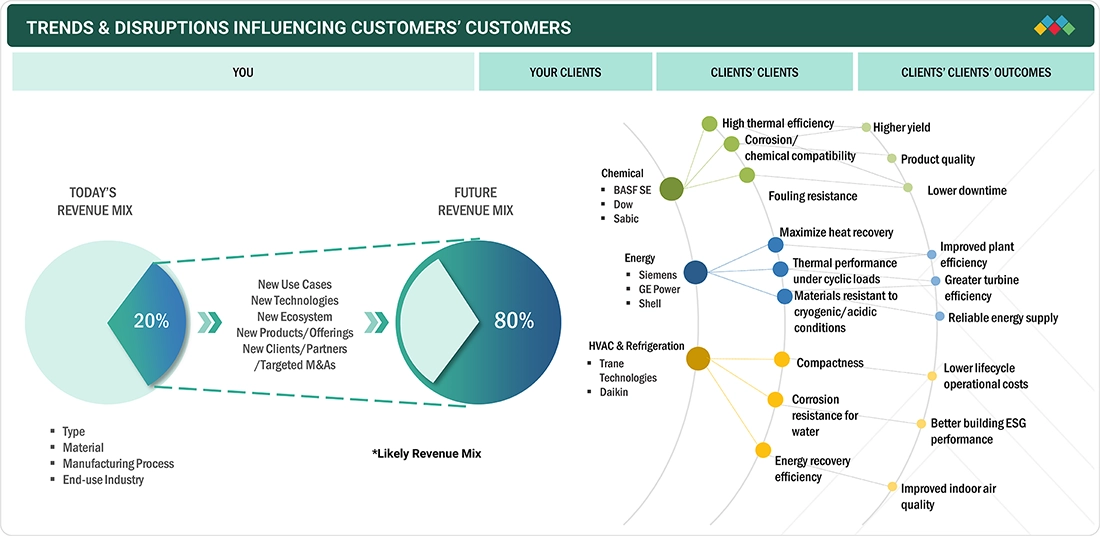
HEAT EXCHANGER MARKET TRENDS & DISRUPTIONS IMPACTING CUSTOMERS' CUSTOMERS
The heat exchanger market is expanding rapidly as industries increasingly demand efficient thermal management solutions across processes. Rising needs for energy efficiency, process optimization, and safety drive adoption across chemical, oil & gas, power generation, and HVAC sectors. Key players such as Alfa Laval, Kelvion, Xylem Inc., and SPX Corporation are advancing the market by offering versatile shell & tube, plate, and air-cooled heat exchangers capable of handling high pressures, temperatures, and corrosive environments. These innovations ensure reliable heat transfer, reduced energy consumption, and improved operational efficiency. The market growth aligns with a broader industrial modernization trend, where advanced heat exchangers are vital for sustainable operations. As industries continue to optimize processes and meet environmental standards, the demand for durable, high-performance heat exchangers is set to rise, opening new opportunities across developed and emerging regions.
Source: Secondary Research, Interviews with Experts, MarketsandMarkets Analysis
MARKET DYNAMICS
Level
-
Rising energy efficiency regulations

-
Growing demand for HVAC & refrigeration equipment

Level
-
Lack of awareness regarding energy efficiency

-
Volatility in raw material prices

Level
-
Growth in emerging markets

-
Growing number of power plants

Level
-
Huge capital investment

Source: Secondary Research, Interviews with Experts, MarketsandMarkets Analysis
Driver: Rising energy efficiency regulations
Stringent energy efficiency legislation acts as a key catalyst for the growth of the market. It influences investment decisions in various end-use sectors such as chemical, petrochemical, food & beverage, power, and HVACR. Governments and regulatory agencies enforce stricter legislation to reduce energy use, lower greenhouse emissions, and enhance process efficiency. Heat exchangers, as the core element of thermal management and waste heat recovery technology, play an essential role in achieving the goals. In the EU, for example, the Energy Efficiency Directive requires factory buildings to have better energy performance and promotes extensive adoption of high-efficiency heat recovery systems. Likewise, in America, the Department of Energy has set performance standards that indirectly promote industries that utilize high-efficiency heat exchanger technologies. China and India, the rising giants, are also introducing environmental regulations, in part to meet world climate obligations and decrease dependency on foreign energy. This regulatory push is driving retrofit of installed combustion equipment and speeding up fitment in greenfield plants, especially in energy-intensive industries such as chemicals, oil & gas, HVAC, power generation, and food processing. All these factors are driving the growth of the market.
Restraint: Volatility in raw material prices
Price fluctuations of raw materials are one of the most significant constraints on the market for heat exchangers because the manufacture of the systems relies very much on metals such as stainless steel, copper, aluminum, and titanium. The metals are chosen for the reasons of high thermal conductivity, corrosion resistance, and mechanical strength, but prices respond very sensitively to the overall market conditions. Such demand-supply fluctuations, geopolitical tensions, wars, minerals & mining policies, trade wars, and exchange rates have the potential to result in raw material prices showing high volatility. When the prices of these essential metals rise steeply, the producers will have to bear higher costs of production, which can either trim their profit margins or lead to higher product prices for buyers. Such cost risk usually results in delayed investment proposals, especially in capital expenditure-constrained businesses. Major capital projects in energy, chemical processing or heating, ventilation, and air conditioning systems, the largest heat exchanger application areas, may face capital constraints due to unscheduled cost hikes in equipment procurements. Emerging economies such as India, China, Brazil, and South Africa, where cost-sensitivity is much higher, can restrain the growth of the market due to such price volatility. Although producers attempt to mitigate this risk through long-term supply agreements or substitute materials, continued uncertainty about raw materials costs remains a significant barrier to sustained growth in markets.
Opportunity: Growth in emerging markets
The expansion of emerging markets offers a significant opportunity for the global heat exchanger market, driven by industrialization, urbanization, and enhanced manufacturing capabilities across the Asia-Pacific region, Latin America, the Middle East, and Africa. Substantial investments are being made in various industries, including power generation, oil and gas, chemical processing, HVACR, food and beverages, and water treatment. These sectors rely heavily on high-performance heat transfer systems to meet increasing energy demands and improve infrastructure. In India, ongoing industrial growth and large-scale infrastructure projects are prompting the utility and manufacturing sectors to adopt advanced heat exchanger technologies. China maintains its leadership in manufacturing and chemical processing, sustaining high demand for heat transfer equipment. Similarly, the Middle East is witnessing expansions in chemical and desalination plants, while Brazil’s advancements in oil refining and chemical manufacturing create high-value opportunities. Collectively, these developments position emerging economies as key drivers of growth in the global heat exchanger market in the coming years.
Challenge: Huge capital investment
High capital investment requirements pose a significant challenge for the heat exchanger market, especially for small and medium-sized enterprises (SMEs). The manufacturing and installation of advanced heat exchangers, such as plate & frame, shell & tube, and air-cooled types, demand substantial funding due to the need for high-quality materials like stainless steel and titanium, which provide resilience and corrosion resistance. Additionally, costs are driven up by precision engineering, compliance with safety and environmental standards, and the integration of innovative technologies. For end consumers, initial investments extend beyond equipment to include site preparation, system integration, skilled labor, and ongoing maintenance, complicating adoption, particularly in developing markets where finances are limited. Fluctuating raw material prices and volatile exchange rates further exacerbate cost uncertainty, making it challenging to secure funding. As a result, while heat exchangers are critical in sectors like power generation and oil & gas, their high capital requirements can act as a substantial barrier to entry, particularly for those with limited financial flexibility.
Heat Exchanger Market: COMMERCIAL USE CASES ACROSS INDUSTRIES
| COMPANY | USE CASE DESCRIPTION | BENEFITS |
|---|---|---|
 |
Heat exchangers are used in reactors, distillation units, condensers, and reboilers for heat transfer, cooling, and energy recovery | Improves process efficiency and product yield & enhances operational safety and compliance |
 |
Used in boiler feedwater heating, steam condensers, waste-heat recovery units, and LNG processing | Boosts power plant efficiency | Enables sustainable energy operations by lowering emissions |
 |
Cooling and heating of fluids, condensing gases, heat recovery in refineries and gas processing units | Enhances process efficiency, improves safety |
 |
Applied in air conditioning systems | Lowers operational costs |
Logos and trademarks shown above are the property of their respective owners. Their use here is for informational and illustrative purposes only.
MARKET ECOSYSTEM
The heat exchanger ecosystem analysis involves identifying and analyzing interconnected relationships among various stakeholders, including raw material suppliers, manufacturers, distributors, and end users. The raw material suppliers provide heat exchanger manufacturers with stainless steel, copper, copper alloys, and others. The distributors and suppliers establish contact between the manufacturing companies and end users to streamline the supply chain, increasing operational efficiency and profitability.
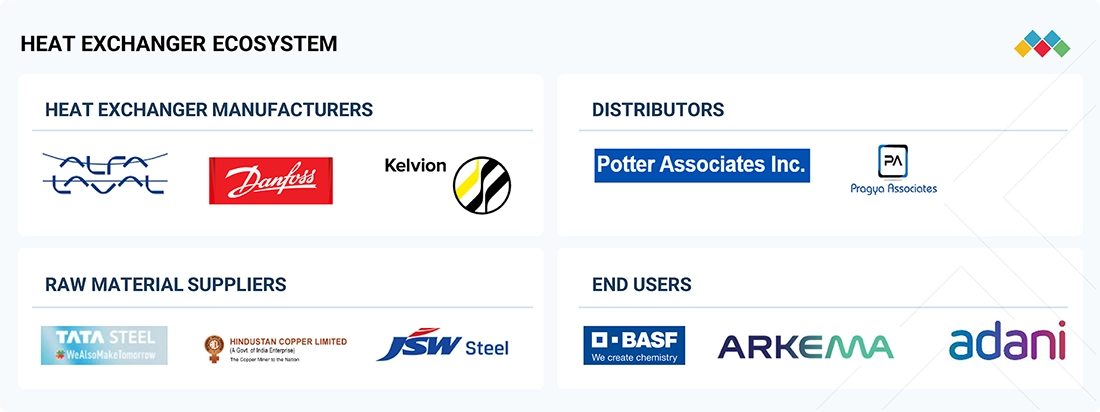
Logos and trademarks shown above are the property of their respective owners. Their use here is for informational and illustrative purposes only.
HEAT EXCHANGER MARKET OUTLOOK & FORECAST [MARKET SEGMENTS]
Source: Secondary Research, Interviews with Experts, MarketsandMarkets Analysis
Heat Exchanger Market, by End-use Industry Type
The chemical division is estimated to account for the largest proportion of the world heat exchanger market due to the sector's demand for exact temperature control, effective heat recovery, and security in handling corrosive or high-temperature fluids during processes like distillation, condensation, and chemical synthesis. Heat exchangers are invaluable in enhancing energy efficiency, minimizing operating expenses, and achieving process stability, and thus, they are unavoidable in chemical manufacturing plants. The increased need for petrochemicals, green chemistry solutions, and specialty chemicals further increases the demand for high-performance heat exchanger systems. Regionally, larger economies are driving this demand with aggressive industrial growth. In China, the chemicals industry continues to grow with investments in polymers and specialty chemicals, underpinned by strong manufacturing and urbanization growth. India is experiencing strong growth in chemicals, oil & gas, specialty chemicals, and agrochemicals manufacturing, fueled by supportive, favorable government policies, growing foreign direct investment (FDI), and domestic consumption. India's chemical industry is currently valued at USD 220 billion and expected to reach USD 1 trillion by 2040 & and almost USD 107 billion investment is estimated in India's chemical and petrochemical sector. Japan, with its advanced manufacturing capabilities, strongly focuses on energy-efficient, high-quality heat exchanger solutions to facilitate its specialty chemical and fine chemical sectors. Concurrently, Saudi Arabia and other GCC countries are also leading players in the chemical and oil & gas market, which requires reliable heat exchanger systems for risk-free and efficient operations. All these developments in the major countries strengthen the chemical industry as the largest end-use market for heat exchangers globally.
Heat Exchanger Market, by Material Type
The metallic sector is projected the largest material sector in the global heat exchanger market, dominated primarily by its high thermal conductivity, strength, and resilience to severe working conditions. Stainless steel, carbon steel, copper, aluminum, and titanium are mostly used to manufacture the heat exchanger because they efficiently transfer heat while offering maximum pressure resistance, temperature fluctuation, and corrosion resistance. Stainless steel, for example, is very commonly used in extremely corrosion-resistant applications such as food, chemicals, and pharma, while copper and aluminum are commonly utilized in HVAC, refrigeration, and power generation due to their good heat transfer rate and lightness. The dominance of this segment is also supported by its adaptability to support various heat exchanger configurations, including shell & tube, plate & frame, and air-cooled, to meet a broad array of end-use applications across various industries such as chemicals, power generation, oil & gas, and HVAC. In the high-demanding markets of Asia Pacific, rapidly evolving chemical and energy industries need to be supplemented by robust metal-based exchangers in order to handle corrosive fluids and high-pressure conditions. In Europe, strict energy efficiency and environmental norms push industries to shift towards high-performance stainless steel and titanium exchangers. Likewise, North America's growing oil & gas output and power generation activities fuel high demand for metal-based solutions with good resilience, guaranteeing the segment market leadership.
REGION
Asia Pacific to be fastest-growing region in global heat exchanger market during forecast period
Asia Pacific is estimated to dominate the world heat exchanger market due to high-speed industrialization, urbanization, and infrastructure growth in major economies like China, India, Japan, and Southeast Asian countries. The accelerating end-use industries, particularly chemical, power, food & beverage, HVACR, and others, have contributed to considerable growth in demand for high-performance heat exchangers. In India, the chemical industry is growing rapidly, driven by increasing investment and demand from personal care, home care products, and other segments. India’s chemical and petrochemical demand is expected to reach USD 1 trillion by 2040. Due to favorable policies, government support, and a strong consumer base, many companies are expanding their capacities to cater to the demand, which subsequently propels the growth of the heat exchanger market. In the same way, the strong focus of the Chinese government on helping various firms to develop chemicals that meet green requirements is fueling the heat exchanger market. Moreover, the region is also experiencing strong growth in the power and food & beverage industry, aided by a growing middle-class population, rising income, and manufacturing investments. Having a big consumer base, cost-competitive manufacturing, easy availability of raw material, and favorable regulations & policies provide the Asia Pacific region the position of being the major propelling factor for the market.
Heat Exchanger Market: COMPANY EVALUATION MATRIX
In the heat exchanger market matrix, Alfa Laval (Star), a Swedish company, leads the market through its high-quality heat exchangers, which find extensive applications in various end-use industries such as chemical, food, oil and gas, and others. API Heat Transfer (US) is gaining traction with its technological advancements in heat exchangers.

Source: Secondary Research, Interviews with Experts, MarketsandMarkets Analysis
KEY MARKET PLAYERS
MARKET SCOPE
| REPORT METRIC | DETAILS |
|---|---|
| Market Size, 2024 (Value) | USD 22.51 Billion |
| Market Forecast, 2030 | USD 33.52 Billion |
| Growth Rate | CAGR of 7.0% from 2025 to 2030 |
| Years Considered | 2024–2030 |
| Base Year | 2024 |
| Forecast Period | 2025–2030 |
| Units Considered | Value (USD Million/Billion), Volume (Unit) |
| Report Coverage | Revenue forecast, company ranking, competitive landscape, growth factors, and trends |
| Segments Covered |
|
| Regional Scope | Europe, North America, Asia Pacific, Middle East & Africa, South America |
WHAT IS IN IT FOR YOU: Heat Exchanger Market REPORT CONTENT GUIDE
DELIVERED CUSTOMIZATIONS
We have successfully delivered the following deep-dive customizations:
| CLIENT REQUEST | CUSTOMIZATION DELIVERED | VALUE ADDS |
|---|---|---|
| Interest in competitive benchmarking | Provided a comparison of top heat exchanger suppliers by product range, and market presence | Supported go-to-market strategy and positioning vs competitors) |
| Need to assess future market growth hotspots | Created a forecast model highlighting demand in APAC and other regions | Guided client’s investment priorities toward regions with the strongest growth outlook |
| Concern about raw material trends & pricing impact | Built a materials cost tracker covering stainless steel, copper, aluminum, and titanium price trends, supply risks, and recycling opportunities | Enabled procurement teams to hedge costs, secure suppliers, and explore material substitutions |
RECENT DEVELOPMENTS
- July 2025 : Alfa Laval introduced the TS25 semi-welded heat exchanger, designed to meet the growing demand for efficient and reliable thermal solutions from clean hydrogen production to heavy process industries. It provided exceptional performance, versatility, and safety, and with the compact design, it offers more capacity in less space.
- March 2025 : Alfa Laval announced that it has entered into a binding put-option agreement to acquire Fives Cryogenics, the business unit of Fives Group, for a fixed, cash and debt-free purchase price of USD 884 million. Headquartered in France, Fives Cryogenics is recognized as a global leader in cryogenic heat transfer and pump technologies. The acquisition is subject to consultations with the relevant works councils, after which the parties expect to finalize a definitive purchase agreement. This strategic move would significantly enhance Alfa Laval’s portfolio of heat transfer and pump products for gas liquefaction.
- November 2023 : Danfoss Heat Exchangers signed an agreement with Danfoss Commercial Compressors to establish an in-house test capability for propane located in the ATEX-certified lab in Trevoux, France. The new propane test facility focused on testing brazed plate heat exchangers ranging from 10 to 150kW capacity.
- September 2023 : Kelvion Holding GmbH invested USD 4.3 million to expand its production capacities in Sarstedt to meet the increasing demand for its heat exchangers across diverse end-use sectors. This expansion enables the facility to manufacture an extra 150,000 heat exchangers annually, aligning with the company's strategic goal of expanding its presence in the US market and establishing itself as the preferred partner in the Refrigeration and Data Center Industries.
- July 2021 : Exchanger Industries Limited (EIL) acquired a leading Europe-based heat exchanger manufacturer, HRS Heat Exchangers Ltd. The strategic acquisition by EIL aimed to create new business opportunities by combining HRS capabilities with EIL expansion into power generation, liquefied natural gas (LNG), renewable energy, power storage, and biofuel applications. The combined operations were expected to create growth prospects by providing environmentally sustainable heat exchange solutions to its customers.
Table of Contents
 Exclusive indicates content/data unique to MarketsandMarkets and not available with any competitors.
Methodology
The study involved four major activities for estimating the current size of the global heat exchanger market. Exhaustive secondary research was conducted to collect information on the market, the peer product market, and the parent product group market. The next step was to validate these findings, assumptions, and sizes with industry experts across the value chain of heat exchanger through primary research. Both the top-down and bottom-up approaches were employed to estimate the overall size of the heat exchanger market. After that, market breakdown and data triangulation procedures were used to determine the size of different segments and subsegments of the market.
Secondary Research
In the secondary research process, various secondary sources such as Hoovers, Factiva, Bloomberg BusinessWeek, and Dun & Bradstreet were referred, to identify and collect information for this study on the heat exchanger market. These secondary sources included annual reports, press releases & investor presentations of companies; white papers; certified publications; articles by recognized authors; regulatory bodies, trade directories, and databases.
Primary Research
The heat exchanger market comprises several stakeholders in the supply chain, which include raw material suppliers, equipment suppliers, distributors, end-product manufacturers, buyers, and regulatory organizations. Various primary sources from the supply and demand sides of the markets have been interviewed to obtain qualitative and quantitative information. The primary participants from the demand side include key opinion leaders, executives, vice presidents, and CEOs of companies in the heat exchnager market. Primary sources from the supply side include associations and institutions involved in the heat exchanger market, key opinion leaders, and processing players.

To know about the assumptions considered for the study, download the pdf brochure
Market Size Estimation
The bottom-up and top-down approaches have been used to estimate the heat exchanger market by type, material, end-use industry, and region. The research methodology used to calculate the market size includes the following steps:
- The key players in the industry and markets were identified through extensive secondary research.
- In terms of value, the industry’s supply chain and market size were determined through primary and secondary research processes.
- All percentage shares, splits, and breakdowns were determined using secondary sources and verified through primary sources.
- All possible parameters that affect the markets covered in this research study were accounted for, viewed in extensive detail, verified through primary research, and analyzed to obtain the final quantitative and qualitative data.
- The research included studying reports, reviews, and newsletters of top market players and extensive interviews with leaders such as directors and marketing executives to obtain opinions.
The following figure illustrates the overall market size estimation process employed for this study.

Data Triangulation
After arriving at the overall size of the heat exchanger market from the estimation process explained above, the total market was split into several segments and subsegments. The data triangulation and market breakdown procedures were employed, wherever applicable, to complete the overall market engineering process and arrive at the exact statistics for all segments and subsegments. The data was triangulated by studying various factors and trends from both the demand and supply sides. Along with this, the market size was validated using both the top-down and bottom-up approaches.
Market Definition
A heat exchanger is a device designed to efficiently transfer thermal energy from one fluid (liquid or gas) to another, without mixing the two. These fluids can be separated by a solid wall or may be in direct contact, depending on the exchanger’s design. Heat exchangers are essential in processes where heating or cooling is required, enabling energy recovery, temperature regulation, and process optimization across diverse industries.
Stakeholders
- Heat Exchanger Manufacturers
- Raw Material Suppliers
- Equipment Suppliers
- Regulatory Bodies and Government Agencies
- Distributors and Suppliers
- End-use Industries
- Associations and Industrial Bodies
Report Objectives
- To define, describe, and forecast the size of the heat exchanger market in terms of value and volume
- To provide detailed information regarding the key factors influencing the growth of the market (drivers, restraints, opportunities, and challenges)
- To forecast the market size based on type, material, end-use industry, and region
- To forecast the market size for the five main regions—North America, Europe, Asia Pacific (APAC), South America, and the Middle East & Africa (MEA),—along with their key countries
- To strategically analyze micromarkets with respect to individual growth trends, prospects, and contributions to the total market
- To analyze the opportunities in the market for stakeholders and provide details of the competitive landscape for the market leaders
- To strategically profile leading players and comprehensively analyze their key developments such as new product launches, expansions, and deals in the heat exchanger market
- To strategically profile key players and comprehensively analyze their market shares and core competencies
- To study the impact of AI/Gen AI on the market under study, along with the macroeconomic outlook
Key Questions Addressed by the Report
Which primary factor is propelling the growth of the heat exchanger market?
Rising growth in the chemical and power industries is the primary factor propelling the heat exchanger market.
How is the heat exchanger market segmented?
The heat exchanger market is segmented based on type, material, end-use industry, and region.
What are the major challenges in the heat exchanger market?
Huge capital investment is the major challenge in the heat exchanger market.
What are the major opportunities in the heat exchanger market?
Growth in emerging regions and the growing number of power plants are the major opportunities in the heat exchanger market.
Which region has the largest demand?
Europe holds the highest demand for heat exchangers.
Who are the major manufacturers of heat exchanger products?
The major manufacturers in the heat exchanger market include Alfa Laval (Sweden), Kelvion Holding GmbH (Germany), Danfoss (Denmark), Exchanger Industries Limited (Canada), Mersen (France), API Heat Transfer (US), BOYD (US), Johnson Controls (Ireland), Xylem (US), Wabtec Corporation (US), SPX Flow (US), Lennox International Inc. (US), Modine Manufacturing Company (US), Wieland (Germany), and Air Products & Chemicals, Inc. (US).
Need a Tailored Report?
Customize this report to your needs
Get 10% FREE Customization
Customize This ReportPersonalize This Research
- Triangulate with your Own Data
- Get Data as per your Format and Definition
- Gain a Deeper Dive on a Specific Application, Geography, Customer or Competitor
- Any level of Personalization
Let Us Help You
- What are the Known and Unknown Adjacencies Impacting the Heat Exchanger Market
- What will your New Revenue Sources be?
- Who will be your Top Customer; what will make them switch?
- Defend your Market Share or Win Competitors
- Get a Scorecard for Target Partners

Custom Market Research Services
We Will Customise The Research For You, In Case The Report Listed Above Does Not Meet With Your Requirements
Get 10% Free CustomisationTESTIMONIALS

We at Nissan Chemicals Corporation have been clients of MarketsandMarkets for more than a year now. We recently consulted MarketsandMarkets for a study, the team at MarketsandMarkets was extremely professional and organized. The business insights were very detailed and aligned well with our expectations that really helped us formulate the Business Plans and device new strategies for development themes. MarketsandMarkets offers a unique combination of expertise and dedicated engagement model. Their research findings have helped us in designing our Pricing Strategy which will make it easier for us to predict the future sales and profits for the next ten years. We look forward to working with MarketsandMarkets in the future.
VP of Strategy & New Business Development
Leading Specialty Chemical Company
The MarketsandMarkets Engagement Model, composed of both the Knowledge Store and advisory custom research, has greatly helped us in understanding our markets and making strategic decisions. The Knowledge Store is a fast way to allow everyone in our organization to understand more about most any market they are interested in. The ability to then get custom research done and get answers to specific strategic questions and market insight has been spectacular. The Markets and Markets team feel more like colleagues than vendors and their services have helped us change our culture where statements of things like growth opportunities and competitive position are always backed by industry research.

Rich Gibson,
Director, Corporate Strategy
Milliken & Company,
Leading Industrial Manufacturer of specialty chemical, floor covering, performance and protective textile materials, and healthcaremilliken.com
MarketsandMarkets is a trusted resource that helps us to better understand markets that are near-adjacencies-whether its technology, value chain or geography. Their Knowledge Store platform provides a dashboard of markets and their characteristics which is easy to use and saves us time.
Adam Shaw,
Market Development and Strategy Manager
AdvanSix Inc. USA,
An American Leader in Chemicalswww.advansix.com
The Knowledge Store from MarketsandMarkets is a valuable tool which has helped my team acquire greater insight in to the end markets that our business serves. This has enabled us to help our company build stronger strategies throughout our planning process.
TOSHIO KINOSHITA
Senior Chif Consultion Research & Consulting Division
Mitsubishi Chemical Research Corporation,
Leading Manufacturer of Chemical Productswww.mitsubishichem-res.co.jp/en/

We recently engaged with MarketsandMarkets for a study, the team not only clearly understood our business objectives but was also extremely professional in the way they handled the entire project. The study was efficiently conducted in a phase-wise manner, and the engagement model furnished us with high-quality business insights that far exceeded our expectations at each phase. We were especially happy that MarketsandMarkets could provide us with both, an English as well as a Japanese version of the study. A special thanks to the Analyst Team and Client Services Team, whose fluency in Japanese enhanced our comfort level, as we could converse with them in our preferred language.
Independent entrepreneurs
Arrow Precision
We approached MarketsandMarkets for study on Proppants Market, and their work exceeded our expectations. The study conducted was comprehensive and enabled us to view the market through the various dimensions. In addition, the team was extraordinarily responsive throughout the process and resolved our queries on time. I strongly recommend MarketsandMarkets and will certainly consider them for additional market assessments we will need in the future.
Global engineering company, Japan
Deputy Manager,
Strategic Planning OfficeThe high-quality insights shared by the MarketsandMarkets team helped us understand the pharmaceutical plant designers in a specific geography. It also captured the risks that we may likely face in communicating with our potential partners. The study would enable us identify partners, which would impact our future growth.

Still Researching the
Heat Exchanger Ecosystem?
See the competitors, opportunities, and growth signals shaping it - instantly.
Generate 15+ consulting-grade strategic insights tailored to your growth question.


Growth opportunities and latent adjacency in Heat Exchanger Market