Human Augmentation Market

Human Augmentation Market Size, Share, Statistics and Industry Growth Analysis Report by Wearable (Wristwear, Bodywear, Footwear, Eyewear), AR (Head-mounted display), VR (Head-up display), Biometric (Fingerprint, Face, Iris), Exoskeleton (Powered, Passive), IVA (Chatbot), Functionality - Global Forecast to 2028

Report Code: SE 3166 Oct, 2023, by marketsandmarkets.com

[294 Pages Report] The global Human Augmentation Market Size is expected to be valued at USD 253.6 Billion in 2023 and is projected to reach USD 545.1 Billion by 2028; it is expected to grow at a CAGR of 16.5% from 2023 to 2028.

Product launches, acquisitions, partnerships, collaborations, agreements, and expansions are the major growth strategies adopted by the human augmentation industry players. These strategies have enabled them to efficiently fulfill the growing demand for human augmentation from different end-user industries and expand their global footprint by offering their products in all the major regions.

Human Augmentation Market

Human Augmentation Market

Human Augmentation Market Forecast to 2028

To know about the assumptions considered for the study, Request for Free Sample Report

Human Augmentation Market Dynamics

Driver: Growth in Virtual Reality (VR) and Augmented Reality (AR) technologies

The  Virtual Reality (VR) and Augmented Reality (AR) technologies is a significant driver for the human augmentation market growth, as these immersive technologies enhance training, simulation, and real-time data visualization, allowing users to interact with digital information and objects in ways that augment their skills and experiences, whether in fields like healthcare, education, or workplace training, thereby expanding the applications and adoption of human augmentation technologies.

Restraint: High cost of technology

One significant restraint in the human augmentation market is the high cost associated with developing and implementing these advanced technologies. The research, development, and manufacturing of human augmentation solutions involve cutting-edge materials, intricate engineering, and sophisticated software. These factors result in high initial capital investments, making the technology expensive for both developers and end-users. The cost of research and clinical trials to ensure safety and efficacy also adds to the overall expense.

Opportunity: Growing adoption of technologies in military and defense

The growing adoption of advanced technologies in the aerospace and defense sectors presents a significant opportunity for the human augmentation market. In these fields, technological advancements are often a matter of life and death, making the integration of human augmentation technologies crucial. Exoskeletons, wearable devices, augmented reality (AR), and cognitive enhancements are being employed to enhance the physical and cognitive capabilities of soldiers, pilots, and ground personnel. These technologies improve soldier performance, reduce the physical strain of lifting heavy equipment, and provide critical information through heads-up displays.

Challenge: Safety and liability issues

The human augmentation market presents a significant challenge in addressing safety and liability issues associated with the adoption of these technologies. As human augmentation technologies become more integrated into various aspects of life, including healthcare, the workplace, and everyday activities, ensuring the safety of users and establishing clear liability frameworks becomes crucial. There's a risk of unforeseen health complications, such as allergic reactions to implanted devices or cyberattacks targeting wearable technologies.

Human Augmentation Market Ecosystem

The human augmentation market is dominated by established and financially sound manufacturers with extensive experience in the industry. These companies have diversified product portfolios, cutting-edge technologies, and strong global sales and marketing networks. Leading players in the market include Samsung from South Korea, Alphabet Incorporation from US, Apple Inc. from US, Meta from US, Microsoft from US.

Human Augmentation Market by Ecosystem

Based on product type, the biometric systems market for human augmentation to hold second highest market share during the forecast period

With increasing concerns about security in various sectors, such as finance, healthcare, and government, the demand for robust authentication and identification methods is growing. Biometric systems offer highly secure and reliable ways to verify and validate individual identities. Ongoing advancements in biometric technology, including facial recognition, fingerprint scanning, and iris recognition, have made these systems more accurate, accessible, and cost-effective, increasing their adoption in various industries.

Based on functionality, the non body-worn market for human augmentation to hold second highest market share during the forecast period

Non-body-worn devices, such as brain-computer interfaces (BCIs) and neural implants, offer the potential to enhance cognitive and physical performance without the need for external wearables. BCIs enable direct communication between the brain and external devices, allowing for improved control and interaction. Regulatory bodies in healthcare are increasingly approving and regulating the use of non-body-worn medical devices, providing a supportive environment for their development and adoption.

Based on end-user, the medical end-user market for human augmentation to hold second highest market share during the forecast period

The medical field is constantly innovating, and human augmentation technologies play a vital role in improving healthcare outcomes. Medical augmentations include wearable health devices, robotic surgery systems, and neural implants, which enhance patient care and treatment. Remote patient monitoring and telemedicine are on the rise. Wearable medical devices allow healthcare providers to monitor patients' vital signs and health conditions remotely, leading to better care and early interventions.

Human augmentation market in Asia Pacific to hold the second highest market share during the forecast period

The Asia Pacific region, including countries like China, Japan, and South Korea, is known for its rapid technological advancements. These nations invest heavily in research and development, fostering innovation in human augmentation technologies. Asia Pacific countries are experiencing an increased demand for healthcare services. This has led to the development of medical augmentations, wearable medical devices, and surgical robotics, all of which contribute to the growth of the human augmentation market.

Human Augmentation Market by Region

Human Augmentation Market Statistics by Region

To know about the assumptions considered for the study, download the pdf brochure

Key Market Players

The human augmentation companies is dominated by players such Samsung (South Korea), Alphabet Incorporation (US), Apple Inc. (US), Meta (US), Microsoft (US),  and others

Human Augmentation Market Report Scope

Report Metric

Details

Estimated Market Size in 2023

USD 253.6 Billion

Projected Market Size in 2028

USD 545.1 Billion

Growth Rate

CAGR of 16.5%

Market size available for years

2019—2028

Base year

2022

Forecast period

2023—2028

Forecast Units

USD Millions/USD Billions and Million Units

Segments Covered

By Product Type, By Technology, By Functionality, and By End-User

Geographic regions covered

North America, Europe, Asia Pacific, and RoW

Companies covered

Samsung (South Korea), Alphabet Incorporation (US), Apple Inc. (US), Meta (US), Microsoft (US), Sony Group Corporation (Japan), Ekso Bionics (US), Vuzix (US), Garmin Ltd. (US), Fossil Group Inc. (US), B-Temia (Canada), Casio Computers Co., Ltd. (Japan), ReWalk Robotics (US), Cyberdyne Inc. (Japan).

A total of 29 players are covered.

Human Augmentation Market Highlights

The study categorizes the human augmentation market based on the following segments:

Segment

Subsegment

By Product Type

  • Wearable Devices
  • Augmented Reality Devices
  • Virtual Reality Devices
  • Exoskeletons
  • Biometric Systems
  • Intelligent Virtual Assistants

By Technology

  • Artificial Intelligence (AI) Integration
  • Quantum Computing Augmentation
  • Biohacking and Bio-Augmentation

By Functionality

  • Body-worn
  • Non Body-worn

By End-user

  • Consumer
  • Commercial
  • Medical
  • Aerospace & Defense
  • Industrial
  • Other end-users

By Region

  • North America
  • Europe
  • Asia Pacific
  • RoW

Recent Developments

  • In September 2023, Apple Watch Series 9 also has a new 4-core Neural Engine that can process machine learning tasks up to twice as fast, when compared with Apple Watch Series 8. The power efficiency of the S9 SiP allows Apple Watch Series 9 to maintain all-day 18-hour battery life.
  • In September 2023, Fitbit launched Charge 6 fitness tracker. It has most accurate heart rate on a fitness tracker and the ability to connect to compatible gym equipment.
  • In July 2023, Garmin the launch of two powerful and feature-rich outdoor smartwatch series:  the fenix 7 Pro and epix Pro Series. These next-generation smartwatches are designed to meet the demands of athletes, adventurers, and fitness enthusiasts, providing them with the ultimate performance and tracking capabilities.
  • In June 2023, Samsung launched its next generation Galaxy Watch6 series. Galaxy Watch6 series now offers in-depth analysis of Sleep Score Factors — total sleep time, sleep cycle, awake time, plus physical and mental recovery to help users understand the quality of sleep received each night.
  • In April 2023, Casio launched the smartwatch. The smartwatch has a built-in optical sensor which can be used to track your heart rate, and you can also track your blood oxygen levels with the gadget. An accelerometer tracks your steps though the wearables do not have GPS; linking the watch to your smartphone enables you to track your distance, and route travelled while walking or running.
  • In February 2023, Sony launched the VR glasses. These are virtual reality glasses that were released in 2023. They have the highest pixel density display among commercial OLED panels. PlayStation VR2 can be used with the PlayStation 5 console.
  • In October 2022, Fossil launched the Gen 6 Wellness edition smartwatch powered by Google’s updated Wear OS 3 platform. The Fossil Gen 6 Wellness edition features Snapdragon Wear 4100+, fast charging, and Bluetooth connectivity above 5.0.
  • In August 2022, Vuzix introduced Blade 2 smart glasses, its third generation Blade model. Configured primarily for commercial use, Vuzix Blade 2 smart glasses pack a power efficient high performance Qualcomm processor that now runs Android 11 in support of a large variety of enterprise-focused apps.

Frequently Asked Questions:

To speak to our analyst for a discussion on the above findings, click Speak to Analyst

TABLE OF CONTENTS
 
1 INTRODUCTION (Page No. - 34)
    1.1 STUDY OBJECTIVES 
    1.2 MARKET DEFINITION 
           1.2.1 INCLUSIONS AND EXCLUSIONS
    1.3 STUDY SCOPE 
           1.3.1 MARKETS COVERED
                    FIGURE 1 HUMAN AUGMENTATION MARKET SEGMENTATION
           1.3.2 REGIONAL SCOPE
           1.3.3 YEARS CONSIDERED
    1.4 CURRENCY CONSIDERED 
    1.5 STAKEHOLDERS 
    1.6 SUMMARY OF CHANGES 
    1.7 RECESSION IMPACT 
 
2 RESEARCH METHODOLOGY (Page No. - 39)
    2.1 RESEARCH DATA 
           FIGURE 2 HUMAN AUGMENTATION MARKET: RESEARCH DESIGN
           2.1.1 SECONDARY DATA
                    2.1.1.1 Major secondary sources
                    2.1.1.2 Key data from secondary sources
           2.1.2 PRIMARY DATA
                    2.1.2.1 Primary interviews with experts
                    2.1.2.2 Key data from primary sources
                    2.1.2.3 Key industry insights
                    2.1.2.4 Breakdown of primaries
           2.1.3 SECONDARY AND PRIMARY RESEARCH
    2.2 MARKET SIZE ESTIMATION 
           FIGURE 3 RESEARCH FLOW OF MARKET SIZE ESTIMATION
           2.2.1 BOTTOM-UP APPROACH
                    2.2.1.1 Approach to estimate market size using bottom-up analysis (supply side)
                               FIGURE 4 MARKET SIZE ESTIMATION (SUPPLY SIDE): REVENUE FROM SALES OF HUMAN AUGMENTATION PRODUCTS AND SOLUTIONS
                               FIGURE 5 MARKET SIZE ESTIMATION: BOTTOM-UP APPROACH
           2.2.2 TOP-DOWN APPROACH
                    2.2.2.1 Approach to estimate market size using top-down analysis (supply side)
                               FIGURE 6 MARKET SIZE ESTIMATION: TOP-DOWN APPROACH
    2.3 DATA TRIANGULATION 
           FIGURE 7 DATA TRIANGULATION
    2.4 RESEARCH ASSUMPTIONS 
    2.5 RISK ASSESSMENT 
           TABLE 1 RISK FACTOR ANALYSIS
    2.6 PARAMETERS CONSIDERED TO ANALYZE RECESSION IMPACT ON HUMAN AUGMENTATION MARKET 
    2.7 LIMITATIONS 
 
3 EXECUTIVE SUMMARY (Page No. - 52)
    3.1 GROWTH RATE ASSUMPTIONS/FORECAST 
           FIGURE 8 WEARABLE DEVICES SEGMENT TO ACCOUNT FOR LARGEST SHARE OF HUMAN AUGMENTATION MARKET DURING FORECAST PERIOD
           FIGURE 9 BODY-WORN SEGMENT TO REGISTER HIGHER CAGR IN HUMAN AUGMENTATION MARKET DURING FORECAST PERIOD
           FIGURE 10 CONSUMER SEGMENT TO COMMAND LARGEST SHARE OF HUMAN AUGMENTATION DURING FORECAST PERIOD
           FIGURE 11 NORTH AMERICA ACCOUNTED FOR LARGEST SHARE OF HUMAN AUGMENTATION MARKET IN 2022
 
4 PREMIUM INSIGHTS (Page No. - 56)
    4.1 ATTRACTIVE OPPORTUNITIES FOR PLAYERS IN HUMAN AUGMENTATION MARKET 
           FIGURE 12 TECHNOLOGICAL ADVANCEMENTS IN VARIOUS INDUSTRIES TO DRIVE MARKET
    4.2 NORTH AMERICA: HUMAN AUGMENTATION MARKET, BY COUNTRY AND PRODUCT TYPE 
           FIGURE 13 US AND WEARABLE DEVICES TO HOLD LARGEST SHARE OF NORTH AMERICA HUMAN AUGMENTATION MARKET IN 2023
    4.3 NORTH AMERICA: HUMAN AUGMENTATION MARKET, BY COUNTRY 
           FIGURE 14 US TO HOLD LARGEST SHARE OF HUMAN AUGMENTATION MARKET IN NORTH AMERICA DURING FORECAST PERIOD
    4.4 HUMAN AUGMENTATION MARKET, BY COUNTRY 
           FIGURE 15 HUMAN AUGMENTATION MARKET IN CHINA TO RECORD HIGHEST CAGR FROM 2023 TO 2028
 
5 MARKET OVERVIEW (Page No. - 59)
    5.1 INTRODUCTION 
    5.2 MARKET DYNAMICS 
           FIGURE 16 HUMAN AUGMENTATION MARKET: DRIVERS, RESTRAINTS, OPPORTUNITIES, AND CHALLENGES
           5.2.1 DRIVERS
                    5.2.1.1 Growth in virtual reality (VR) and augmented reality (AR) technologies
                    5.2.1.2 Advancements in medical technology
                    5.2.1.3 Increasing adoption of wearable devices
                    5.2.1.4 Growing adoption of advanced technologies in sports
                               FIGURE 17 IMPACT ANALYSIS OF DRIVERS ON HUMAN AUGMENTATION MARKET
           5.2.2 RESTRAINTS
                    5.2.2.1 High costs associated with human augmentation technologies
                    5.2.2.2 Integration issues with existing systems
                               FIGURE 18 IMPACT ANALYSIS OF RESTRAINTS ON HUMAN AUGMENTATION MARKET
           5.2.3 OPPORTUNITIES
                    5.2.3.1 Growing adoption of human augmentation technologies in military and defense sector
                    5.2.3.2 Shift toward remote work and telemedicine
                    5.2.3.3 Emerging applications of human augmentation technologies in gaming and entertainment industries
                               FIGURE 19 IMPACT ANALYSIS OF OPPORTUNITIES IN HUMAN AUGMENTATION MARKET
           5.2.4 CHALLENGES
                    5.2.4.1 Long-term health effects and biocompatibility issues related to prolonged use of human augmentation technologies
                    5.2.4.2 Safety and liability issues associated with augmentation devices
                               FIGURE 20 IMPACT ANALYSIS OF CHALLENGES ON HUMAN AUGMENTATION MARKET
    5.3 VALUE CHAIN ANALYSIS 
           FIGURE 21 HUMAN AUGMENTATION MARKET: VALUE CHAIN ANALYSIS
    5.4 ECOSYSTEM MAPPING 
           FIGURE 22 KEY PLAYERS IN HUMAN AUGMENTATION MARKET
           TABLE 2 HUMAN AUGMENTATION MARKET: ROLE OF COMPANIES IN ECOSYSTEM
    5.5 PORTER'S FIVE FORCES ANALYSIS 
           TABLE 3 IMPACT OF PORTER'S FIVE FORCES ON HUMAN AUGMENTATION MARKET
           FIGURE 23 HUMAN AUGMENTATION MARKET: PORTER'S FIVE FORCES ANALYSIS
           5.5.1 THREAT OF NEW ENTRANTS
           5.5.2 THREAT OF SUBSTITUTES
           5.5.3 BARGAINING POWER OF SUPPLIERS
           5.5.4 BARGAINING POWER OF BUYERS
           5.5.5 INTENSITY OF COMPETITIVE RIVALRY
    5.6 KEY STAKEHOLDERS AND BUYING CRITERIA 
           5.6.1 KEY STAKEHOLDERS IN BUYING PROCESS
                    FIGURE 24 INFLUENCE OF STAKEHOLDERS ON BUYING PROCESS FOR TOP 3 END USERS
                    TABLE 4 INFLUENCE OF STAKEHOLDERS ON BUYING PROCESS FOR TOP 3 END USERS (%)
           5.6.2 BUYING CRITERIA
                    FIGURE 25 KEY BUYING CRITERIA FOR TOP 3 END USERS
                    TABLE 5 KEY BUYING CRITERIA FOR TOP 3 END USERS
    5.7 TRENDS/DISRUPTIONS IMPACTING CUSTOMER BUSINESS 
           FIGURE 26 TRENDS/DISRUPTIONS IMPACTING CUSTOMER BUSINESS
    5.8 PRICING ANALYSIS 
           FIGURE 27 AVERAGE SELLING PRICE TRENDS OF PRODUCTS OFFERED BY KEY PLAYERS, BY END USER
           TABLE 6 AVERAGE SELLING PRICE TRENDS, BY REGION (USD)
           TABLE 7 PRICING ANALYSIS OF PRODUCTS OFFERED BY KEY PLAYERS, BY APPLICATION (USD)
    5.9 CASE STUDY ANALYSIS 
           TABLE 8 PFIZER COLLABORATED WITH MAGIC LEAP TO DEVELOP MIXED-REALITY SOLUTION FOR DRUG DISCOVERY AND VISUALIZATION
           TABLE 9 TOYOTA MOTOR MANUFACTURING IMPLEMENTED EXOSKELETONS FROM EKSO BIONICS IN ITS MANUFACTURING FACILITIES
           TABLE 10 GENERAL MOTORS PARTNERED WITH SARCOS ROBOTICS TO DEPLOY WEARABLE EXOSKELETONS FOR FACTORY WORKERS
           TABLE 11 SIEMENS POWER GENERATION SERVICES COLLABORATED WITH REALWEAR TO ENHANCE REMOTE TECHNICAL SUPPORT USING AR TECHNOLOGY
           TABLE 12 MERCEDES-BENZ STREAMLINED REPAIR PROCEDURES BY EQUIPPING TECHNICIANS WITH GOOGLE’S GLASS ENTERPRISE EDITION AR GLASSES
    5.10 TECHNOLOGY ANALYSIS 
           5.10.1 KEY TECHNOLOGIES
                    5.10.1.1 Exoskeletons
                    5.10.1.2 Augmented reality (AR) and virtual reality (VR)
                    5.10.1.3 Brain-computer interfaces (BCIs)
                    5.10.1.4 Biotechnology and biohacking
                    5.10.1.5 Prosthetics and bionics
           5.10.2 COMPLEMENTARY TECHNOLOGIES
                    5.10.2.1 Artificial intelligence (AI)
                    5.10.2.2 Internet of Things (IoT)
                    5.10.2.3 Biometrics and biosensors
 
           5.10.3 ADJACENT TECHNOLOGIES
                    5.10.3.1 Biomechanics and robotics
                    5.10.3.2 Biotechnology and regenerative medicine
                    5.10.3.3 Sensors and wearable technology
                    5.10.3.4 Materials science
    5.11 PATENT ANALYSIS 
           FIGURE 28 NUMBER OF PATENTS GRANTED IN HUMAN AUGMENTATION MARKET, 2012–2022
           TABLE 13 LIST OF FEW PATENTS IN HUMAN AUGMENTATION MARKET, 2020–2022
    5.12 TRADE ANALYSIS 
           TABLE 14 IMPORT DATA, BY COUNTRY, 2018–2022 (USD MILLION)
           FIGURE 29 IMPORT DATA, BY COUNTRY, 2018–2022 (USD MILLION)
           TABLE 15 EXPORT DATA, BY COUNTRY, 2018–2022 (USD MILLION)
           FIGURE 30 EXPORT DATA, BY COUNTRY, 2018–2022 (USD MILLION)
    5.13 TARIFF ANALYSIS 
           TABLE 16 MFN TARIFFS FOR HS CODE 9021-COMPLIANT PRODUCTS EXPORTED BY US
           TABLE 17 MFN TARIFFS FOR HS CODE 9021-COMPLIANT PRODUCTS EXPORTED BY CHINA
           TABLE 18 MFN TARIFF FOR HS CODE 9021-COMPLIANT PRODUCTS EXPORTED BY JAPAN
    5.14 STANDARDS AND REGULATORY LANDSCAPE 
           5.14.1 REGULATORY BODIES, GOVERNMENT AGENCIES, AND OTHER ORGANIZATIONS
           TABLE 19 NORTH AMERICA: LIST OF REGULATORY BODIES, GOVERNMENT AGENCIES, AND OTHER ORGANIZATIONS
           TABLE 20 EUROPE: LIST OF REGULATORY BODIES, GOVERNMENT AGENCIES, AND OTHER ORGANIZATIONS
           TABLE 21 ASIA PACIFIC: LIST OF REGULATORY BODIES, GOVERNMENT AGENCIES, AND OTHER ORGANIZATIONS
           TABLE 22 ROW: LIST OF REGULATORY BODIES, GOVERNMENT AGENCIES, AND OTHER ORGANIZATIONS
           5.14.2 STANDARDS & REGULATIONS RELATED TO HUMAN AUGMENTATION MARKET
                    5.14.2.1 Restriction of hazardous substances (RoHS) directive
           5.14.3 AMERICAN SOCIETY FOR TESTING AND MATERIALS (ASTM)
    5.15 KEY CONFERENCES AND EVENTS, 2023–2024 
           TABLE 23 HUMAN AUGMENTATION MARKET: DETAILED LIST OF CONFERENCES AND EVENTS
 
6 HUMAN AUGMENTATION MARKET, BY PRODUCT TYPE (Page No. - 92)
    6.1 INTRODUCTION 
           FIGURE 31 EXOSKELETONS TO RECORD HIGHEST CAGR IN HUMAN AUGMENTATION MARKET DURING FORECAST PERIOD
           TABLE 24 HUMAN AUGMENTATION MARKET, BY PRODUCT TYPE, 2019–2022 (USD BILLION)
           TABLE 25 HUMAN AUGMENTATION MARKET, BY PRODUCT TYPE, 2023–2028 (USD BILLION)
    6.2 WEARABLE DEVICES 
           TABLE 26 WEARABLE DEVICES: HUMAN AUGMENTATION MARKET, BY TYPE, 2019–2022 (USD BILLION)
           TABLE 27 WEARABLE DEVICES: HUMAN AUGMENTATION MARKET, BY TYPE, 2023–2028 (USD BILLION)
           TABLE 28 WEARABLE DEVICES: HUMAN AUGMENTATION MARKET, BY TYPE, 2019–2022 (MILLION UNITS)
           TABLE 29 WEARABLE DEVICES: HUMAN AUGMENTATION MARKET, BY TYPE, 2023–2028 (MILLION UNITS)
           TABLE 30 WEARABLE DEVICES: HUMAN AUGMENTATION MARKET, BY APPLICATION, 2019–2022 (USD BILLION)
           TABLE 31 WEARABLE DEVICES: HUMAN AUGMENTATION MARKET, BY APPLICATION, 2023–2028 (USD BILLION)
           TABLE 32 WEARABLE DEVICES: HUMAN AUGMENTATION MARKET, BY REGION, 2019–2022 (USD BILLION)
           TABLE 33 WEARABLE DEVICES: HUMAN AUGMENTATION MARKET, BY REGION, 2023–2028 (USD BILLION)
           6.2.1 BODYWEAR
                    TABLE 34 BODYWEAR: HUMAN AUGMENTATION MARKET FOR WEARABLE DEVICES, BY TYPE, 2019–2022 (USD BILLION)
                    TABLE 35 BODYWEAR: HUMAN AUGMENTATION MARKET FOR WEARABLE DEVICES, BY TYPE, 2023–2028 (USD BILLION)
                    6.2.1.1 Innerwear
                               6.2.1.1.1 Growing demand for real-time health data among fitness enthusiasts to fuel segmental growth
                    6.2.1.2 Outerwear
                               6.2.1.2.1 Growing interest in outdoor activities to fuel demand for outerwear devices
           6.2.2 FOOTWEAR
                    TABLE 36 FOOTWEAR: HUMAN AUGMENTATION MARKET FOR WEARABLE DEVICES, BY TYPE, 2019–2022 (USD BILLION)
                    TABLE 37 FOOTWEAR: HUMAN AUGMENTATION MARKET FOR WEARABLE DEVICES, BY TYPE, 2023–2028 (USD BILLION)
                    6.2.2.1 Special-purpose footwear
                               6.2.2.1.1 Growing prevalence of orthopedic and musculoskeletal conditions to drive demand for special-purpose footwear
                    6.2.2.2 Casual footwear
                               6.2.2.2.1 Increasing interest in fitness and health monitoring to drive segmental growth
           6.2.3 WRISTWEAR
                    TABLE 38 WRISTWEAR: HUMAN AUGMENTATION MARKET, BY TYPE, 2019–2022 (USD BILLION)
                    TABLE 39 WRISTWEAR: HUMAN AUGMENTATION MARKET, BY TYPE, 2023–2028 (USD BILLION)
                    6.2.3.1 Smartwatch
                               6.2.3.1.1 Increasing focus of fitness enthusiasts on tracking health and fitness parameters to boost demand for smartwatches
                    6.2.3.2 Wristband
                               6.2.3.2.1 Increasing use of wristbands to enhance functioning of daily life to propel market growth
           6.2.4 EYEWEAR
                    6.2.4.1 Increasing demand for AR experiences to boost adoption of eyewear
           6.2.5 NECKWEAR
                    6.2.5.1 Rising adoption of neckwear for posture correction to drive segmental growth
           6.2.6 OTHERS
                    TABLE 40 OTHERS: HUMAN AUGMENTATION MARKET, BY TYPE, 2019–2022 (USD BILLION)
                    TABLE 41 OTHERS: HUMAN AUGMENTATION MARKET, BY TYPE, 2023–2028 (USD BILLION)
                    6.2.6.1 Ring scanners
                    6.2.6.2 Body-worn cameras
                    6.2.6.3 Implants
           6.2.7 APPLICATIONS OF WEARABLE DEVICES
                    6.2.7.1 Consumer
                    6.2.7.2 Healthcare
                    6.2.7.3 Enterprise & industrial
                    6.2.7.4 Others
    6.3 AUGMENTED REALITY DEVICES 
           TABLE 42 AR DEVICES: HUMAN AUGMENTATION MARKET, BY OFFERING, 2019–2022 (USD BILLION)
           TABLE 43 AR DEVICES: HUMAN AUGMENTATION MARKET, BY OFFERING, 2023–2028 (USD BILLION)
           TABLE 44 AR DEVICES: HUMAN AUGMENTATION MARKET, BY REGION, 2019–2022 (USD BILLION)
           TABLE 45 AR DEVICES: HUMAN AUGMENTATION MARKET, BY REGION, 2023–2028 (USD BILLION)
           6.3.1 HARDWARE
                    TABLE 46 HARDWARE: HUMAN AUGMENTATION MARKET FOR AR DEVICES, BY TYPE, 2019–2022 (USD BILLION)
                    TABLE 47 HARDWARE: HUMAN AUGMENTATION MARKET FOR AR DEVICES, BY TYPE, 2023–2028 (USD BILLION)
                    TABLE 48 HARDWARE: HUMAN AUGMENTATION MARKET FOR AR DEVICES, BY TYPE, 2019–2022 (MILLION UNITS)
                    TABLE 49 HARDWARE: HUMAN AUGMENTATION MARKET FOR AR DEVICES, BY TYPE, 2023–2028 (MILLION UNITS)
                    TABLE 50 HARDWARE: HUMAN AUGMENTATION MARKET FOR AR DEVICES, BY APPLICATION, 2019–2022 (USD BILLION)
                    TABLE 51 HARDWARE: HUMAN AUGMENTATION MARKET FOR AR DEVICES, BY APPLICATION, 2023–2028 (USD BILLION)
                    TABLE 52 HARDWARE: HUMAN AUGMENTATION MARKET FOR AR DEVICES, BY REGION, 2019–2022 (USD BILLION)
                    TABLE 53 HARDWARE: HUMAN AUGMENTATION MARKET FOR AR DEVICES, BY REGION, 2023–2028 (USD BILLION)
                    6.3.1.1 Head-mounted displays
                               6.3.1.1.1 Rising implementation of HMDs in commercial, medical, and enterprise applications to support market growth
                    6.3.1.2 Head-up displays
                               6.3.1.2.1 Increasing utilization of HUDs in automotive applications to fuel market growth
           6.3.2 SOFTWARE
                    6.3.2.1 Growing adoption of AR software for gaming and entertainment applications to drive market
                               TABLE 54 SOFTWARE: HUMAN AUGMENTATION MARKET FOR AR DEVICES, BY APPLICATION, 2019–2022 (USD BILLION)
                               TABLE 55 SOFTWARE: HUMAN AUGMENTATION MARKET FOR AR DEVICES, BY APPLICATION, 2023–2028 (USD BILLION)
                               TABLE 56 SOFTWARE: HUMAN AUGMENTATION MARKET FOR AR DEVICES, BY REGION, 2019–2022 (USD BILLION)
                               TABLE 57 SOFTWARE: HUMAN AUGMENTATION MARKET FOR AR DEVICES, BY REGION, 2023–2028 (USD BILLION)
           6.3.3 APPLICATIONS OF AR DEVICES
                    6.3.3.1 Consumer
                    6.3.3.2 Commercial
                    6.3.3.3 Enterprise
                    6.3.3.4 Healthcare
                    6.3.3.5 Aerospace & defense
                    6.3.3.6 Energy
                    6.3.3.7 Automotive
                    6.3.3.8 Others
                               TABLE 58 AR DEVICES: HUMAN AUGMENTATION MARKET, BY APPLICATION, 2019–2022 (USD BILLION)
                               TABLE 59 AR DEVICES: HUMAN AUGMENTATION MARKET, BY APPLICATION, 2023–2028 (USD BILLION)
    6.4 VIRTUAL REALITY DEVICES 
           TABLE 60 VR DEVICES: HUMAN AUGMENTATION MARKET, BY OFFERING, 2019–2022 (USD BILLION)
           TABLE 61 VR DEVICES: HUMAN AUGMENTATION MARKET, BY OFFERING, 2023–2028 (USD BILLION)
           TABLE 62 VR DEVICES: HUMAN AUGMENTATION MARKET, BY REGION, 2019–2022 (USD BILLION)
           TABLE 63 VR DEVICES: HUMAN AUGMENTATION MARKET, BY REGION, 2023–2028 (USD BILLION)
           6.4.1 HARDWARE
                    TABLE 64 HARDWARE: HUMAN AUGMENTATION MARKET FOR VR DEVICES MARKET, BY DEVICE TYPE, 2019–2022 (USD BILLION)
                    TABLE 65 HARDWARE: HUMAN AUGMENTATION MARKET FOR VR DEVICES MARKET, BY DEVICE TYPE, 2023–2028 (USD BILLION)
                    TABLE 66 HARDWARE: HUMAN AUGMENTATION MARKET FOR VR DEVICES, BY DEVICE TYPE, 2019–2022 (MILLION UNITS)
                    TABLE 67 HARDWARE: HUMAN AUGMENTATION MARKET FOR VR DEVICES, BY DEVICE TYPE, 2023–2028 (MILLION UNITS)
                    TABLE 68 HARDWARE: HUMAN AUGMENTATION MARKET FOR VR DEVICES, BY APPLICATION, 2019–2022 (USD BILLION)
                    TABLE 69 HARDWARE: HUMAN AUGMENTATION MARKET FOR VR DEVICES, BY APPLICATION, 2023–2028 (USD BILLION)
                    TABLE 70 HARDWARE: HUMAN AUGMENTATION MARKET FOR VR DEVICES, BY REGION, 2019–2022 (USD BILLION)
                    TABLE 71 HARDWARE: HUMAN AUGMENTATION MARKET FOR VR DEVICES, BY REGION, 2023–2028 (USD BILLION)
                    6.4.1.1 Head-mounted displays
                               6.4.1.1.1 Rising demand for interactive experiences in gaming to boost adoption of HMDs
                    6.4.1.2 Gesture-tracking devices
                               6.4.1.2.1 Rising adoption of gesture-tracking devices in gaming and healthcare applications to drive market
                    6.4.1.3 Projector and display walls
                               6.4.1.3.1 Increasing adoption of projectors and display walls for commercial and automotive applications to drive market
           6.4.2 SOFTWARE
                    6.4.2.1 Rising demand for immersive experiences within virtual environments to fuel segmental growth
                               TABLE 72 SOFTWARE: HUMAN AUGMENTATION MARKET FOR VR DEVICES, BY APPLICATION 2019–2022 (USD BILLION)
                               TABLE 73 SOFTWARE: HUMAN AUGMENTATION MARKET FOR VR DEVICES, BY APPLICATION, 2023–2028 (USD BILLION)
                               TABLE 74 SOFTWARE: HUMAN AUGMENTATION MARKET FOR VR DEVICES, BY REGION, 2019–2022 (USD BILLION)
                               TABLE 75 SOFTWARE: HUMAN AUGMENTATION MARKET FOR VR DEVICES, BY REGION, 2023–2028 (USD BILLION)
           6.4.3 APPLICATIONS OF VR DEVICES
                    6.4.3.1 Consumer
                    6.4.3.2 Commercial
                    6.4.3.3 Enterprise
                    6.4.3.4 Healthcare
                    6.4.3.5 Aerospace & defense
                    6.4.3.6 Others
           TABLE 76 VR DEVICES: HUMAN AUGMENTATION MARKET, BY APPLICATION, 2019–2022 (USD BILLION)
           TABLE 77 VR DEVICES: HUMAN AUGMENTATION MARKET, BY APPLICATION, 2023–2028 (USD BILLION)
    6.5 EXOSKELETONS 
           TABLE 78 EXOSKELETONS: HUMAN AUGMENTATION MARKET, BY TYPE, 2019–2022 (USD BILLION)
           TABLE 79 EXOSKELETONS: HUMAN AUGMENTATION MARKET, BY TYPE, 2023–2028 (USD BILLION)
           TABLE 80 EXOSKELETONS: HUMAN AUGMENTATION MARKET, BY TYPE, 2019–2022 (MILLION UNITS)
           TABLE 81 EXOSKELETONS: HUMAN AUGMENTATION MARKET, BY TYPE, 2023–2028 (MILLION UNITS)
           TABLE 82 EXOSKELETONS: HUMAN AUGMENTATION MARKET, BY REGION, 2019–2022 (USD BILLION)
           TABLE 83 EXOSKELETONS: HUMAN AUGMENTATION MARKET, BY REGION, 2023–2028 (USD BILLION)
           6.5.1 POWERED
                    6.5.1.1 Increasing demand for powered exoskeletons to enhance user endurance to drive market
                               TABLE 84 POWERED: HUMAN AUGMENTATION MARKET FOR EXOSKELETONS, BY END USER, 2019–2022 (USD MILLION)
                               TABLE 85 POWERED: HUMAN AUGMENTATION MARKET FOR EXOSKELETONS, BY END USER, 2023–2028 (USD MILLION)
                               TABLE 86 POWERED: HUMAN AUGMENTATION MARKET FOR EXOSKELETONS, BY REGION, 2019–2022 (USD MILLION)
                               TABLE 87 POWERED: HUMAN AUGMENTATION MARKET FOR EXOSKELETONS, BY REGION, 2023–2028 (USD MILLION)
           6.5.2 PASSIVE
                    6.5.2.1 Increasing adoption of passive exoskeletons for ergonomic support to drive segmental growth
                               TABLE 88 PASSIVE: HUMAN AUGMENTATION MARKET FOR EXOSKELETONS, BY END USER, 2019–2022 (USD BILLION)
                               TABLE 89 PASSIVE: HUMAN AUGMENTATION MARKET FOR EXOSKELETONS, BY END USER, 2023–2028 (USD BILLION)
                               TABLE 90 PASSIVE: HUMAN AUGMENTATION MARKET FOR EXOSKELETONS, BY REGION, 2019–2022 (USD BILLION)
                               TABLE 91 PASSIVE: HUMAN AUGMENTATION MARKET FOR EXOSKELETONS, BY REGION, 2023–2028 (USD BILLION)
           6.5.3 APPLICATIONS OF EXOSKELETONS
                    6.5.3.1 Healthcare
                    6.5.3.2 Defense
                    6.5.3.3 Industrial
                    6.5.3.4 Others
    6.6 BIOMETRIC SYSTEMS 
           TABLE 92 BIOMETRIC SYSTEMS: HUMAN AUGMENTATION MARKET, BY AUTHENTICATION TYPE, 2019–2022 (USD BILLION)
           TABLE 93 BIOMETRIC SYSTEMS: HUMAN AUGMENTATION MARKET, BY AUTHENTICATION TYPE, 2023–2028 (USD BILLION)
           TABLE 94 BIOMETRIC SYSTEMS: HUMAN AUGMENTATION MARKET, BY REGION, 2019–2022 (USD BILLION)
           TABLE 95 BIOMETRIC SYSTEMS: HUMAN AUGMENTATION MARKET, BY REGION, 2023–2028 (USD BILLION)
           6.6.1 SINGLE-FACTOR AUTHENTICATION
                    TABLE 96 BIOMETRIC SYSTEMS: HUMAN AUGMENTATION MARKET, BY SINGLE-FACTOR AUTHENTICATION, 2019–2022 (USD BILLION)
                    TABLE 97 BIOMETRIC SYSTEMS: HUMAN AUGMENTATION MARKET, BY SINGLE-FACTOR AUTHENTICATION, 2023–2028 (USD BILLION)
                    TABLE 98 SINGLE-FACTOR AUTHENTICATION: HUMAN AUGMENTATION MARKET FOR BIOMETRIC SYSTEMS, BY END USER, 2019–2022 (USD BILLION)
                    TABLE 99 SINGLE-FACTOR AUTHENTICATION: HUMAN AUGMENTATION MARKET FOR BIOMETRIC SYSTEMS, BY END USER, 2023–2028 (USD BILLION)
                    6.6.1.1 Fingerprint recognition
                               6.6.1.1.1 Increasing demand for fingerprint recognition in consumer electronics to drive market
                                            TABLE 100 BIOMETRIC SYSTEMS: HUMAN AUGMENTATION MARKET, BY FINGERPRINT RECOGNITION TYPE, 2019–2022 (USD BILLION)
                                            TABLE 101 BIOMETRIC SYSTEMS: HUMAN AUGMENTATION MARKET, BY FINGERPRINT RECOGNITION TYPE, 2023–2028 (USD BILLION)
                    6.6.1.2 IRIS recognition
                               6.6.1.2.1 Adoption of IRIS recognition technology in high security applications to drive market
                    6.6.1.3 Palm print recognition
                               6.6.1.3.1 Adoption of palm print recognition technology in retail and banking to support market growth
                    6.6.1.4 Face recognition
                               6.6.1.4.1 Growing applications of face recognition technology in security and surveillance applications to contribute to market growth
                    6.6.1.5 Vein recognition
                               6.6.1.5.1 Increasing adoption of vein recognition biometric systems in healthcare to propel market
                    6.6.1.6 Signature recognition
                               6.6.1.6.1 Utilization of signature recognition technology for fraud detection in banking sector to drive market
                    6.6.1.7 Voice recognition
                               6.6.1.7.1 Rising adoption of voice recognition technology in smart homes to create opportunities for market players
                    6.6.1.8 Others
           6.6.2 MULTI-FACTOR AUTHENTICATION
                    TABLE 102 BIOMETRIC SYSTEMS: HUMAN AUGMENTATION MARKET, BY MULTI-FACTOR AUTHENTICATION, 2019–2022 (USD BILLION)
                    TABLE 103 BIOMETRIC SYSTEMS: HUMAN AUGMENTATION MARKET, BY MULTI-FACTOR AUTHENTICATION, 2023–2028 (USD BILLION)
                    TABLE 104 MULTI-FACTOR AUTHENTICATION: HUMAN AUGMENTATION MARKET FOR BIOMETRIC SYSTEMS, BY REGION, 2019–2022 (USD BILLION)
                    TABLE 105 MULTI-FACTOR AUTHENTICATION: HUMAN AUGMENTATION MARKET FOR BIOMETRIC SYSTEMS, BY REGION, 2023–2028 (USD BILLION)
                    TABLE 106 MULTI-FACTOR AUTHENTICATION: HUMAN AUGMENTATION MARKET FOR BIOMETRIC SYSTEMS, BY END USER, 2019–2022 (USD BILLION)
                    TABLE 107 MULTI-FACTOR AUTHENTICATION: HUMAN AUGMENTATION MARKET FOR BIOMETRIC SYSTEMS, 2023–2028 (USD BILLION)
                    6.6.2.1 Biometric smart card
                               6.6.2.1.1 Increasing demand for enhanced transaction security to boost adoption of biometric smart cards
                    6.6.2.2 Biometric PIN
                               6.6.2.2.1 Rising adoption of biometric PIN in physical access systems to drive segmental growth
                    6.6.2.3 Multimodal
                               6.6.2.3.1 Increasing adoption of multimodal authentication in commercial spaces to drive segmental growth
                               6.6.2.3.2 Two-factor authentication
                               6.6.2.3.3 Three-factor authentication
           6.6.3 APPLICATIONS OF BIOMETRIC SYSTEMS
                    6.6.3.1 Government
                    6.6.3.2 Military and defense
                    6.6.3.3 Healthcare
                    6.6.3.4 Banking and finance
                    6.6.3.5 Consumer electronics
                    6.6.3.6 Travel and immigration
                    6.6.3.7 Automotive
                    6.6.3.8 Security
                    6.6.3.9 Others
    6.7 INTELLIGENT VIRTUAL ASSISTANTS (IVAS) 
           TABLE 108 INTELLIGENT VIRTUAL ASSISTANTS: HUMAN AUGMENTATION MARKET, BY TYPE, 2019–2022 (USD BILLION)
           TABLE 109 INTELLIGENT VIRTUAL ASSISTANTS: HUMAN AUGMENTATION MARKET, BY TYPE, 2023–2028 (USD BILLION)
           TABLE 110 INTELLIGENT VIRTUAL ASSISTANTS: HUMAN AUGMENTATION MARKET, BY REGION, 2019–2022 (USD BILLION)
           TABLE 111 INTELLIGENT VIRTUAL ASSISTANTS: HUMAN AUGMENTATION MARKET, BY REGION, 2023–2028 (USD BILLION)
           6.7.1 CHATBOTS
                    6.7.1.1 Rising adoption of chatbots to enhance customer engagement and operational efficiency to drive market
           6.7.2 SMART SPEAKERS
                    6.7.2.1 Increasing usage of smart speakers in smart homes to fuel segmental growth
                               TABLE 112 INTELLIGENT VIRTUAL ASSISTANTS: HUMAN AUGMENTATION MARKET, BY APPLICATION, 2019–2022 (USD BILLION)
                               TABLE 113 INTELLIGENT VIRTUAL ASSISTANTS: HUMAN AUGMENTATION MARKET, BY APPLICATION, 2023–2028 (USD BILLION)
           6.7.3 APPLICATIONS OF INTELLIGENT VIRTUAL ASSISTANTS
                    6.7.3.1 Consumer
                    6.7.3.2 BFSI
                    6.7.3.3 Healthcare
                    6.7.3.4 Education
                    6.7.3.5 Retail
                    6.7.3.6 Government
                    6.7.3.7 Utilities
                    6.7.3.8 Travel and hospitality
                    6.7.3.9 Others
 
7 HUMAN AUGMENTATION MARKET, BY TECHNOLOGY (Page No. - 161)
    7.1 INTRODUCTION 
    7.2 ARTIFICIAL INTELLIGENCE (AI) INTEGRATION 
           7.2.1 AI-POWERED AUGMENTATION
           7.2.2 COGNITIVE AUGMENTATION
    7.3 QUANTUM COMPUTING AUGMENTATION 
           7.3.1 QUANTUM-ENHANCED PROCESSING
           7.3.2 QUANTUM COMMUNICATION
    7.4 BIOHACKING AND BIO-AUGMENTATION 
           7.4.1 GENETIC ENGINEERING
           7.4.2 BRAIN-COMPUTER INTERFACES
 
8 HUMAN AUGMENTATION MARKET, BY FUNCTIONALITY (Page No. - 165)
    8.1 INTRODUCTION 
           FIGURE 32 BODY-WORN SEGMENT TO REGISTER HIGHER CAGR IN HUMAN AUGMENTATION MARKET DURING FORECAST PERIOD
           TABLE 114 HUMAN AUGMENTATION MARKET, BY FUNCTIONALITY, 2019–2022 (USD BILLION)
           TABLE 115 HUMAN AUGMENTATION MARKET, BY FUNCTIONALITY, 2023–2028 (USD BILLION)
    8.2 BODY WORN 
           8.2.1 RISING ADOPTION OF WEARABLE DEVICES IN CONSUMER AND MEDICAL APPLICATIONS TO BOOST MARKET GROWTH
           TABLE 116 BODY-WORN: HUMAN AUGMENTATION MARKET, BY TYPE, 2019–2022 (USD BILLION)
           TABLE 117 BODY-WORN: HUMAN AUGMENTATION MARKET, BY TYPE, 2023–2028 (USD BILLION)
    8.3 NON-BODY-WORN 
           8.3.1 INCREASING ADOPTION OF NON-BODY-WORN PRODUCTS TO IMPROVE COGNITIVE AND SENSORY EXPERIENCES TO DRIVE MARKET
           TABLE 118 NON-BODY-WORN: HUMAN AUGMENTATION MARKET, BY TYPE, 2019–2022 (USD BILLION)
           TABLE 119 NON-BODY-WORN: HUMAN AUGMENTATION MARKET, BY TYPE, 2023–2028 (USD BILLION)
 
9 HUMAN AUGMENTATION MARKET, BY END USER (Page No. - 170)
    9.1 INTRODUCTION 
           FIGURE 33 COMMERCIAL SEGMENT TO EXHIBIT HIGHEST CAGR IN HUMAN AUGMENTATION MARKET FROM 2023 TO 2028
           TABLE 120 HUMAN AUGMENTATION MARKET, BY END USER, 2019–2022 (USD BILLION)
           TABLE 121 HUMAN AUGMENTATION MARKET, BY END USER, 2023–2028 (USD BILLION)
    9.2 CONSUMER 
           9.2.1 RISING ADOPTION OF WEARABLES DEVICES TO BOOST SEGMENTAL GROWTH
           9.2.2 CASE STUDY: APPLE AND COCHLEAR COLLABORATED TO DEVELOP NUCLEUS 7 SOUND PROCESSOR
    9.3 COMMERCIAL 
           9.3.1 GROWING ADOPTION OF AR AND VR TECHNOLOGIES IN COMMERCIAL APPLICATIONS TO ACCELERATE MARKET GROWTH
           9.3.2 CASE STUDY: LOWE'S PARTNERED WITH EXOVR TO LEVERAGE VIRTUAL REALITY TECHNOLOGY FOR EMPLOYEE TRAINING
    9.4 MEDICAL 
           9.4.1 IMPLEMENTATION OF HUMAN AUGMENTATION TECHNOLOGIES TO IMPROVE PATIENT CARE TO DRIVE SEGMENTAL GROWTH
           9.4.2 CASE STUDY: EKSO BIONICS AND HOCOMA JOINED FORCES TO ENHANCE CAPABILITIES OF EKSO’S EXOSKELETONS
    9.5 AEROSPACE & DEFENSE 
           9.5.1 RISING ADOPTION OF VR AND AR TECHNOLOGIES IN PILOT TRAINING TO DRIVE MARKET
           9.5.2 CASE STUDY: RAYTHEON ADOPTED SMART GLASSES OFFERED BY VUZIX FOR MILITARY APPLICATIONS
    9.6 INDUSTRIAL 
           9.6.1 RISING ADOPTION OF EXOSKELETONS IN MANUFACTURING TO DRIVE SEGMENTAL GROWTH
           9.6.2 CASE STUDY: AIRBUS INTEGRATED DAQRI'S AUGMENTED REALITY HELMETS INTO ITS AIRCRAFT ASSEMBLY PROCESSES
    9.7 OTHERS 
 
10 HUMAN AUGMENTATION MARKET, BY REGION (Page No. - 178)
     10.1 INTRODUCTION 
             FIGURE 34 HUMAN AUGMENTATION MARKET TO REGISTER HIGHEST CAGR IN ASIA PACIFIC DURING FORECAST PERIOD
             TABLE 122 HUMAN AUGMENTATION MARKET, BY REGION, 2019–2022 (USD BILLION)
             TABLE 123 HUMAN AUGMENTATION MARKET, BY REGION, 2023–2028 (USD BILLION)
     10.2 NORTH AMERICA 
             FIGURE 35 NORTH AMERICA: HUMAN AUGMENTATION MARKET SNAPSHOT
             10.2.1 NORTH AMERICA: RECESSION IMPACT
                        TABLE 124 NORTH AMERICA: HUMAN AUGMENTATION MARKET, BY COUNTRY, 2019–2022 (USD BILLION)
                        TABLE 125 NORTH AMERICA: HUMAN AUGMENTATION MARKET, BY COUNTRY, 2023–2028 (USD BILLION)
                        TABLE 126 NORTH AMERICA: HUMAN AUGMENTATION MARKET, BY PRODUCT TYPE, 2019–2022 (USD BILLION)
                        TABLE 127 NORTH AMERICA: HUMAN AUGMENTATION MARKET, BY PRODUCT TYPE, 2023–2028 (USD BILLION)
             10.2.2 US
                        10.2.2.1 Rising implementation of human augmentation technology in wearable devices to drive regional market growth
                        10.2.2.2 Case study: DHL collaborated with Ekso Bionics to deploy wearable exoskeletons for warehouse workers
             10.2.3 CANADA
                        10.2.3.1 Increasing adoption of AR/VR technology in healthcare industry to fuel market growth
                        10.2.3.2 Case study: Bionik Laboratories partnered with TIRR Memorial Hermann Rehabilitation Hospital to pilot use of ARKE exoskeleton in stroke rehabilitation
             10.2.4 MEXICO
                        10.2.4.1 Increasing investments in industrial automation to propel adoption of human augmentation technologies
                        10.2.4.2 Case study: GE partnered with RealWear to deploy wearable AR devices in industrial maintenance and service operations
     10.3 EUROPE 
             FIGURE 36 EUROPE AMERICA: HUMAN AUGMENTATION MARKET SNAPSHOT
             10.3.1 EUROPE: RECESSION IMPACT
                        TABLE 128 EUROPE: HUMAN AUGMENTATION MARKET, BY COUNTRY, 2019–2022 (USD BILLION)
                        TABLE 129 EUROPE: HUMAN AUGMENTATION MARKET, BY COUNTRY, 2023–2028 (USD BILLION)
                        TABLE 130 EUROPE: HUMAN AUGMENTATION MARKET, BY PRODUCT TYPE, 2019–2022 (USD BILLION)
                        TABLE 131 EUROPE: HUMAN AUGMENTATION MARKET, BY PRODUCT TYPE, 2023–2028 (USD BILLION)
 
             10.3.2 UK
                        10.3.2.1 Increasing investments in AR/VR to fuel market growth
                        10.3.2.2 Case study: Airbus partnered with Magic Leap to introduce AR solutions into its aircraft design and maintenance operations
             10.3.3 GERMANY
                        10.3.3.1 Rising adoption of human augmentation technologies in automotive and industrial sectors to drive market
                        10.3.3.2 Case study: Audi collaborated with Ottobock to develop specialized exoskeletons for employees
             10.3.4 FRANCE
                        10.3.4.1 Increasing investments in smart infrastructure to fuel regional market growth
             10.3.5 REST OF EUROPE
     10.4 ASIA PACIFIC 
             FIGURE 37 ASIA PACIFIC: HUMAN AUGMENTATION MARKET SNAPSHOT
             10.4.1 ASIA PACIFIC: RECESSION IMPACT
                        TABLE 132 ASIA PACIFIC: HUMAN AUGMENTATION MARKET, BY COUNTRY, 2019–2022 (USD BILLION)
                        TABLE 133 ASIA PACIFIC: HUMAN AUGMENTATION MARKET, BY COUNTRY, 2023–2028 (USD BILLION)
                        TABLE 134 ASIA PACIFIC: HUMAN AUGMENTATION MARKET, BY PRODUCT TYPE, 2019–2022 (USD BILLION)
                        TABLE 135 ASIA PACIFIC: HUMAN AUGMENTATION MARKET, BY PRODUCT TYPE, 2023–2028 (USD BILLION)
             10.4.2 CHINA
                        10.4.2.1 Growing focus on industrialization and manufacturing expansion to foster market growth
                        10.4.2.2 Case study: OnePlus partnered with VR headset manufacturers to provide VR experiences on smartphones
             10.4.3 JAPAN
                        10.4.3.1 Increasing adoption of robotics in industrial sector to drive market
                        10.4.3.2 Case study: Toyota collaborated with exoskeleton technology providers to provide exoskeletons for enhancing workers’ movements
             10.4.4 SOUTH KOREA
                        10.4.4.1 Government-led investments in medical devices to drive market
             10.4.5 INDIA
                        10.4.5.1 Growing adoption of consumer electronics devices to contribute to market growth
             10.4.6 REST OF ASIA PACIFIC
     10.5 REST OF THE WORLD (ROW) 
             10.5.1 ROW: RECESSION IMPACT
                        TABLE 136 ROW: HUMAN AUGMENTATION MARKET, BY REGION, 2019–2022 (USD BILLION)
                        TABLE 137 ROW: HUMAN AUGMENTATION MARKET, BY REGION, 2023–2028 (USD BILLION)
                        TABLE 138 ROW: HUMAN AUGMENTATION MARKET, BY PRODUCT TYPE, 2019–2022 (USD BILLION)
                        TABLE 139 ROW: HUMAN AUGMENTATION MARKET, BY PRODUCT TYPE, 2023–2028 (USD BILLION)
             10.5.2 MIDDLE EAST & AFRICA
                        10.5.2.1 Increasing government investments in development of innovative human augmentation products to enhance market growth
             10.5.3 SOUTH AMERICA
                        10.5.3.1 Rising technological advancements to drive adoption of human augmentation technologies
 
11 COMPETITIVE LANDSCAPE (Page No. - 203)
     11.1 INTRODUCTION 
     11.2 STRATEGIES ADOPTED BY KEY PLAYERS 
             TABLE 140 HUMAN AUGMENTATION MARKET: OVERVIEW OF STRATEGIES ADOPTED BY KEY PLAYERS
     11.3 MARKET SHARE ANALYSIS, 2022 
             FIGURE 38 MARKET SHARE OF KEY PLAYERS, 2022
             TABLE 141 HUMAN AUGMENTATION MARKET: MARKET SHARE ANALYSIS (2022)
             11.3.1 KEY PLAYERS IN HUMAN AUGMENTATION MARKET, 2022
     11.4 REVENUE ANALYSIS OF KEY PLAYERS IN HUMAN AUGMENTATION MARKET 
             FIGURE 39 FIVE-YEAR REVENUE ANALYSIS OF KEY PLAYERS IN HUMAN AUGMENTATION MARKET
     11.5 COMPANY EVALUATION MATRIX 
             11.5.1 STARS
             11.5.2 EMERGING LEADERS
             11.5.3 PERVASIVE PLAYERS
             11.5.4 PARTICIPANTS
                        FIGURE 40 HUMAN AUGMENTATION MARKET (GLOBAL): COMPANY EVALUATION MATRIX, 2022
             11.5.5 COMPANY FOOTPRINT
                        TABLE 142 HUMAN AUGMENTATION MARKET: COMPANY PRODUCT FOOTPRINT
                        TABLE 143 HUMAN AUGMENTATION MARKET: COMPANY PRODUCT TYPE FOOTPRINT
                        TABLE 144 HUMAN AUGMENTATION MARKET: COMPANY TECHNOLOGY FOOTPRINT
                        TABLE 145 HUMAN AUGMENTATION MARKET: COMPANY FUNCTIONALITY FOOTPRINT
                        TABLE 146 HUMAN AUGMENTATION MARKET: COMPANY END-USER FOOTPRINT
                        TABLE 147 HUMAN AUGMENTATION MARKET: COMPANY REGION FOOTPRINT
     11.6 STARTUPS/SMES EVALUATION MATRIX 
             11.6.1 PROGRESSIVE COMPANIES
             11.6.2 RESPONSIVE COMPANIES
             11.6.3 DYNAMIC COMPANIES
             11.6.4 STARTING BLOCKS
                        FIGURE 41 HUMAN AUGMENTATION MARKET: STARTUPS/SMES EVALUATION MATRIX, 2022
                        TABLE 148 HUMAN AUGMENTATION MARKET: DETAILED LIST OF KEY STARTUPS
             11.6.5 COMPETITIVE BENCHMARKING
                        TABLE 149 HUMAN AUGMENTATION MARKET: STARTUP OVERALL FOOTPRINT
                        TABLE 150 HUMAN AUGMENTATION MARKET: STARTUP PRODUCT TYPE FOOTPRINT
                        TABLE 151 HUMAN AUGMENTATION MARKET: STARTUP TECHNOLOGY FOOTPRINT
                        TABLE 152 HUMAN AUGMENTATION MARKET: STARTUP FUNCTIONALITY FOOTPRINT
                        TABLE 153 HUMAN AUGMENTATION MARKET: STARTUP END-USER FOOTPRINT
                        TABLE 154 HUMAN AUGMENTATION MARKET: STARTUP REGION FOOTPRINT
     11.7 COMPETITIVE SCENARIOS AND TRENDS 
             TABLE 155 HUMAN AUGMENTATION MARKET: TOP PRODUCT LAUNCHES AND DEVELOPMENTS, FEBRUARY 2020 TO OCTOBER 2023
             TABLE 156 HUMAN AUGMENTATION MARKET: TOP DEALS AND OTHER DEVELOPMENTS, JANUARY 2019 TO SEPTEMBER 2023
 
12 COMPANY PROFILES (Page No. - 232)
(Business Overview, Products/Services/Solutions Offered, Recent Developments, and MnM View (Key strengths/Right to Win, Strategic Choices Made, and Weaknesses and Competitive Threats))*  
     12.1 KEY PLAYERS 
             12.1.1 SAMSUNG
                        TABLE 157 SAMSUNG: COMPANY OVERVIEW
                        FIGURE 42 SAMSUNG: COMPANY SNAPSHOT
                        TABLE 158 SAMSUNG: PRODUCTS/SERVICES/SOLUTIONS OFFERED
                        TABLE 159 SAMSUNG: PRODUCT LAUNCHES
                        TABLE 160 SAMSUNG: DEALS
             12.1.2 ALPHABET
                        TABLE 161 ALPHABET: COMPANY OVERVIEW
                        FIGURE 43 ALPHABET: COMPANY SNAPSHOT
                        TABLE 162 ALPHABET: PRODUCTS/SERVICES/SOLUTIONS OFFERED
                        TABLE 163 ALPHABET: PRODUCT LAUNCHES
                        TABLE 164 ALPHABET: DEALS
             12.1.3 APPLE INC.
                        TABLE 165 APPLE INC.: COMPANY OVERVIEW
                        FIGURE 44 APPLE INC.: COMPANY SNAPSHOT
                        TABLE 166 APPLE INC.: PRODUCTS/SERVICES/SOLUTIONS OFFERED
                        TABLE 167 APPLE INC.: PRODUCT LAUNCHES
             12.1.4 MICROSOFT
                        TABLE 168 MICROSOFT: COMPANY OVERVIEW
                        FIGURE 45 MICROSOFT: COMPANY SNAPSHOT
                        TABLE 169 MICROSOFT: PRODUCTS/SERVICES/SOLUTIONS OFFERED
                        TABLE 170 MICROSOFT: PRODUCT LAUNCHES
                        TABLE 171 MICROSOFT: DEALS
             12.1.5 META
                        TABLE 172 META: COMPANY OVERVIEW
                        FIGURE 46 META: COMPANY SNAPSHOT
                        TABLE 173 META: PRODUCTS/SERVICES/SOLUTIONS OFFERED
                        TABLE 174 META: PRODUCT LAUNCHES
                        TABLE 175 META: DEALS
             12.1.6 SONY GROUP CORPORATION
                        TABLE 176 SONY GROUP CORPORATION: COMPANY OVERVIEW
                        FIGURE 47 SONY GROUP CORPORATION: COMPANY SNAPSHOT
                        TABLE 177 SONY GROUP CORPORATION: PRODUCTS/SERVICES/SOLUTIONS OFFERED
                        TABLE 178 SONY GROUP CORPORATION: PRODUCT LAUNCHES
                        TABLE 179 SONY GROUP CORPORATION: DEALS
             12.1.7 EKSO BIONICS
                        TABLE 180 EKSO BIONICS: COMPANY OVERVIEW
                        FIGURE 48 EKSO BIONICS: COMPANY SNAPSHOT
                        TABLE 181 EKSO BIONICS: PRODUCTS/SERVICES/SOLUTIONS OFFERED
                        TABLE 182 EKSO BIONICS: PRODUCT LAUNCHES
                        TABLE 183 EKSO BIONICS: DEALS
             12.1.8 VUZIX
                        TABLE 184 VUZIX: COMPANY OVERVIEW
                        FIGURE 49 VUZIX: COMPANY SNAPSHOT
                        TABLE 185 VUZIX: PRODUCTS/SERVICES/SOLUTIONS OFFERED
                        TABLE 186 VUZIX: PRODUCT LAUNCHES
                        TABLE 187 VUZIX: DEALS
             12.1.9 GARMIN LTD.
                        TABLE 188 GARMIN LTD.: COMPANY OVERVIEW
                        FIGURE 50 GARMIN LTD.: COMPANY SNAPSHOT
                        TABLE 189 GARMIN LTD.: PRODUCTS/SERVICES/SOLUTIONS OFFERED
                        TABLE 190 GARMIN LTD.: PRODUCT LAUNCHES
                        TABLE 191 GARMIN LTD.: DEALS
             12.1.10 FOSSIL GROUP INC.
                        TABLE 192 FOSSIL GROUP INC.: COMPANY OVERVIEW
                        FIGURE 51 FOSSIL GROUP INC.: COMPANY SNAPSHOT
                        TABLE 193 FOSSIL GROUP INC.: PRODUCTS/SERVICES/SOLUTIONS OFFERED
                        TABLE 194 FOSSIL GROUP INC.: PRODUCT LAUNCHES
             12.1.11 B-TEMIA
                        TABLE 195 B-TEMIA: COMPANY OVERVIEW
                        TABLE 196 B-TEMIA: PRODUCTS/SERVICES/SOLUTIONS OFFERED
                        TABLE 197 B-TEMIA: PRODUCT LAUNCHES
                        TABLE 198 B-TEMIA: DEALS
             12.1.12 CASIO COMPUTER CO., LTD.
                        TABLE 199 CASIO COMPUTER CO., LTD.: COMPANY OVERVIEW
                        FIGURE 52 CASIO COMPUTER CO., LTD.: COMPANY SNAPSHOT
                        TABLE 200 CASIO COMPUTER CO., LTD.: PRODUCTS/SERVICES/SOLUTIONS OFFERED
                        TABLE 201 CASIO COMPUTER CO., LTD.: PRODUCT LAUNCHES
             12.1.13 REWALK ROBOTICS
                        TABLE 202 REWALK ROBOTICS: COMPANY OVERVIEW
                        FIGURE 53 REWALK ROBOTICS: COMPANY SNAPSHOT
                        TABLE 203 REWALK ROBOTICS: PRODUCTS/SERVICES/SOLUTIONS OFFERED
             12.1.14 CYBERDYNE INC.
                        TABLE 204 CYBERDYNE INC.: COMPANY OVERVIEW
                        FIGURE 54 CYBERDYNE INC.: COMPANY SNAPSHOT
                        TABLE 205 CYBERDYNE INC.: PRODUCTS/SERVICES/SOLUTIONS OFFERED
     12.2 OTHER PLAYERS 
             12.2.1 MAGIC LEAP, INC.
             12.2.2 POLAR ELECTRO
             12.2.3 P&S MECHANICS CO., LTD.
             12.2.4 LIFESENSE
             12.2.5 HK SMARTMV LIMITED
             12.2.6 REX BIONICS LTD.
             12.2.7 ATHEER, INC
             12.2.8 CORTIGENT
             12.2.9 INBENTA HOLDINGS INC.
             12.2.10 MYCROFT AI, INC.
             12.2.11 CYBERGLOVE SYSTEMS INC.
             12.2.12 SCOPE AR
             12.2.13 MERGE LABS, INC.
             12.2.14 WEARABLE ROBOTICS SRL
             12.2.15 GOQII
*Details on Business Overview, Products/Services/Solutions Offered, Recent Developments, and MnM View (Key strengths/Right to Win, Strategic Choices Made, and Weaknesses and Competitive Threats) might not be captured in case of unlisted companies.  
 
13 APPENDIX (Page No. - 288)
     13.1 DISCUSSION GUIDE 
     13.2 KNOWLEDGESTORE: MARKETSANDMARKETS’ SUBSCRIPTION PORTAL 
     13.3 CUSTOMIZATION OPTIONS 
     13.4 RELATED REPORTS 
     13.5 AUTHOR DETAILS 


The study involved four major activities in estimating the current size of the human augmentation market. Exhaustive secondary research was done to collect information on the market, peer market, and parent market. The next step was to validate these findings, assumptions, and sizing with industry experts across the value chain through primary research. Both top-down and bottom-up approaches were employed to estimate the complete market size. After that, market breakdown and data triangulation were used to estimate the market size of segments and subsegments.

Secondary Research

Secondary sources for this research study included corporate filings (such as annual reports, investor presentations, and financial statements); trade, business, and professional associations; white papers; certified publications; articles by recognized authors; directories; and databases. The secondary data was collected and analyzed to determine the overall market size, further validated through primary research.

List of major secondary sources

SOURCE

WEB LINK

Federal Communications Commission (FCC)

https://www.fcc.gov/

Food and Drug Administration (FDA)

https://www.fda.gov/

Canadian Radio-television and Telecommunications Commission (CRTC)

https://crtc.gc.ca/eng/home-accueil.htm

Medicines and Healthcare Products Regulatory Agency (MHRA))

https://www.gov.uk/government/organisations/medicines-and-healthcare-products-regulatory-agency

National Medical Products Administration (NMPA)

https://english.nmpa.gov.cn/

Pharmaceuticals and Medical Devices Agency (PMDA)

https://www.pmda.go.jp/english/

European Medicines Agency (EMA)

https://www.ema.europa.eu/en

Primary Research

Extensive primary research was conducted after gaining knowledge about the current scenario of the human augmentation market through secondary research. Several primary interviews were conducted with experts from both demand and supply sides across four major regions—North America, Europe, Asia Pacific, and RoW. This primary data was collected through questionnaires, emails, and telephonic interviews.

Human Augmentation Market Size, and Share

To know about the assumptions considered for the study, download the pdf brochure

Market Size Estimation

Both top-down and bottom-up approaches were used to estimate and validate the size of the human augmentation market and its various dependent submarkets. The key players in the market were identified through secondary research, and their market share in the respective regions was determined through primary and secondary research. This entire procedure involved the study of annual and financial reports of top players and extensive interviews with industry leaders such as chief executive officers (CEOs), vice presidents (VPs), directors, and marketing executives. All percentage shares and breakdowns were determined using secondary sources and verified through primary sources. All the possible parameters that affect the markets covered in this research study were accounted for, viewed in extensive detail, verified through primary research, and analyzed to obtain the final quantitative and qualitative data. This data was consolidated and supplemented with detailed inputs and analysis from MarketsandMarkets and presented in this report.

Bottom-Up Approach

The bottom-up approach was used to arrive at the overall size of the Human Augmentation market from the revenues of the key players and their shares in the market. The overall market size was calculated based on the revenues of the key players identified in the market.

  • Identifying various applications using or expected to implement Human Augmentation
  • Analyzing each end-user, along with the major related companies and Human Augmentation providers
  • Estimating the Human Augmentation market for end-user
  • Understanding the demand generated by companies operating across different end-user
  • Tracking the ongoing and upcoming implementation of projects based on Human Augmentation technology by vertical and forecasting the market based on these developments and other critical parameters
  • Carrying out multiple discussions with the key opinion leaders to understand the type of Human Augmentation products designed and developed vertically. This information would help analyze the breakdown of the scope of work carried out by each major company in the Human Augmentation market
  • Arriving at the market estimates by analyzing Human Augmentation companies as per their countries, and subsequently combining this information to arrive at the market estimates by region
  • Verifying and cross-checking the estimates at every level through discussions with the key opinion leaders, including CXOs, directors, and operations managers, and finally with domain experts at MarketsandMarkets
  • Studying various paid and unpaid sources of information, such as annual reports, press releases, white papers, and databases

Human Augmentation Market Size, and Bottom-Up Approach

Top-Down Approach

In the top-down approach, the overall market size has been used to estimate the size of the individual markets (mentioned in the market segmentation) through percentage splits from secondary and primary research.

To calculate the market size of specific segments, the most appropriate immediate parent market size has been used to implement the top-down approach. The top-down approach was implemented for the data extracted from the secondary research to validate the market size obtained.

The market share of each company was estimated to verify the revenue shares used earlier in the top-down approach. The overall parent market size and individual market sizes were determined and confirmed in this study by the data triangulation method and the validation of data through primaries. The data triangulation method used in this study is explained in the next section.

  • Focusing on top-line investments and expenditures being made in the ecosystems of various verticals.
  • Building and developing the information related to the market revenue generated by key Human Augmentation manufacturers
  • Conducting multiple on-field discussions with the key opinion leaders involved in the development of Human Augmentation products in various applications
  • Estimating geographic splits using secondary sources based on various factors, such as the number of players in a specific country and region, the offering of Human Augmentation, and the level of solutions offered in end-user industries
  • Impact of the recession on the steps mentioned above has also been considered

Human Augmentation Market Size, and Top-Down Approach

Data Triangulation

After arriving at the overall market size from the estimation process explained above, the overall market has been split into several segments and subsegments. To complete the overall market engineering process and arrive at the exact statistics for all segments and subsegments, the data triangulation procedure has been employed wherever applicable. The data has been triangulated by studying various factors and trends from both demand and supply sides. Along with this, the market size has been validated using top-down and bottom-up approaches.

Market Definition

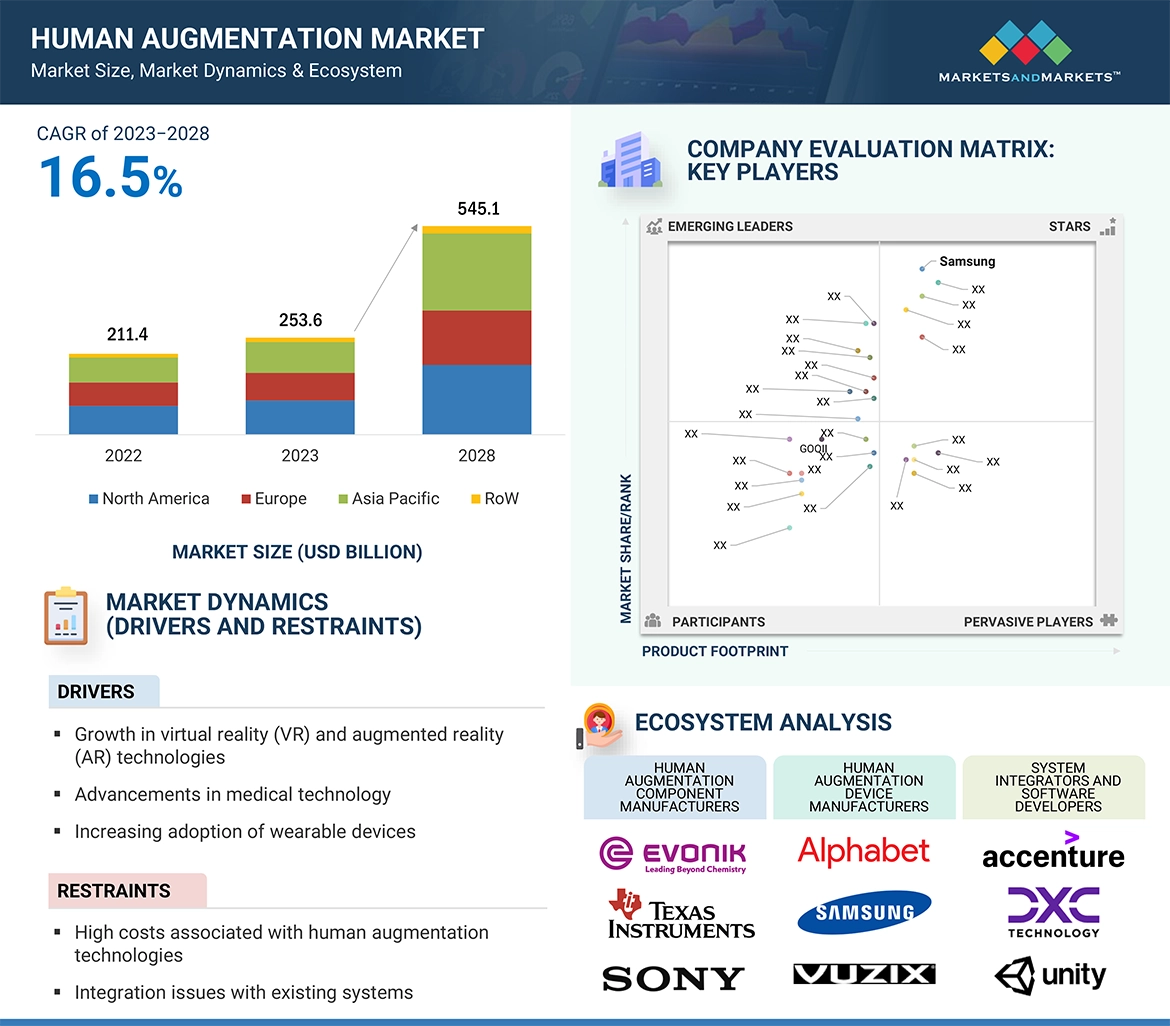
Human augmentation refers to the use of various technologies and techniques to enhance or augment the capabilities of the human body and mind. It involves the integration of artificial elements, such as devices or implants, with the human biological system to improve physical, cognitive, sensory, or other functional aspects of an individual.

Key Stakeholders

  • Technology Developers
  • Medical Device Manufacturers
  • Healthcare Providers
  • Consumers
  • Regulatory Authorities
  • Insurance Companies
  • Investors and Venture Capitalists
  • Ethics and Advocacy Groups
  • Researchers and Academia
  • Manufacturers of Components
  • End-User Industries
  • Government Agencies

Report Objectives

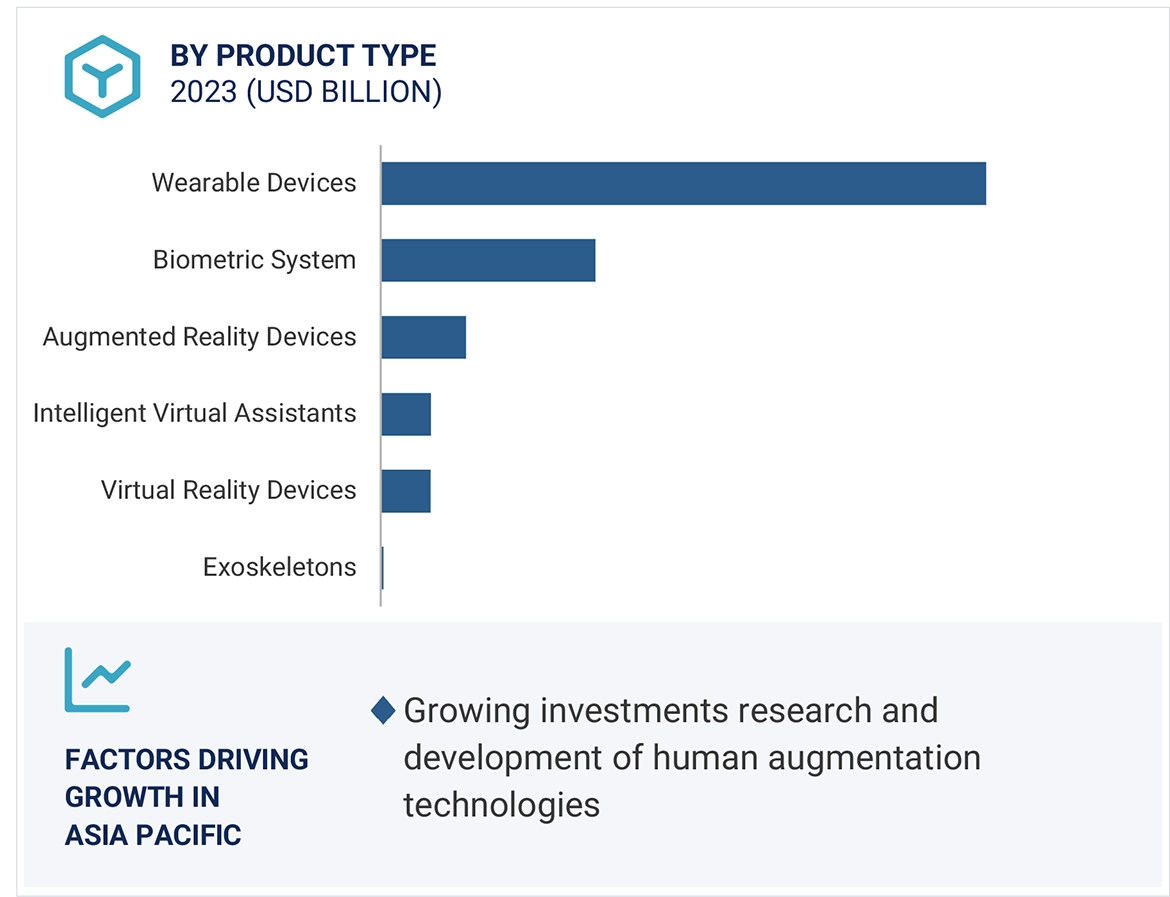
  • To define, describe, and forecast the Human Augmentation market based on product type, technology, functionality, end-user, and region.
  • To forecast the shipment data of Human Augmentation market.
  • To forecast the size of the market segments for four major regions—North America, Europe, Asia Pacific (APAC), and the Rest of the World (RoW)
  • To provide detailed information regarding the major factors influencing the growth of the market (drivers, restraints, opportunities, and challenges)
  • To strategically analyze micro-markets with respect to individual growth trends, prospects, and contributions to the total market
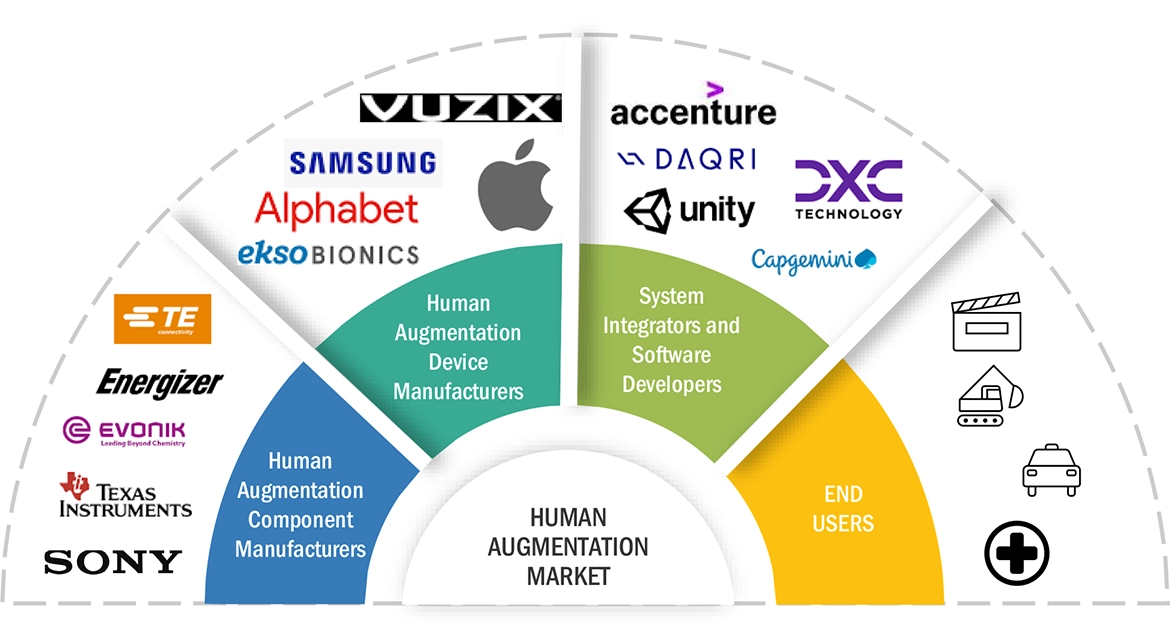
  • To study the complete value chain and allied industry segments and perform a value chain analysis of the market
  • To strategically profile the key players and comprehensively analyze their market shares and core competencies
  • To analyze the opportunities in the market for stakeholders and describe the competitive landscape of the market
  • To analyze competitive developments such as joint ventures, collaborations, agreements, contracts, partnerships, mergers & acquisitions, product developments, and research & development (R&D) in the market
  • To analyze the impact of the recession on the Human Augmentation market

Available Customizations

With the given market data, MarketsandMarkets offers customizations according to the specific requirements of companies. The following customization options are available for the report:

  • Detailed analysis and profiling of additional market players (up to 5)
  • Additional country-level analysis of the human augmentation market

Product Analysis

  • Product matrix, which provides a detailed comparison of the product portfolio of each company in the human augmentation market.
Custom Market Research Services

We will customize the research for you, in case the report listed above does not meet with your exact requirements. Our custom research will comprehensively cover the business information you require to help you arrive at strategic and profitable business decisions.

Request Customization

Instant Answers with GPT - Ask Now!

Ask real questions. Get complete answers !
Report Code
SE 3166
Published ON
Oct, 2023
Choose License Type
BUY NOW
  • SHARE
X
Request Customization
Speak to Analyst
Speak to Analyst
OR FACE-TO-FACE MEETING
PERSONALIZE THIS RESEARCH
  • Triangulate with your Own Data
  • Get Data as per your Format and Definition
  • Gain a Deeper Dive on a Specific Application, Geography, Customer or Competitor
  • Any level of Personalization
REQUEST A FREE CUSTOMIZATION
LET US HELP YOU!
  • What are the Known and Unknown Adjacencies Impacting the Human Augmentation Market
  • What will your New Revenue Sources be?
  • Who will be your Top Customer; what will make them switch?
  • Defend your Market Share or Win Competitors
  • Get a Scorecard for Target Partners
CUSTOMIZED WORKSHOP REQUEST
+1-888-600-6441
  • Call Us
  • +1-888-600-6441 (Corporate office hours)
  • +1-888-600-6441 (US/Can toll free)
  • +44-800-368-9399 (UK office hours)
CONNECT WITH US
ABOUT TRUST ONLINE
©2024 MarketsandMarkets Research Private Ltd. All rights reserved
DMCA.com Protection Status Website Feedback