The research study conducted on the aircraft landing gears market involved extensive use of secondary sources, directories, and databases, such as D&B Hoovers, Bloomberg, and Factiva, to identify and collect information relevant to the aircraft landing gears market. Primary sources included industry experts from the market as well as suppliers, manufacturers, solution providers, technology developers, alliances, and organizations related to all segments of the value chain of this industry. In-depth interviews of various primary respondents, including key industry participants, subject matter experts (SMEs), industry consultants, and C-level executives, were conducted to obtain and verify critical qualitative and quantitative information pertaining to the market as well as assess the growth prospects of the market.
Secondary Research
The market share for companies in the aircraft landing gears market was determined based on secondary data made available through paid and unpaid sources and an analysis of the product portfolios of major companies. These companies were rated based on their performance and quality. These data points were further validated by primary sources. Secondary sources for this research study included corporate filings, such as annual reports, investor presentations, financial statements, trade, business, and professional associations. The secondary data were collected and analyzed to arrive at the overall market size, which was further validated by primary respondents.
Secondary sources referred to for this research study on the aircraft landing gears market included government sources, such as GAMA (General Aviation Manufacturer Association), FlightGlobal, International Air Transport Association (IATA), Boeing Outlook 2023, Airbus Outlook 2023, and federal and state governments of various countries; corporate filings, such as annual reports, investor presentations, and financial statements; and trade, business, and professional associations; among others. Secondary data was collected and analyzed to determine the overall size of the aircraft landing gears market, which was further validated by primary respondents.
Primary Research
Extensive primary research was conducted after acquiring information regarding the aircraft landing gears market scenario through secondary research. Several primary interviews were conducted with market experts from both the demand and supply sides across major countries of North America, Europe, Asia Pacific, the Middle East, Latin America, and Africa. Primary data was collected through questionnaires, emails, and telephonic interviews.

To know about the assumptions considered for the study, download the pdf brochure
Market Size Estimation
-
Both top-down and bottom-up approaches were used to estimate and validate the size of the aircraft landing gears market.
-
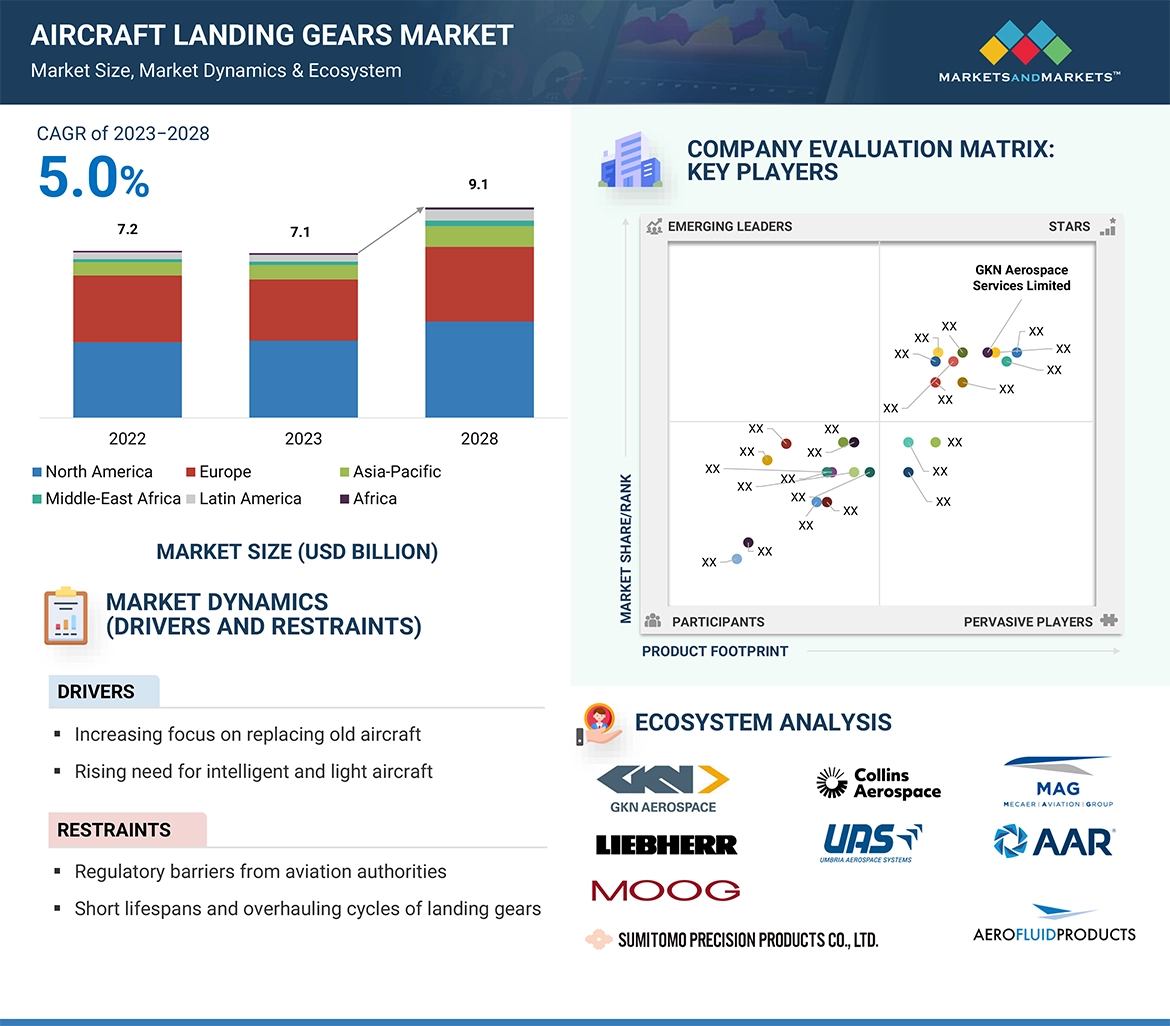
Key players were identified through secondary research, and their market ranking was determined through primary and secondary research. This included a study of annual and financial reports of the top market players and extensive interviews of leaders, including CEOs, directors, and marketing executives.
-
All percentage shares, splits, and breakdowns were determined using secondary sources and verified through primary sources. All possible parameters that affect the markets covered in this research study were accounted for, viewed in extensive detail, verified through primary research, and analyzed to obtain the final quantitative and qualitative data. This data was consolidated, enhanced with detailed inputs, analyzed by MarketsandMarkets, and presented in this report.
Market Size Estimation Methodology: Bottom-Up Approach

Market Size Estimation Methodology: Top-Down Approach

Data triangulation
After arriving at the overall size of the aircraft landing gear market from the estimation process explained above, the total market was split into several segments and subsegments. The data triangulation and market breakdown procedures explained below were implemented, wherever applicable, to complete the overall market engineering process and arrive at the exact statistics for various market segments and subsegments. The data was triangulated by studying various factors and trends from the demand and supply sides. Along with this, the aircraft landing gear market size was validated using the top-down and bottom-up approaches.
Market Definition
Aircraft landing gears refers to the aircraft undercarriage that enables the landing and take-off of aircraft. It also supports the aircraft while taxiing and on the ground. Aircraft landing gear can be the main landing gear and nose landing gear. The aircraft landing gear system includes a braking system, steering system, and actuation system, among other systems. It is used in almost all aircraft types, such as fixed-wing and rotary-wing aircraft, for commercial and military aviation.
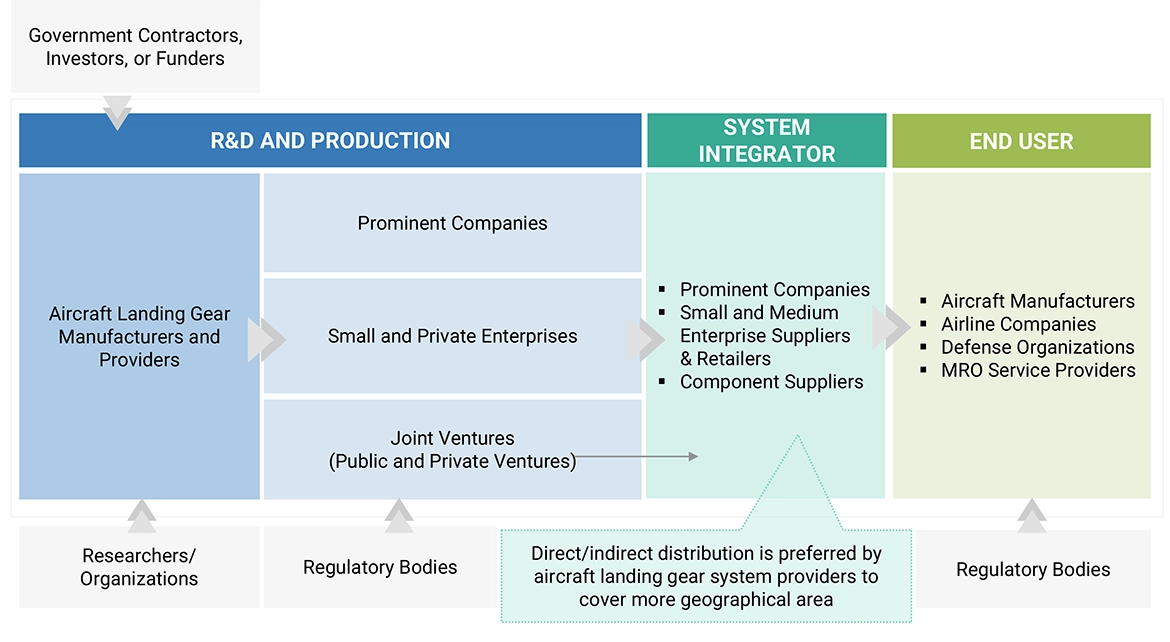
Stakeholders
Various stakeholders of the market are listed below:
-
Raw Material Suppliers
-
Aircraft Landing Gear Manufacturers
-
Technology Support Providers
-
Distributors
-
Aftermarket Companies
-
System Integrators
-
Government Agencies
-
Investors and Financial Community Professionals
-
Research Organizations
Report Objectives
-
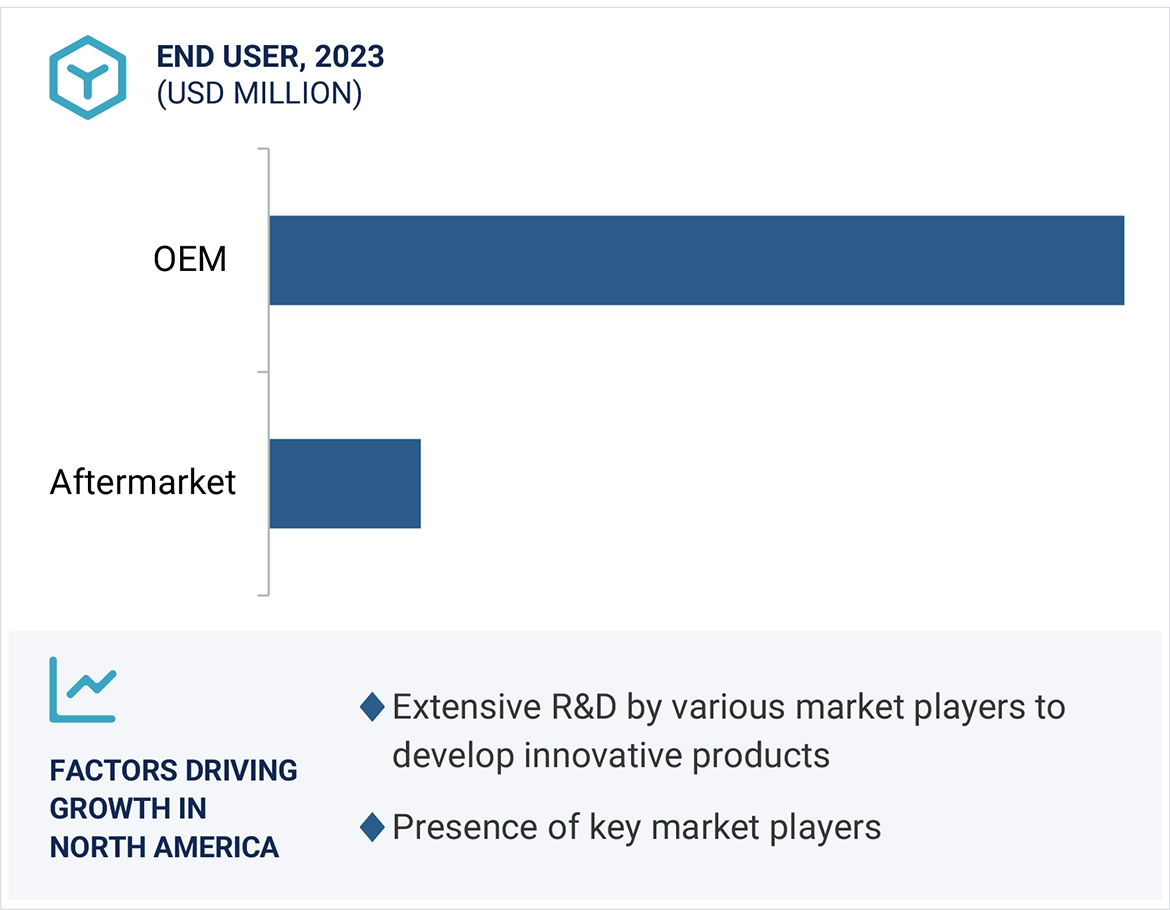
To define, describe, segment, and forecast the size of the aircraft landing gears market based on type, end user, aircraft type, subsystem, and region.
-
To analyze the degree of competition in the market by mapping the recent developments, products, and services of key market players
-
To understand the structure of the aircraft landing gears market by identifying its various segments and subsegments.
-
To identify and analyze key drivers, restraints, opportunities, and challenges that influence market growth.
-
To forecast the size of market segments across North America, Europe, Asia Pacific, Middle East, Latin America, and Africa, along with major countries in each region
-
To analyze micromarkets1 with respect to individual technological trends and their contribution to the total market
-
To profile key market players and comprehensively analyze their market share and core competencies2
-
To provide a detailed competitive landscape of the market, along with an analysis of business and strategies, such as mergers and acquisitions, partnerships, and agreements, in the aircraft landing gears market.
-
To identify detailed financial positions, key products, and unique selling points of leading companies in the market
1 Micromarkets are referred to as the segments and subsegments of the Avionics markets considered in the scope of the report.
2 Core competencies of companies were captured in terms of their key developments and key strategies adopted to sustain their positions in the market.
Available customizations
Along with the market data, MarketsandMarkets offers customizations as per the specific needs of companies. The following customization options are available for the report:
Product Analysis
-
Product matrix, which gives a detailed comparison of the product portfolio of each company.
Regional Analysis
-
Further breakdown of the market segments at the country level
Company Information
-
Detailed analysis and profiling of additional market players (up to 5)


JL
Feb, 2019
Please, I would like information (by e-mail) about the LATAM MARKET for the aerospace segment, specific for land gear and aerostructures. Thank you..