
Low Voltage DC Circuit Breaker Market

Low Voltage DC Circuit Breaker Market by Voltage (Below 60V, 60V-120V, 120V-380V, 380V-1.5kV), Type (Air, Molded Case, Others), Breaking Mechanism (Solid-state, Hybrid, Mechanical), End User, and Region - Global Forecast to 2030


OVERVIEW

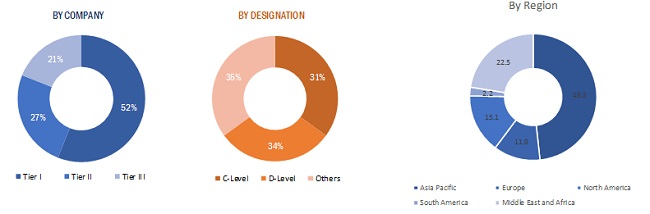
Source: Secondary Research, Interviews with Experts, MarketsandMarkets Analysis
The low-voltage DC circuit breaker market is expected to grow from an estimated USD 1.80 billion in 2025 to USD 2.52 billion by 2030, at a CAGR of 7.0% during the forecast period. Rising adoption of DC-based power systems across renewable energy installations, EV charging infrastructure, and battery energy storage systems is a key factor driving the low-voltage DC circuit breaker market. These applications require reliable DC fault protection, accelerating demand for advanced LV DC circuit breakers.
KEY TAKEAWAYS
-
BY REGIONThe Asia Pacific is expected to dominate the low-voltage DC circuit breaker market with a share of 41.4% in 2025.
-
BY TYPEBy type, the air circuit breaker segment is expected to be the fastest-growing market with a CAGR of 7.6% during the forecast period.
-
BY VOLTAGEBy voltage, the 380 V-1.5 kV segment is expected to be the fastest-growing market, with a CAGR of 7.5% during the forecast period.
-
BY BREAKING MECHANISMBased on the breaking mechanism, the mechanical segment is expected to account for the largest share of the low-voltage DC circuit breaker market in 2025.
-
BY END USERBased on end user, the solar PV plants segment is expected to account for the largest share of the market in 2025.
-
COMPETITIVE LANDSCAPEMajor players are adopting both organic and inorganic strategies, including partnerships and investments, to expand their market presence. Companies such as ABB, Siemens, Schneider Electric, Eaton, and MITSUBISHI ELECTRIC CORPORATION are actively forming collaborations to meet the growing demand for the low-voltage DC circuit breakers.
-
COMPETITIVE LANDSCAPEThe strong product ecosystem and global market penetration of Zhejiang GRL Electric Co., Ltd., LEADER CABLE, and Langir Electric have made them influential startups/SMEs/emerging leaders in the market.
Another key factor driving the low-voltage DC circuit breaker market is the rapid expansion of EV charging infrastructure. The growing adoption of electric vehicles is increasing the deployment of DC fast chargers and charging networks, which require reliable LV DC circuit breakers for fault protection, safety, and uninterrupted power delivery.
TRENDS & DISRUPTIONS IMPACTING CUSTOMERS' CUSTOMERS
Low-voltage DC circuit breakers are emerging as critical protection devices in DC-based infrastructure, driven by electrification, renewables, and battery storage adoption. They must interrupt rapidly rising DC fault currents, mitigate arc energy, and ensure system selectivity in compact, high-efficiency designs. Market growth is underpinned by applications in EV fast-charging, data centers, rail, and DC microgrids, where reliable fault isolation directly impacts uptime, safety, and asset life. Innovation is shifting from purely mechanical to solid-state and hybrid architectures, enabling ultra-fast interruption, remote monitoring, and integration with digital protection and predictive maintenance platforms.

Source: Secondary Research, Interviews with Experts, MarketsandMarkets Analysis
MARKET DYNAMICS
Level
-
Rapid Growth in Battery Energy Storage Systems (BESS)

-
Accelerated Solar PV Deployment Across All Scales

Level
-
Fragmented Standards and Lack of Interoperability

-
Higher Cost and Technical Complexity of DC Arc Interruption

Level
-
Growing Adoption of Hybrid and Solid-State DC Breakers

-
Utility-Scale Solar and Energy Storage Integration Driving Advanced DC Protection Demand

Level
-
Price Sensitivity in Small PV and Residential ESS Segments

-
Long Qualification Cycles with PV, BESS, and EV OEMs

Source: Secondary Research, Interviews with Experts, MarketsandMarkets Analysis
Driver: Rapid Growth in Battery Energy Storage Systems (BESS)
The rapid expansion of battery energy storage systems (BESS) is one of the most powerful structural drivers for the low-voltage DC circuit breaker market. As countries accelerate their efforts to achieve net-zero targets and integrate higher shares of intermittent renewable energy, grid operators are increasingly relying on battery storage to provide frequency regulation, peak shaving, load shifting, and grid stabilization services. According to the IEA, annual battery storage additions are expected to grow severalfold compared to early-2020s deployment levels, translating directly into a growing installed base of DC-heavy electrical architecture that requires reliable and selective protection. Modern BESS installations, ranging from residential and commercial systems to utility-scale storage plants, are built around high-density DC networks. LV-DC circuit breakers are deployed extensively at rack-level battery protection, string-level interconnections, DC combiner panels, and common DC busbars. Unlike fuses, DC breakers enable controlled fault interruption, reset capability, and coordinated protection, which are increasingly critical as system sizes, fault currents, and energy densities rise. As battery modules scale in parallel and series configurations, the number of DC protection points per installation increases, driving higher unit demand for LV-DC circuit breakers.
Restraint: Fragmented Standards and Lack of Interoperability
One of the most significant restraints limiting the widespread adoption of low-voltage DC circuit breakers is the absence of globally harmonized standards for DC protection, particularly when compared to the mature and well-aligned AC protection ecosystem. While AC circuit breakers benefit from decades of standardized voltage classes, short-circuit ratings, and well-established testing methodologies, DC protection standards remain fragmented across regions, applications, and voltage levels. This lack of uniformity creates uncertainty for manufacturers, system integrators, and end users when selecting and deploying DC-rated protection devices. Key technical parameters, such as DC interruption ratings, arc-fault behavior, polarity sensitivity, derating practices, and breaking capacity definitions, differ significantly across standards bodies and certification frameworks. For example, DC breakers tested under IEC standards may not be directly equivalent to those certified under UL or regional norms, even when voltage and current ratings appear similar. In addition, DC systems often require series or parallel pole configurations to achieve higher voltage ratings, further complicating standardization and interoperability across markets. As a result, manufacturers must design multiple product variants to comply with different regional requirements, increasing development time and production complexity.
Opportunity: Growing Adoption of Hybrid and Solid-State DC Breakers
The increasing adoption of hybrid and solid-state DC circuit breakers represents one of the most attractive growth opportunities in the low-voltage DC circuit breaker market, particularly in high-power and safety-critical applications. Hybrid DC breakers combine mechanical contacts with power semiconductor devices (such as IGBTs or MOSFETs), enabling rapid current commutation and interruption while minimizing mechanical wear and arc energy. Solid-state breakers, which rely entirely on semiconductor switching, offer even faster interruption times and eliminate arcing altogether. These performance advantages make advanced DC breakers especially well-suited for demanding applications such as EV fast-charging infrastructure, large-scale battery energy storage systems (ESS), and DC microgrids.
Challenge: Price Sensitivity in Small PV and Residential ESS Segments
Price sensitivity remains a major structural challenge for the adoption of low-voltage DC circuit breakers in small solar PV and residential energy storage systems (ESS). These segments are among the fastest growing in terms of installation volume, but they are also highly cost-driven, with purchasing decisions often made by installers and system integrators focused on minimizing upfront system costs. As a result, many small PV installers continue to favor DC fuses or basic DC isolator switches over DC-rated circuit breakers, despite the superior protection, reset capability, and selectivity that breakers offer.
LOW VOLTAGE DC CIRCUIT BREAKER MARKET: COMMERCIAL USE CASES ACROSS INDUSTRIES
| COMPANY | USE CASE DESCRIPTION | BENEFITS |
|---|---|---|
 |
Eaton provides DC-rated molded case circuit breakers (MCCBs), including its PVGard product line, designed to protect solar photovoltaic (PV) plants, battery energy storage systems (BESS), and EV charging infrastructure operating at high DC voltages. Eaton’s PVGard DC MCCBs are engineered and tested specifically for DC applications, supporting voltages up to approximately 750–1000 VDC. These breakers are UL 489 B compliant and suitable for both grounded and ungrounded DC systems, ensuring safe operation under harsh environmental and electrical conditions commonly found in solar and storage sites. | The solution enhances system safety and reliability by providing effective interruption of DC faults and minimizing the risk of equipment damage and unplanned outages. Compliance with global safety standards simplifies regulatory approvals for solar and BESS projects. The rugged design and high interrupting capacity reduce maintenance needs, improve uptime, and support long-term operational stability, enabling solar plant operators and storage integrators to deploy scalable, safe, and resilient DC power systems. |
 |
Low-voltage DC protection devices, including DC circuit breakers, are deployed in industrial DC distribution networks and telecommunications backup power systems operating on 48 V to 800 V DC buses. These systems supply critical loads such as telecom rectifiers, DC UPS systems, control panels, emergency backup power, and DC microgrids in industrial plants. The breakers are designed to protect continuous DC circuits that lack natural current zero-crossing, which increases the risk of sustained arcing during faults. ABB and Eaton recommend specialized LV DC breakers tailored for fault current profiles in industrial automation, telecom towers, and auxiliary DC systems in solar and infrastructure facilities. | The use of DC-specific circuit breakers ensures reliable fault interruption and safe isolation of DC loads, significantly reducing the risk of equipment damage caused by persistent arcing. These solutions improve system uptime, protect sensitive electronic equipment, and enhance operational safety in mission-critical industrial and telecom environments. Proper DC protection also extends equipment life, reduces maintenance costs, and supports compliance with electrical safety standards, making DC distribution systems more resilient and reliable. |
Logos and trademarks shown above are the property of their respective owners. Their use here is for informational and illustrative purposes only.
MARKET ECOSYSTEM
Low-voltage DC circuit breakers sit at the center of a multi-tier ecosystem spanning materials, components, systems, and standards. Raw material providers such as Aurubis, BASF, 3M, and Codelco supply copper, polymers, and specialty chemicals used in contacts, housings, and insulation. Component manufacturers, including Littelfuse, Infineon, and Omron, deliver semiconductors, sensors, and auxiliary switching elements required for protection, control, and monitoring. Breaker OEMs like ABB, Schneider Electric, Siemens, Mitsubishi Electric, and Eaton integrate these inputs into complete LVDC protection portfolios for solar, storage, rail, and EV infrastructure. End users, such as AWS, Equinix, Tesla, and ChargePoint, deploy LVDC breakers in data centers, battery systems, and fast-charging networks, operating under frameworks defined by IEC, NEMA, IAEI, and CENELEC standards.

Logos and trademarks shown above are the property of their respective owners. Their use here is for informational and illustrative purposes only.
MARKET SEGMENTS

Source: Secondary Research, Interviews with Experts, MarketsandMarkets Analysis
Low Voltage DC Circuit Breaker Market, By Type
By type, the air circuit breaker segment is expected to be the fastest-growing market, with a CAGR of 7.6% during the forecast period. The air circuit breakers (ACB) market is anticipated to exhibit the fastest growth in the low-voltage DC circuit breakers market due to an increasing demand for high-capacity and effective protection in DC systems. The use of air circuit breakers has increased in various application segments, such as large data centers and EV charging points, and industrial DC distribution, due to features such as high current ratings, maintenance, and reusability. The characteristics of air circuit breakers, such as their ability to perform multiple switching operations per cycle and provide customized protection settings, as well as interface with smart monitoring systems, complement their application in DC power systems. Increasing investments in large infrastructure and DC micro-grids also promote the rapid growth of air circuit breakers.
Low Voltage DC Circuit Breaker Market, By Volatge
By voltage, the 380 V-1.5 kV segment is expected to hold the largest market size during the forecast period. The 380 V-1.5 kV segment is anticipated to represent the largest market, given its alignment with the mainly used DC systems. It is largely used in the PV system, Battery Energy Storage system, EV charging system, telecom powers, and data center distribution systems. The growing use of high-voltage architectures based on DC further boosts efficiency, thereby reducing current and cables. The growing adoption of renewable energies and DC-demanding loads in various regions, such as commercial and industrial installations, further fuels the adoption of circuit breakers in the 380 V-1.5 kV segment.
Low Voltage DC Circuit Breaker Market, By Breaking Mechanism
Based on the breaking mechanism, the solid state is expected to witness the highest CAGR during the forecast period. Solid-state DC circuit breakers are anticipated to experience the steepest growth rate in terms of CAGR because of their ultra-fast fault interruption. Solid-state DC circuit breakers have the advantage of interrupting faults in microseconds, unlike mechanical circuit breakers. Therefore, they have applications in sensitive circuits such as data centers, DC microgrids, battery energy storage systems, and power electronics.
Low Voltage DC Circuit Breaker Market, By By End User
Based on end user, data centers are expected to witness the highest CAGR during the forecast period, owing to the growth of cloud computing, artificial intelligence workload, and hyperscale data center deployments globally. DC power distribution systems have become increasingly popular with data center operators to enhance efficient consumption of power and minimize conversion losses. LV DC circuit breakers form an integral part of ensuring safe and reliable operation of DC power distribution systems. The continuous global investments in hyperscale and edge data center deployments, especially within North America and the Asia Pacific regions, have a significant impact on accelerating demand for DC protection innovations.
REGION
Asia Pacific is expected to dominate relay market during forecast period with highest CAGR
The Asia Pacific is expected to have the largest market share in the low-voltage DC circuit breaker market because it is experiencing a high level of industrialization, huge investments in renewable power systems, and DC-based infrastructure development. Countries like China, India, Japan, and South Korea are experiencing significant growth in solar PV systems, battery-based energy storage solutions, EV charging infrastructure, and telecom DC power solutions, which require low-voltage DC circuit protection solutions. In addition, investments in data centers, smart manufacturing solutions, and rail electrification projects have increased the demand for DC circuit breakers. Supporting government policies on renewable energy and electric mobility solutions, low manufacturing costs, and established electrical infrastructure suppliers have also given the Asia Pacific a prominent leadership role in the low-voltage DC circuit breaker market.

LOW VOLTAGE DC CIRCUIT BREAKER MARKET: COMPANY EVALUATION MATRIX
ABB, a leading provider of low-voltage DC circuit breaker solutions, is classified under the “Star” category due to its strong product portfolio. Vendors in the “stars” category generally receive high scores for most evaluation criteria. These players have established product portfolios and a broad market presence. They also devise effective business strategies.

Source: Secondary Research, Interviews with Experts, MarketsandMarkets Analysis
KEY MARKET PLAYERS
- ABB (Switzerland)
- Eaton (Ireland)
- Schneider Electric (France)
- Siemens (Germany)
- LS ELECTRIC Co., Ltd. (South Korea)
- Mitsubishi Electric Corporation (Japan)
- CHINT Global (China)
- Fuji Electric Co., Ltd. (Japan)
- Rockwell Automation (US)
- BENY Electric (China)
- Legrand (France)
- Sécheron (Switzerland)
- Carling Technologies (US)
- CNC ELECTRIC GROUP CO., LTD. (China)
- Onccy Electrical Co., Ltd. (China)
MARKET SCOPE
| REPORT METRIC | DETAILS |
|---|---|
| Market Size in 2024 (Value) | USD 1.70 Billion |
| Market Forecast in 2030 (Value) | USD 2.52 Billion |
| Growth Rate | 7.0% |
| Years Considered | 2025–2030 |
| Base Year | 2024 |
| Forecast Period | 2025–2030 |
| Units Considered | Value (USD Million/Billion) |
| Report Coverage | Revenue forecast, company ranking, competitive landscape, growth factors, and trends |
| Segments Covered |
|
| Regions Covered | Europe, Asia Pacific, North America, South America, Middle East & Africa |
WHAT IS IN IT FOR YOU: LOW VOLTAGE DC CIRCUIT BREAKER MARKET REPORT CONTENT GUIDE

DELIVERED CUSTOMIZATIONS
We have successfully delivered the following deep-dive customizations:
| CLIENT REQUEST | CUSTOMIZATION DELIVERED | VALUE ADDS |
|---|---|---|
| End-user focused analysis beyond standard segmentation | Delivered a deeper analysis of key end users such as solar PV plants, data centers, EV charging infrastructure, and battery energy storage systems | Enables better targeting of high-growth application segments and tailored product positioning |
| Competitive benchmarking of top players | Included a comparative assessment of leading manufacturers based on product portfolio, geographic presence, and DC voltage capabilities | Assists in identifying competitive gaps and differentiation opportunities |
RECENT DEVELOPMENTS
- May 2025 : Fuji Electric Co., Ltd. undertook a major expansion of its transmission and distribution equipment production system, including switchgear, switchboards, and circuit breakers. The company will implement capital investments across its Kawasaki and Chiba factories to boost overall production capacity by 1.5x, with operations ramping up from FY 2026.
- August 2024 : Mitsubishi Electric Corporation signed a contract with Siemens Energy to jointly develop DC switching stations for next-generation multi-terminal HVDC systems, with a key focus on creating detailed DC circuit-breaker requirement specifications to enable stable and flexible future DC grids. This collaboration supports the integration of large-scale renewable energy and strengthens both companies’ positions in advancing critical HVDC protection technologies worldwide.
- July 2024 : Mitsubishi Electric Corporation secured a contract from Kansai Transmission & Distribution to supply its 84 kV dry-air insulated switchgear, which incorporates vacuum circuit breakers and uses synthetic dry air instead of SF6 to deliver a fully greenhouse-gas-free solution. This contract strengthens the deployment of environmentally sustainable switchgear technologies in Japan’s transmission network.
- February 2023 : Rockwell Automation launched its updated Branch Motor Control & Protection product lineup, introducing new Bulletin 140MT motor protection circuit breakers designed with higher short-circuit ratings and improved performance. The launch includes enhanced contactors, relays, and motor-specific circuit breakers that now meet UL and IEC standards, simplifying compliance for users.
Table of Contents
 Exclusive indicates content/data unique to MarketsandMarkets and not available with any competitors.
Methodology
This study involved 4 major activities in estimating the current market size for low voltage DC circiut breaker market. Exhaustive secondary research was done to collect information on the market, the peer market, and the parent market. The next step was to validate these findings, assumptions, and market sizing with industry experts across the value chain through rigorous primary research. Both top-down and bottom-up approaches were used to estimate the total market size. Thereafter, the market breakdown and data triangulation technique was done to estimate the market size of the segments and corresponding sub-segments.
Secondary Research
This research study involved the use of extensive secondary sources, directories, and databases, such as T&D World, Bloomberg Business Week, Factiva, and world energy investment journal, to identify and collect information useful for a technical, market-oriented, and commercial study of the low voltage DC circuit breaker market. The other secondary sources included annual reports, press releases & investor presentations of companies, white papers, certified publications, articles by recognized authors, manufacturer associations, trade directories, and databases.
Primary Research
The low voltage DC circuit breaker market comprises of several stakeholders such as renewable generation; battery systems manufacturers; transmission and distribution companies in the sector; electrical equipment manufacturing companies; low voltage component manufacturers; organizations, forums, & alliances; state & national regulatory authorities; and electrical system designers, owners, & operators. The demand side of this market is characterized by its applications such as industrial, commercial and others, where others include residential consumers. The supply side is characterized by organizations manufacturing low voltage DC circuit breakers and the equipment where low voltage DC circuit breakers are installed. To name a few such companies, there is, ABB, Siemens, Eaton, Tavrida electric, Hitachi, Mitsubishi Electric, and Hyundai Electric Company Various primary sources from both the supply and demand sides of the market were interviewed to obtain qualitative and quantitative information. The breakdown of primary respondents is as following—
To know about the assumptions considered for the study, download the pdf brochure
Market Size Estimation
Both top-down and bottom-up approaches have been used to estimate and validate the size of the global low voltage DC circuit breaker market and its dependent submarkets. These methods were also used extensively to estimate the size of various subsegments in the market. The research methodology used to estimate the market size includes the following:
- The key players in the industry and market have been identified through extensive secondary research and their market shares in the respective regions have been determined through both primary and secondary research.
- The industry’s supply chain and market size, in terms of value, have been determined through primary and secondary research processes.
- All percentage shares, splits, and breakdowns have been determined using secondary sources and verified through primary sources.
Data Triangulation
After arriving at the overall market size—using the market size estimation processes as explained above—the market was split into several segments and subsegments. To complete the overall market engineering process and arrive at the exact statistics of each market segment and subsegment, data triangulation and market breakdown procedures were employed, wherever applicable. The data was triangulated by studying various factors and trends from both, the demand and supply sides, in utilities, battery systems, the solar industry, data centres, transportation, and other sectors.
Report Objectives
- To define, describe, and forecast the global low voltage DC circuit breaker market by end user, application, type, and region
- To provide detailed information on the major factors influencing the growth of the market (drivers, restraints, opportunities, and industry-specific challenges)
- To strategically analyze the market with respect to individual growth trends, prospects, and contribution of each segment to the market
- To analyze market opportunities for stakeholders and details of a competitive landscape for market leaders
- To forecast the growth of the market with respect to the major regions (Asia Pacific, Europe, North America, South America, the Middle East & Africa)
- To strategically profile key players and comprehensively analyze their market rankings and core competencies
- To track and analyze the competitive developments such as contracts & agreements, expansions, new product developments, mergers & acquisitions, and partnerships in the market
Available Customizations:
With the given market data, MarketsandMarkets offers customizations as per the client’s specific needs. The following customization options are available for this report:
Regional Analysis
Further breakdown of region or country-specific analysis
Company Information
Detailed analysis and profiling of additional market players (up to 5)
Need a Tailored Report?
Customize this report to your needs
Get 10% FREE Customization
Customize This ReportPersonalize This Research
- Triangulate with your Own Data
- Get Data as per your Format and Definition
- Gain a Deeper Dive on a Specific Application, Geography, Customer or Competitor
- Any level of Personalization
Let Us Help You
- What are the Known and Unknown Adjacencies Impacting the Low Voltage DC Circuit Breaker Market
- What will your New Revenue Sources be?
- Who will be your Top Customer; what will make them switch?
- Defend your Market Share or Win Competitors
- Get a Scorecard for Target Partners

Custom Market Research Services
We Will Customise The Research For You, In Case The Report Listed Above Does Not Meet With Your Requirements
Get 10% Free Customisation


Growth opportunities and latent adjacency in Low Voltage DC Circuit Breaker Market