The research process for this technical, market-oriented, and commercial study of the neuromorphic computing market included the systematic gathering, recording, and analysis of data about companies operating in the market. It involved the extensive use of secondary sources, directories, and databases (Factiva, Oanda, and OneSource) to identify and collect relevant information. In-depth interviews were conducted with various primary respondents, including experts from core and related industries and preferred manufacturers, to obtain and verify critical qualitative and quantitative information as well as to assess the growth prospects of the market. Key players in the neuromorphic computing market were identified through secondary research, and their market rankings were determined through primary and secondary research. This included studying annual reports of top players and interviewing key industry experts, such as CEOs, directors, and marketing executives.
Secondary Research
In the secondary research process, various secondary sources were used to identify and collect information for this study. These include annual reports, press releases, and investor presentations of companies, whitepapers, certified publications, and articles from recognized associations and government publishing sources. Research reports from a few consortiums and councils were also consulted to structure qualitative content. Secondary sources included corporate filings (such as annual reports, investor presentations, and financial statements); trade, business, and professional associations; white papers; Journals and certified publications; articles by recognized authors; gold-standard and silver-standard websites; directories; and databases. Data was also collected from secondary sources, such as the International Trade Centre (ITC) (Switzerland), and the International Monetary Fund (IMF).
List of key secondary sources
Primary Research
Extensive primary research was accomplished after understanding and analyzing the neuromorphic computing market scenario through secondary research. Several primary interviews were conducted with key opinion leaders from both demand- and supply-side vendors across four major regions—North America, Europe, Asia Pacific, and RoW. Approximately 30% of the primary interviews were conducted with the demand side, and 70% with the supply side. Primary data was collected through questionnaires, emails, and telephonic interviews. Various departments within organizations, such as sales, operations, and administration, were contacted to provide a holistic viewpoint in the report.
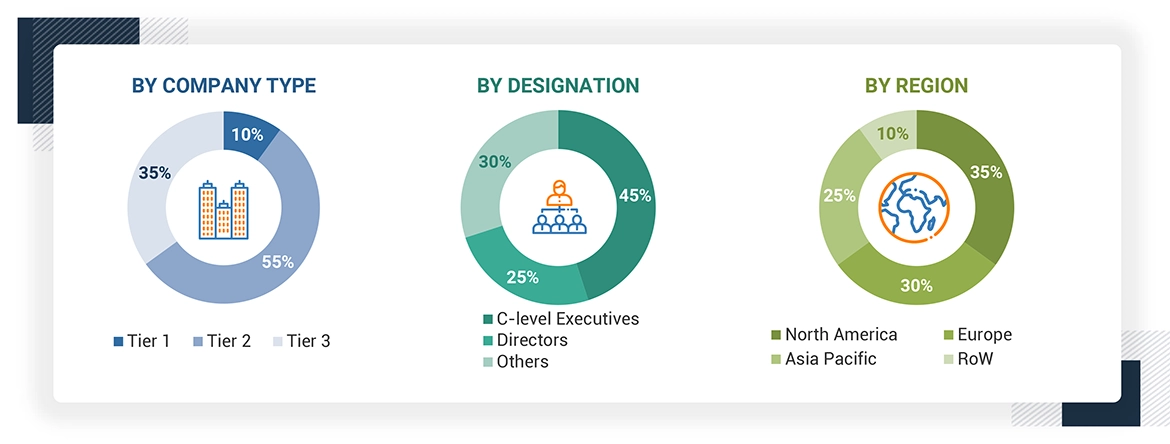
Note: Other designations include technology heads, media analysts, sales managers, marketing managers, and product managers.
The three tiers of the companies are based on their total revenues as of 2023 ? Tier 1: >USD 1 billion, Tier 2: USD 500 million–1 billion, and Tier 3: USD 500 million.
About the assumptions considered for the study, To know download the pdf brochure
Market Size Estimation
In the complete market engineering process, both top-down and bottom-up approaches were used, along with several data triangulation methods, to estimate and forecast the size of the market and its segments and subsegments listed in the report. Extensive qualitative and quantitative analyses were carried out on the complete market engineering process to list the key information/insights pertaining to neuromorphic computing market.
The key players in the market were identified through secondary research, and their rankings in the respective regions determined through primary and secondary research. This entire procedure involved the study of the annual and financial reports of top players, and interviews with industry experts such as chief executive officers, vice presidents, directors, and marketing executives for quantitative and qualitative key insights. All percentage shares, splits, and breakdowns were determined using secondary sources and verified through primary sources. All parameters that affect the markets covered in this research study were accounted for, viewed in extensive detail, verified through primary research, and analyzed to obtain the final quantitative and qualitative data. This data was consolidated, supplemented with detailed inputs and analysis from MarketsandMarkets, and presented in this report.
Bottom-Up Approach
-
Identifying various verticals of neuromorphic computing
-
Analyzing the penetration of each type of neuromorphic computing technology through secondary and primary research
-
Analyzing the penetration of neuromorphic computing for different applications and verticals through secondary and primary research
-
Conducting multiple discussion sessions with key opinion leaders to understand the detailed working of neuromorphic computing and their implementation in multiple applications; this helped analyze the break-up of the scope of work carried out by each major company
-
Verifying and cross-checking the estimates at every level with key opinion leaders, including CEOs, directors, operation managers, and finally with MarketsandMarkets domain experts
-
Studying various paid and unpaid sources of information, such as annual reports, press releases, white papers, and databases
Top-Down Approach
-
Focusing initially on the top-line investments and expenditures being made in the ecosystem of the neuromorphic computing market; further, splitting the key market areas based on offering, deployment, application, vertical, and region, and listing the key developments
-
Identifying all leading players and applications in the neuromorphic computing market based on region through secondary research and thoroughly verifying them through a brief discussion with industry experts
-
Analyzing revenues, product mix, geographic presence, and key applications served by all identified players to estimate and arrive at percentage splits for all key segments
-
Discussing splits with the industry experts to validate the information and identify key growth pockets across all key segments
-
Breaking down the total market based on verified splits and key growth pockets across all segments
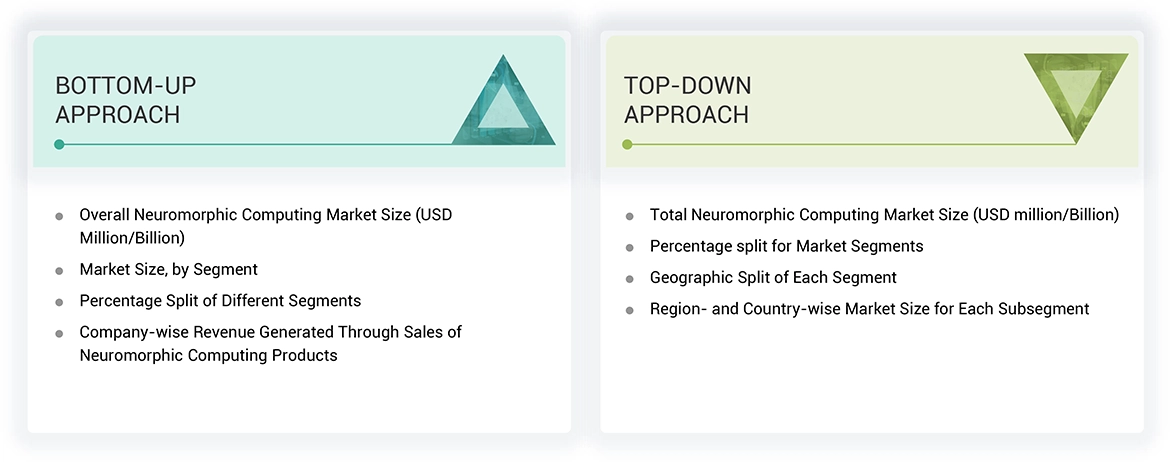
Neuromorphic Computing Market : Top-Down and Bottom-Up Approach
Data Triangulation
After arriving at the overall market size from the market size estimation process explained above, the total market was split into several segments and subsegments. Data triangulation and market breakdown procedures were employed, wherever applicable, to complete the overall market engineering process and arrive at the exact statistics for all segments and subsegments. The data was triangulated by studying various factors and trends from both demand and supply sides. Along with this, the market size was validated using both top-down and bottom-up approaches.


 HIGHEST CAGR MARKET IN 2024-2030
 CHINA FASTEST-GROWING MARKET IN THE REGION
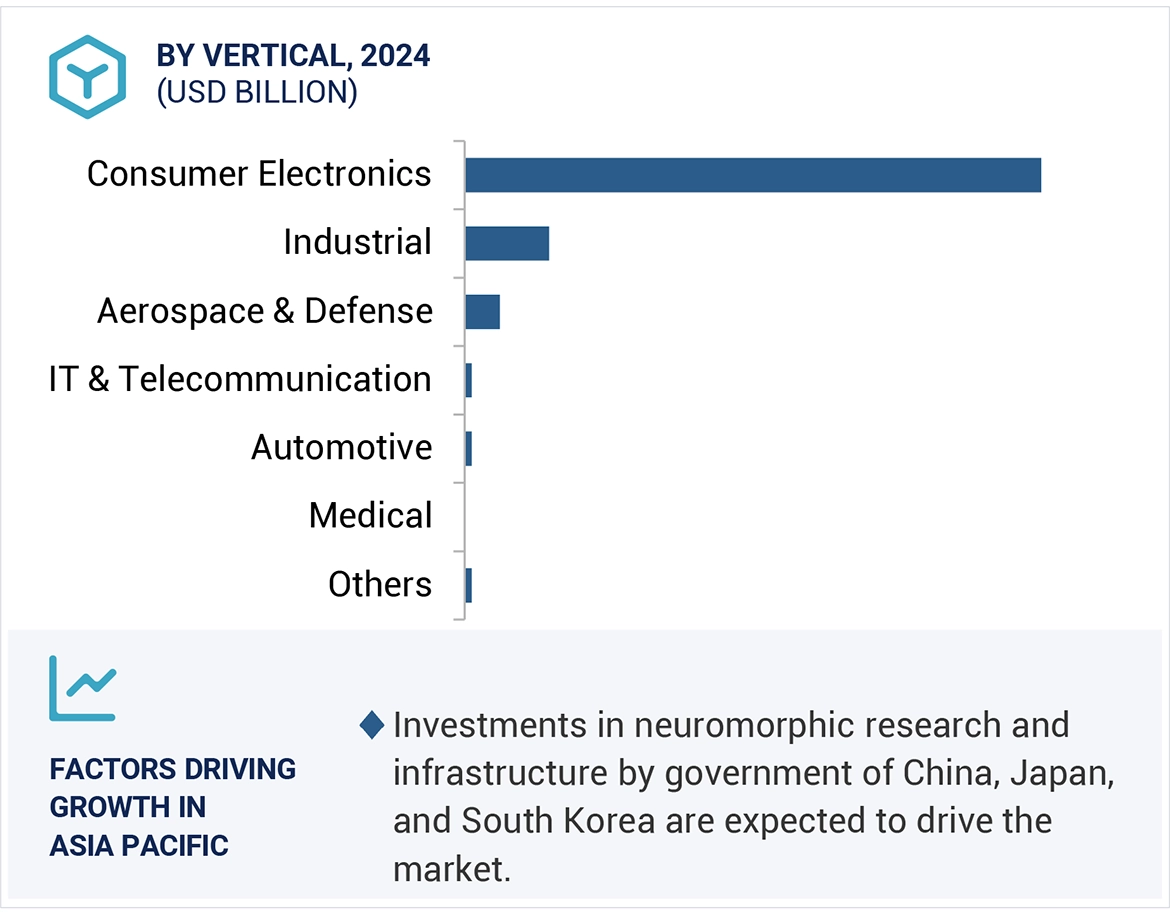


Growth opportunities and latent adjacency in Neuromorphic Computing Market