Rapid Microbiology Testing Market

Rapid Microbiology Testing Market by Product (Instruments (Automated Identification System, PCR, Mass Spectrometer) Reagent, Kits), Method (Growth, Nucleic Acid, Viability), Application (Clinical Diagnosis, Industrial, Research) & Region - Global Forecast to 2029

Report Code: MD 6602 Apr, 2024, by marketsandmarkets.com

The global rapid microbiology testing market in terms of revenue was estimated to be worth $5.2 billion in 2024 and is poised to reach $8.3 billion by 2029, growing at a CAGR of 10.1% from 2024 to 2029. The new research study consists of an industry trend analysis of the market. The new research study consists of industry trends, pricing analysis, patent analysis, conference and webinar materials, key stakeholders, and buying behaviour in the market.

Growth in the market is largely driven by the increasing funding for R&D due to the growing demand for the early diagnosis of infectious diseases and effective remedial treatment, rising need for faster and more accurate microbiology techniques to screen, identify, and test the susceptibility of microbes against pathogens, and continuous developments to enhance the efficacy, efficiency, accuracy, and functionality of rapid microbiology tests. Technological advancements have led to the development of more sophisticated and efficient rapid microbiology testing methods. These advancements include improvements in automation, miniaturization, and detection sensitivity, making rapid testing more accessible and reliable for various applications.

Attractive Opportunities in the Rapid Microbiology Testing Market

Rapid  Microbiology Testing Market

To know about the assumptions considered for the study, Request for Free Sample Report

Rapid  Microbiology Testing Market

Rapid Microbiology Testing Market Dynamics

DRIVER: Technological advancements in rapid microbiology testing

In recent years, there has been a gradual transition from traditional methods of microbiology testing to more rapid approaches, driven by the introduction of newer, faster technologies. These advancements have eliminated the need for the biological amplification of bacteria, resulting in quicker and more efficient detection. The limitations of lengthy procedural times and exposure to pathogenic strains, which are associated with conventional testing methods, have been overcome by these rapid microbiology tests. Various emerging molecular diagnostic techniques are now employed for early detection, utilizing amplification of cellular components such as nucleic acids or employing signal amplification to improve detection capabilities.

RESTRAINT: Unfavorable regulatory and reimbursement environment

Most diagnostic companies face a major challenge in commercializing their tests and getting Medicare and private health insurers to pay for them. This is important not only to help the decision-making process of physicians within the practice of evidence-based medicine but also to achieve regulatory approvals and reimbursements for the tests. However, gathering the data necessary to show clinical validity and utility is a time-consuming and expensive process, further complicated by the lack of standard regulations.

Additionally, the process of obtaining coverage and reimbursement stands as a significant barrier to the widespread adoption of new rapid microbiology tests. The complex and highly diverse reimbursement scenario affects the efficient introduction of precision medicine based on targeted therapies. This, in turn, negatively affects the growth of the market.

OPPORTUNITY: Opportunities for growth in developing countries

Countries such as India, South Korea, Brazil, and Mexico are presenting significant growth prospects for companies involved in the rapid microbiology testing market. This growth can be attributed to several factors including low regulatory hurdles, advancements in healthcare infrastructure, a growing patient base, increasing incidence of infectious diseases, and rising healthcare spending. Additionally, the regulatory frameworks in some of these nations are more flexible and conducive to business compared to those in developed countries. Moreover, substantial investments in healthcare and life science research within these emerging markets are playing a pivotal role in upgrading laboratory infrastructure. These factors collectively are anticipated to support the expansion of the market.

CHALLENGE: Operational Barriers

Clinical laboratories in major markets are still developing, and technicians are encountering operational hurdles in ensuring efficient sample collection, storage, and transport, especially with the integration of new technologies like NGS and lab-on-a-chip PCR devices. Laboratory spaces also require adjustments to accommodate specific diagnostic tests for pathogen detection, minimizing cross-contamination and improving time efficiency. This leads to significant cost increases in maintaining and running advanced rapid microbiology tests, particularly those designed for a single sample type. Additionally, with microbes rapidly mutating and epidemics on the rise, clinical laboratories must embrace innovative technologies capable of swiftly diagnosing samples.

Rapid Microbiology Testing Ecosystem/Industry Map

Rapid  Microbiology Testing Market Ecosystem

Instruments segment accounted for the largest share of the rapid microbiology testing industry in 2023, by product.

The rapid microbiology testing market is categorized into instruments, reagents & kits and consumales, based on the product. In 2023, the instruments segment emerged as the leading sector in the market. The prevailing trend of laboratory automation in clinical settings has contributed to the dominance of this segment. Laboratories are turning to sophisticated instruments to quickly identify pathogens, enabling prompt treatment and containment of infectious outbreaks. This urgency has led to a surge in the adoption of instruments capable of delivering rapid and reliable microbial identification.

The largest share in the rapid microbiology testing industry in 2023 was held by the industrial testing segment, by application.

Categorized by its various applications, the rapid microbiology testing market includes clinical disease diagnosis, industrial testing, and research applications. As of 2023, the largest portion of the market was dominated by the industrial testing segment. This dominance is largely attributed to the widespread adoption of rapid microbiology testing techniques in sectors such as pharmaceuticals, food and beverage, cosmetics, and environmental monitoring. In these sectors, maintaining product quality, safety, and compliance with regulatory guidelines is critical. Rapid microbiology testing enables swift identification and detection of microbial impurities, enabling prompt corrective measures and reducing production interruptions.

North America accounted for the largest share of the rapid microbiology testing industry in 2023.

Categorized into six primary regions, namely North America, Europe, Asia Pacific, Latin America, the Middle East & Africa, and GCC countries, the rapid microbiology testing market witnessed North America taking the forefront in 2023. It secured the largest market share, propelled by a robust research and development infrastructure within the region. This growth is further propelled by the convenient accessibility and widespread uptake of cutting-edge diagnostic technologies, attributed to substantial per capita annual healthcare expenditures by the governments of the United States and Canada. Additionally, the region benefits from proactive government initiatives that raise awareness and encourage the utilization of advanced microbial testing tools among crucial end users.

Rapid  Microbiology Testing Market by Region

To know about the assumptions considered for the study, download the pdf brochure

The major players in this market are bioMérieux SA (France), Becton, Dickinson and Company (US), Danaher Corporation (US), Abbott Laboratories (US), and Thermo Fisher Scientific Inc. (US). These players lead the market because of their extensive product portfolios and wide geographic presence.

Scope of the Rapid Microbiology Testing Industry

Report Metric

Details

Market Revenue in 2024

$5.2 billion

Projected Revenue by 2029

$8.3 billion

Revenue Rate

Poised to Grow at a CAGR of 10.1%

Market Driver

Technological advancements in rapid microbiology testing

Market Opportunity

Opportunities for growth in developing countries

This report categorizes the rapid microbiology testing market to forecast revenue and analyze trends in each of the following submarkets:

By Product

  • Instruments
    • Automated Microbial Identification & Antimicrobial Susceptibility Testing Systems
    • Mass Spectrometers
    • PCR Systems
    • Bioluminescence & Fluorescence-based Detection Systems
    • Cytometers
    • Active Air Samplers
    • Other Instruments
  • Reagents & Kits
    • Sterility Testing Reagents & Kits
    • Other Reagents & Kits
  • Consumables

By Method

  • Growth-based Rapid Microbiology Testing
  • Cellular Component-based Rapid Microbiology Testing
  • Nucleic Acid-based Rapid Microbiology Testing
  • Viability-based Rapid Microbiology Testing
  • Other Rapid Microbiology Testing Methods

By Application

  • Clinical Disease Diagnosis
  • Industrial Testing
    • Food & Beverage Testing
    • Pharmaceutical & Biological Drug Testing
    • Environmental Testing
    • Cosmetics & Personal Care Products Testing
    • Other Industrial Testing Applications
  • Research Applications

By Region

  • North America
    • US
    • Canada
  • Europe
    • Germany
    • France
    • UK
    • Italy
    • Spain
    • Russia
    • Rest of Europe
  • Asia Pacific
    • Japan
    • China
    • India
    • Australia
    • Rest of Asia Pacific
  • Latin America
    • Brazil
    • Mexico
    • Rest of LATAM
  • Middle East & Africa
  • GCC Countries

Recent Developments of Rapid Microbiology Testing Industry:

  • In December 2023, Danaher Corporation (US) acquired Abcam (UK), a company that offers the scientific community validated antibodies, reagents, biomarkers, and assays to address targets in biological pathways that are critical for advancing drug discovery, life sciences research, and diagnostics.
  • In May 2023, bioMérieux SA (France) received the US Food and Drug Administration (FDA) Clinical Laboratory Improvement Amendments (CLIA) waiver for the fast and accurate multiplex PCR-based BIOFIRE SPOTFIRE Respiratory (R) Panel Mini.
  • In November 2022, Thermo Fisher Scientific Inc. (US) introduced the rapid RT-PCR Accula Flu A/Flu B test.
  • In May 2021, Neogen Corporation (US) launched an improved version of its AccuPoint Advanced sanitation monitoring system that is simpler to use and provides results that are easier to analyze.
  • In July 2020, Neogen Corporation (US) launched the advanced Soleris NG microbial testing system.

Frequently Asked Questions (FAQ):

To speak to our analyst for a discussion on the above findings, click Speak to Analyst

TABLE OF CONTENTS
 
1 INTRODUCTION (Page No. - 44)
    1.1 STUDY OBJECTIVES 
    1.2 MARKET DEFINITION 
    1.3 INCLUSIONS & EXCLUSIONS 
    1.4 STUDY SCOPE 
           1.4.1 RAPID MICROBIOLOGY TESTING MARKET
           1.4.2 REGIONS COVERED
           1.4.3 YEARS CONSIDERED
           1.4.4 CURRENCY CONSIDERED
    1.5 RESEARCH LIMITATIONS 
    1.6 STAKEHOLDERS 
    1.7 SUMMARY OF CHANGES 
 
2 RESEARCH METHODOLOGY (Page No. - 50)
    2.1 RESEARCH DATA 
    2.2 RESEARCH APPROACH 
          FIGURE 1 RAPID MICROBIOLOGY TESTING INDUSTRY: RESEARCH DESIGN METHODOLOGY
           2.2.1 SECONDARY DATA
                    2.2.1.1 Key data from secondary sources
           2.2.2 PRIMARY DATA
                    2.2.2.1 Primary sources
                    2.2.2.2 Key data from primary sources
                    2.2.2.3 Key industry insights
                    2.2.2.4 Breakdown of primary interviews
                                FIGURE 2 BREAKDOWN OF PRIMARY INTERVIEWS: SUPPLY-SIDE AND DEMAND-SIDE PARTICIPANTS
                                FIGURE 3 BREAKDOWN OF PRIMARY INTERVIEWS: BY COMPANY TYPE, DESIGNATION,  AND REGION
    2.3 MARKET SIZE ESTIMATION 
           2.3.1 BOTTOM-UP APPROACH
                    2.3.1.1 Approach 1: Company revenue estimation approach
                                FIGURE 4 BOTTOM-UP APPROACH: COMPANY REVENUE ESTIMATION APPROACH
                    2.3.1.2 Approach 2: Presentations of companies and primary interviews
                    2.3.1.3 Growth forecast
                    2.3.1.4 CAGR projections
                                FIGURE 5 CAGR PROJECTIONS: SUPPLY-SIDE ANALYSIS
           2.3.2 TOP-DOWN APPROACH
                    FIGURE 6 MARKET: TOP-DOWN APPROACH
    2.4 MARKET BREAKDOWN & DATA TRIANGULATION 
          FIGURE 7 DATA TRIANGULATION METHODOLOGY
    2.5 MARKET SHARE 
    2.6 STUDY ASSUMPTIONS 
    2.7 GROWTH RATE ASSUMPTIONS 
    2.8 RISK ASSESSMENT 
           2.8.1 RISK ASSESSMENT: MARKET
    2.9 RECESSION IMPACT 
 
3 EXECUTIVE SUMMARY (Page No. - 64)
    FIGURE 8 RAPID MICROBIOLOGY TESTING MARKET, BY PRODUCT, 2024 VS. 2029 (USD MILLION)
    FIGURE 9 RAPID MICROBIOLOGY TESTING INDUSTRY, BY METHOD, 2024 VS. 2029 (USD MILLION)
    FIGURE 10 MARKET, BY APPLICATION, 2024 VS. 2029 (USD MILLION)
    FIGURE 11 MARKET, BY REGION, 2024 VS. 2029 (USD MILLION)
 
4 PREMIUM INSIGHTS (Page No. - 68)
    4.1 RAPID MICROBIOLOGY TESTING MARKET OVERVIEW 
          FIGURE 12 GROWING FOCUS ON EARLY DETECTION OF DISEASES TO SUPPORT MARKET GROWTH DURING FORECAST PERIOD
    4.2 RAPID MICROBIOLOGY TESTING INDUSTRY, BY PRODUCT,  2024 VS. 2029 (USD MILLION) 
          FIGURE 13 INSTRUMENTS SEGMENT TO DOMINATE MARKET DURING FORECAST PERIOD
    4.3 MARKET, BY METHOD,  2024 VS. 2029 (USD MILLION) 
          FIGURE 14 GROWTH-BASED RAPID MICROBIOLOGY TESTING SEGMENT TO ACCOUNT FOR LARGEST MARKET SHARE DURING FORECAST PERIOD
    4.4 MARKET, BY APPLICATION,  2024 VS. 2029 (USD MILLION) 
          FIGURE 15 INDUSTRIAL TESTING SEGMENT TO DOMINATE MARKET DURING FORECAST PERIOD
    4.5 MARKET: GEOGRAPHIC  GROWTH OPPORTUNITIES 
          FIGURE 16 ASIA PACIFIC TO REGISTER HIGHEST GROWTH RATE IN MARKET DURING FORECAST PERIOD
 
5 MARKET OVERVIEW (Page No. - 71)
    5.1 INTRODUCTION 
    5.2 MARKET DYNAMICS 
          FIGURE 17 RAPID MICROBIOLOGY TESTING MARKET: DRIVERS, RESTRAINTS, OPPORTUNITIES, AND CHALLENGES
           5.2.1 DRIVERS
                    5.2.1.1 Increasing incidence of infectious diseases and cancer
                                TABLE 1 ESTIMATED NUMBER OF NEW CANCER CASES FOR BOTH GENDERS (AGE: 0–85+),  2022 VS. 2045
                    5.2.1.2 Technological advancements in rapid microbiology testing
                    5.2.1.3 Increased funding for R&D
                    5.2.1.4 Increased focus on early detection of infectious diseases
           5.2.2 RESTRAINTS
                    5.2.2.1 High capital investments and low cost-benefit ratio
                    5.2.2.2 Unfavorable regulatory and reimbursement scenario
           5.2.3 OPPORTUNITIES
                    5.2.3.1 Growth opportunities in emerging countries
           5.2.4 CHALLENGES
                    5.2.4.1 Operational barriers
    5.3 PRICING ANALYSIS 
          TABLE 2 INDICATIVE PRICING FOR RAPID MICROBIOLOGY TESTING PRODUCTS
          TABLE 3 AVERAGE SELLING PRICE OF RAPID MICROBIOLOGY TESTING PRODUCTS, BY REGION
    5.4 PATENT ANALYSIS 
          FIGURE 18 PATENT ANALYSIS FOR PCR SYSTEMS (JANUARY 2014–DECEMBER 2023)
           5.4.1 LIST OF MAJOR PATENTS
    5.5 VALUE CHAIN ANALYSIS 
          FIGURE 19 VALUE CHAIN ANALYSIS OF RAPID MICROBIOLOGY TESTING INDUSTRY: MAJOR VALUE ADDED DURING MANUFACTURING AND ASSEMBLY PHASES
    5.6 SUPPLY CHAIN ANALYSIS 
          FIGURE 20 MARKET: SUPPLY CHAIN ANALYSIS
    5.7 TRADE ANALYSIS 
           5.7.1 TRADE ANALYSIS FOR DIAGNOSTIC AND LABORATORY REAGENTS
                    TABLE 4 IMPORT DATA FOR DIAGNOSTIC AND LABORATORY REAGENTS, BY COUNTRY,  2018–2022 (USD MILLION)
                    TABLE 5 EXPORT DATA FOR DIAGNOSTIC AND LABORATORY REAGENTS, BY COUNTRY,  2018–2022 (USD MILLION)
    5.8 ECOSYSTEM ANALYSIS 
          FIGURE 21 MARKET: ECOSYSTEM ANALYSIS
           5.8.1 MARKET: ROLE IN ECOSYSTEM
    5.9 PORTER’S FIVE FORCES ANALYSIS 
          TABLE 6 MARKET: PORTER’S FIVE FORCES ANALYSIS
           5.9.1 THREAT OF NEW ENTRANTS
           5.9.2 THREAT OF SUBSTITUTES
           5.9.3 BARGAINING POWER OF BUYERS
           5.9.4 BARGAINING POWER OF SUPPLIERS
           5.9.5 INTENSITY OF COMPETITIVE RIVALRY
    5.10 REGULATORY LANDSCAPE 
           5.10.1 REGULATORY BODIES, GOVERNMENT AGENCIES, AND OTHER ORGANIZATIONS
                     TABLE 7 NORTH AMERICA: REGULATORY BODIES, GOVERNMENT AGENCIES,  AND OTHER ORGANIZATIONS
                     TABLE 8 ASIA PACIFIC: REGULATORY BODIES, GOVERNMENT AGENCIES, AND OTHER ORGANIZATIONS
                     TABLE 9 LATIN AMERICA: REGULATORY BODIES, GOVERNMENT AGENCIES, AND OTHER ORGANIZATIONS
                     TABLE 10 REST OF THE WORLD: REGULATORY BODIES, GOVERNMENT AGENCIES,  AND OTHER ORGANIZATIONS
           5.10.2 NORTH AMERICA
                    5.10.2.1 US
                    5.10.2.2 Canada
           5.10.3 EUROPE
                     TABLE 11 EUROPE: CLASSIFICATION OF DEVICES
           5.10.4 ASIA PACIFIC
                    5.10.4.1 China
                    5.10.4.2 Japan
                                 TABLE 12 JAPAN: TIME, COST, AND COMPLEXITY OF REGISTRATION PROCESS
                    5.10.4.3 India
           5.10.5 LATIN AMERICA
                    5.10.5.1 Brazil
                    5.10.5.2 Mexico
           5.10.6 MIDDLE EAST
                    5.10.6.1 Africa
    5.11 TECHNOLOGY ANALYSIS 
           5.11.1 KEY TECHNOLOGIES
                    5.11.1.1 Automated multiplex PCR systems
           5.11.2 COMPLEMENTARY TECHNOLOGIES
                    5.11.2.1 Optical immunosensors
                    5.11.2.2 Electrochemical immunosensors
           5.11.3 ADJACENT TECHNOLOGIES
                    5.11.3.1 MALDI-TOF mass spectrometry
    5.12 KEY CONFERENCES & EVENTS IN 2024–2025 
           TABLE 13 MARKET: DETAILED LIST OF CONFERENCES & EVENTS
    5.13 TRENDS/DISRUPTIONS IMPACTING CUSTOMERS’ BUSINESSES 
           5.13.1 REVENUE SHIFT & REVENUE POCKETS FOR MARKET
           5.13.2 REVENUE SHIFT IN MARKET
    5.14 KEY STAKEHOLDERS & BUYING CRITERIA 
           5.14.1 KEY STAKEHOLDERS IN BUYING PROCESS
                     FIGURE 22 INFLUENCE OF STAKEHOLDERS ON BUYING PROCESS OF RAPID MICROBIOLOGY TESTING PRODUCTS
                     TABLE 14 INFLUENCE OF STAKEHOLDERS ON BUYING PROCESS OF RAPID MICROBIOLOGY TESTING PRODUCTS (%)
           5.14.2 BUYING CRITERIA
                     FIGURE 23 KEY BUYING CRITERIA FOR RAPID MICROBIOLOGY TESTING PRODUCTS
                     TABLE 15 KEY BUYING CRITERIA FOR RAPID MICROBIOLOGY TESTING PRODUCTS
    5.15 INVESTMENT & FUNDING SCENARIO 
           FIGURE 24 MARKET: INVESTMENT & FUNDING SCENARIO
 
6 RAPID MICROBIOLOGY TESTING MARKET, BY PRODUCT (Page No. - 95)
    6.1 INTRODUCTION 
          TABLE 16 RAPID MICROBIOLOGY TESTING INDUSTRY, BY PRODUCT, 2022–2029 (USD MILLION)
    6.2 INSTRUMENTS 
          TABLE 17 KEY PRODUCTS IN RAPID MICROBIOLOGY TESTING INSTRUMENTS MARKET
          TABLE 18 RAPID MICROBIOLOGY TESTING INSTRUMENTS MARKET, BY REGION, 2022–2029 (USD MILLION)
          TABLE 19 RAPID MICROBIOLOGY TESTING INSTRUMENTS MARKET, BY TYPE, 2022–2029 (USD MILLION)
          TABLE 20 NORTH AMERICA: RAPID MICROBIOLOGY TESTING INSTRUMENTS MARKET, BY COUNTRY, 2022–2029 (USD MILLION)
          TABLE 21 EUROPE: RAPID MICROBIOLOGY TESTING INSTRUMENTS MARKET, BY COUNTRY,  2022–2029 (USD MILLION)
          TABLE 22 ASIA PACIFIC: RAPID MICROBIOLOGY TESTING INSTRUMENTS MARKET, BY COUNTRY, 2022–2029 (USD MILLION)
          TABLE 23 LATIN AMERICA: RAPID MICROBIOLOGY TESTING INSTRUMENTS MARKET, BY COUNTRY, 2022–2029 (USD MILLION)
           6.2.1 AUTOMATED MICROBIAL IDENTIFICATION & ANTIMICROBIAL SUSCEPTIBILITY TESTING SYSTEMS
                    6.2.1.1 Ease of use compared to conventional identification processes to support market growth
                                TABLE 24 MARKET FOR AUTOMATED MICROBIAL  IDENTIFICATION & ANTIMICROBIAL SUSCEPTIBILITY TESTING SYSTEMS, BY REGION, 2022–2029 (USD MILLION)
                                TABLE 25 NORTH AMERICA: MARKET FOR AUTOMATED MICROBIAL IDENTIFICATION & ANTIMICROBIAL SUSCEPTIBILITY TESTING SYSTEMS, BY COUNTRY, 2022–2029 (USD MILLION)
                                TABLE 26 EUROPE: MARKET FOR AUTOMATED MICROBIAL IDENTIFICATION & ANTIMICROBIAL SUSCEPTIBILITY TESTING SYSTEMS, BY COUNTRY, 2022–2029 (USD MILLION)
                                TABLE 27 ASIA PACIFIC: MARKET FOR AUTOMATED MICROBIAL IDENTIFICATION & ANTIMICROBIAL SUSCEPTIBILITY TESTING SYSTEMS, BY COUNTRY, 2022–2029 (USD MILLION)
                                TABLE 28 LATIN AMERICA: MARKET FOR AUTOMATED MICROBIAL IDENTIFICATION & ANTIMICROBIAL SUSCEPTIBILITY TESTING SYSTEMS, BY COUNTRY, 2022–2029 (USD MILLION)
           6.2.2 MASS SPECTROMETERS
                    6.2.2.1 Rapid results associated with mass spectrometry methods to boost adoption
                                TABLE 29 MARKET FOR MASS SPECTROMETERS, BY REGION, 2022–2029 (USD MILLION)
                                TABLE 30 NORTH AMERICA: MARKET FOR MASS SPECTROMETERS, BY COUNTRY, 2022–2029 (USD MILLION)
                                TABLE 31 EUROPE: MARKET FOR MASS SPECTROMETERS,  BY COUNTRY, 2022–2029 (USD MILLION)
                                TABLE 32 ASIA PACIFIC: MARKET FOR MASS SPECTROMETERS,  BY COUNTRY, 2022–2029 (USD MILLION)
                                TABLE 33 LATIN AMERICA: MARKET FOR MASS SPECTROMETERS, BY COUNTRY, 2022–2029 (USD MILLION)
           6.2.3 BIOLUMINESCENCE & FLUORESCENCE-BASED DETECTION SYSTEMS
                    6.2.3.1 Unwanted detection of non-microbial ATP to limit market adoption
                                TABLE 34 MARKET FOR BIOLUMINESCENCE & FLUORESCENCE-BASED DETECTION SYSTEMS, BY REGION, 2022–2029 (USD MILLION)
                                TABLE 35 NORTH AMERICA: MARKET FOR BIOLUMINESCENCE & FLUORESCENCE-BASED DETECTION SYSTEMS, BY COUNTRY, 2022–2029 (USD MILLION)
                                TABLE 36 EUROPE: MARKET FOR BIOLUMINESCENCE & FLUORESCENCE-BASED DETECTION SYSTEMS, BY COUNTRY, 2022–2029 (USD MILLION)
                                TABLE 37 ASIA PACIFIC: MARKET FOR BIOLUMINESCENCE & FLUORESCENCE-BASED DETECTION SYSTEMS, BY COUNTRY, 2022–2029 (USD MILLION)
                                TABLE 38 LATIN AMERICA: MARKET FOR BIOLUMINESCENCE & FLUORESCENCE-BASED DETECTION SYSTEMS, BY COUNTRY, 2022–2029 (USD MILLION)
           6.2.4 PCR SYSTEMS
                    6.2.4.1 Growing use of standard PCR, real-time PCR, and qPCR for rapid microbial testing to support growth
                                TABLE 39 MARKET FOR PCR SYSTEMS, BY REGION,  2022–2029 (USD MILLION)
                                TABLE 40 NORTH AMERICA: MARKET FOR PCR SYSTEMS,  BY COUNTRY, 2022–2029 (USD MILLION)
                                TABLE 41 EUROPE: MARKET FOR PCR SYSTEMS, BY COUNTRY, 2022–2029 (USD MILLION)
                                TABLE 42 ASIA PACIFIC: MARKET FOR PCR SYSTEMS, BY COUNTRY, 2022–2029 (USD MILLION)
                                TABLE 43 LATIN AMERICA: MARKET FOR PCR SYSTEMS,  BY COUNTRY, 2022–2029 (USD MILLION)
           6.2.5 CYTOMETERS
                    6.2.5.1 Ability to detect viable organisms to favor market growth
                                TABLE 44 MARKET FOR CYTOMETERS, BY REGION,  2022–2029 (USD MILLION)
                                TABLE 45 NORTH AMERICA: MARKET FOR CYTOMETERS,  BY COUNTRY, 2022–2029 (USD MILLION)
                                TABLE 46 EUROPE: MARKET FOR CYTOMETERS, BY COUNTRY, 2022–2029 (USD MILLION)
                                TABLE 47 ASIA PACIFIC: MARKET FOR CYTOMETERS, BY COUNTRY, 2022–2029 (USD MILLION)
                                TABLE 48 LATIN AMERICA: MARKET FOR CYTOMETERS,  BY COUNTRY, 2022–2029 (USD MILLION)
           6.2.6 ACTIVE AIR SAMPLERS
                    6.2.6.1 Convenience and ease of use to drive demand for active air samplers
                                TABLE 49 MARKET FOR ACTIVE AIR SAMPLERS, BY REGION,  2022–2029 (USD MILLION)
                                TABLE 50 NORTH AMERICA: MARKET FOR ACTIVE AIR SAMPLERS, BY COUNTRY, 2022–2029 (USD MILLION)
                                TABLE 51 EUROPE: MARKET FOR ACTIVE AIR SAMPLERS,  BY COUNTRY, 2022–2029 (USD MILLION)
                                TABLE 52 ASIA PACIFIC: MARKET FOR ACTIVE AIR SAMPLERS,  BY COUNTRY, 2022–2029 (USD MILLION)
                                TABLE 53 LATIN AMERICA: MARKET FOR ACTIVE AIR SAMPLERS,  BY COUNTRY, 2022–2029 (USD MILLION)
           6.2.7 OTHER INSTRUMENTS
                    TABLE 54 MARKET FOR OTHER INSTRUMENTS, BY REGION,  2022–2029 (USD MILLION)
                    TABLE 55 NORTH AMERICA: MARKET FOR OTHER INSTRUMENTS, BY COUNTRY, 2022–2029 (USD MILLION)
                    TABLE 56 EUROPE: MARKET FOR OTHER INSTRUMENTS,  BY COUNTRY, 2022–2029 (USD MILLION)
                    TABLE 57 ASIA PACIFIC: MARKET FOR OTHER INSTRUMENTS,  BY COUNTRY, 2022–2029 (USD MILLION)
                    TABLE 58 LATIN AMERICA: MARKET FOR OTHER INSTRUMENTS,  BY COUNTRY, 2022–2029 (USD MILLION)
    6.3 REAGENTS & KITS 
          TABLE 59 RAPID MICROBIOLOGY TESTING REAGENTS & KITS MARKET, BY REGION,  2022–2029 (USD MILLION)
          TABLE 60 RAPID MICROBIOLOGY TESTING REAGENTS & KITS MARKET, BY TYPE,  2022–2029 (USD MILLION)
          TABLE 61 NORTH AMERICA: RAPID MICROBIOLOGY TESTING REAGENTS & KITS MARKET,  BY COUNTRY, 2022–2029 (USD MILLION)
          TABLE 62 EUROPE: RAPID MICROBIOLOGY TESTING REAGENTS & KITS MARKET, BY COUNTRY, 2022–2029 (USD MILLION)
          TABLE 63 ASIA PACIFIC: RAPID MICROBIOLOGY TESTING REAGENTS & KITS MARKET, BY COUNTRY, 2022–2029 (USD MILLION)
          TABLE 64 LATIN AMERICA: RAPID MICROBIOLOGY TESTING REAGENTS & KITS MARKET,  BY COUNTRY, 2022–2029 (USD MILLION)
           6.3.1 STERILITY REAGENTS & KITS
                    6.3.1.1 Increasing adoption of BET assays to propel market growth
                                TABLE 65 MARKET FOR STERILITY TESTING REAGENTS & KITS,  BY REGION, 2022–2029 (USD MILLION)
                                TABLE 66 NORTH AMERICA: MARKET FOR STERILITY TESTING REAGENTS & KITS, BY COUNTRY, 2022–2029 (USD MILLION)
                                TABLE 67 EUROPE: MARKET FOR STERILITY TESTING REAGENTS & KITS, BY COUNTRY, 2022–2029 (USD MILLION)
                                TABLE 68 ASIA PACIFIC: MARKET FOR STERILITY TESTING REAGENTS & KITS, BY COUNTRY, 2022–2029 (USD MILLION)
                                TABLE 69 LATIN AMERICA: MARKET FOR STERILITY TESTING REAGENTS & KITS, BY COUNTRY, 2022–2029 (USD MILLION)
           6.3.2 OTHER REAGENTS & KITS
                    TABLE 70 MARKET FOR OTHER REAGENTS & KITS, BY REGION, 2022–2029 (USD MILLION)
                    TABLE 71 NORTH AMERICA: MARKET FOR OTHER REAGENTS & KITS, BY COUNTRY, 2022–2029 (USD MILLION)
                    TABLE 72 EUROPE: MARKET FOR OTHER REAGENTS & KITS,  BY COUNTRY, 2022–2029 (USD MILLION)
                    TABLE 73 ASIA PACIFIC: MARKET FOR OTHER REAGENTS & KITS,  BY COUNTRY, 2022–2029 (USD MILLION)
                    TABLE 74 LATIN AMERICA: MARKET FOR OTHER REAGENTS & KITS, BY COUNTRY, 2022–2029 (USD MILLION)
    6.4 CONSUMABLES 
           6.4.1 DEVELOPMENT OF AUTOMATED ZONE READERS AND DISPENSERS TO DRIVE MARKET GROWTH
                    TABLE 75 RAPID MICROBIOLOGY TESTING CONSUMABLES MARKET, BY REGION,  2022–2029 (USD MILLION)
                    TABLE 76 NORTH AMERICA: RAPID MICROBIOLOGY TESTING CONSUMABLES MARKET,  BY COUNTRY, 2022–2029 (USD MILLION)
                    TABLE 77 EUROPE: RAPID MICROBIOLOGY TESTING CONSUMABLES MARKET, BY COUNTRY,  2022–2029 (USD MILLION)
                    TABLE 78 ASIA PACIFIC: RAPID MICROBIOLOGY TESTING CONSUMABLES MARKET, BY COUNTRY, 2022–2029 (USD MILLION)
                    TABLE 79 LATIN AMERICA: RAPID MICROBIOLOGY TESTING CONSUMABLES MARKET, BY COUNTRY, 2022–2029 (USD MILLION)
 
7 RAPID MICROBIOLOGY TESTING MARKET, BY METHOD (Page No. - 133)
    7.1 INTRODUCTION 
          TABLE 80 RAPID MICROBIOLOGY TESTING INDUSTRY, BY METHOD, 2022–2029 (USD MILLION)
          TABLE 81 TYPES OF TECHNOLOGIES USED IN VARIOUS RAPID MICROBIOLOGY TESTING METHODS
    7.2 GROWTH-BASED RAPID MICROBIOLOGY TESTING 
           7.2.1 GROWING DEMAND FOR GROWTH-BASED RAPID MICROBIOLOGY TESTING TO DRIVE MARKET GROWTH
                    TABLE 82 MARKET, BY REGION,  2022–2029 (USD MILLION)
                    TABLE 83 NORTH AMERICA: MARKET,  BY COUNTRY, 2022–2029 (USD MILLION)
                    TABLE 84 EUROPE: MARKET, BY COUNTRY,  2022–2029 (USD MILLION)
                    TABLE 85 ASIA PACIFIC: MARKET, BY COUNTRY, 2022–2029 (USD MILLION)
                    TABLE 86 LATIN AMERICA: MARKET, BY COUNTRY, 2022–2029 (USD MILLION)
    7.3 CELLULAR COMPONENT-BASED RAPID MICROBIOLOGY TESTING 
           7.3.1 HIGH LEVEL OF SENSITIVITY, ACCURACY, AND SPECIFICITY ASSOCIATED WITH THIS METHOD TO BOOST MARKET
                    TABLE 87 MARKET, BY REGION, 2022–2029 (USD MILLION)
                    TABLE 88 NORTH AMERICA: MARKET, BY COUNTRY, 2022–2029 (USD MILLION)
                    TABLE 89 EUROPE: MARKET,  BY COUNTRY, 2022–2029 (USD MILLION)
                    TABLE 90 ASIA PACIFIC: MARKET, BY COUNTRY, 2022–2029 (USD MILLION)
                    TABLE 91 LATIN AMERICA: MARKET, BY COUNTRY, 2022–2029 (USD MILLION)
    7.4 NUCLEIC ACID-BASED RAPID MICROBIOLOGY TESTING 
           7.4.1 HIGH ACCURACY ASSOCIATED WITH NUCLEIC ACID-BASED METHODS TO FAVOR MARKET GROWTH
                    TABLE 92 MARKET, BY REGION,  2022–2029 (USD MILLION)
                    TABLE 93 NORTH AMERICA: MARKET,  BY COUNTRY, 2022–2029 (USD MILLION)
                    TABLE 94 EUROPE: MARKET, BY COUNTRY, 2022–2029 (USD MILLION)
                    TABLE 95 ASIA PACIFIC: MARKET,  BY COUNTRY, 2022–2029 (USD MILLION)
                    TABLE 96 LATIN AMERICA: MARKET,  BY COUNTRY, 2022–2029 (USD MILLION)
    7.5 VIABILITY-BASED RAPID MICROBIOLOGY TESTING 
           7.5.1 NEAR REAL-TIME DETECTION AND IMPROVED ACCURACY TO DRIVE DEMAND
                    TABLE 97 MARKET, BY REGION,  2022–2029 (USD MILLION)
                    TABLE 98 NORTH AMERICA: MARKET,  BY COUNTRY, 2022–2029 (USD MILLION)
                    TABLE 99 EUROPE: MARKET, BY COUNTRY, 2022–2029 (USD MILLION)
                    TABLE 100 ASIA PACIFIC: MARKET, BY COUNTRY, 2022–2029 (USD MILLION)
                    TABLE 101 LATIN AMERICA: MARKET,  BY COUNTRY, 2022–2029 (USD MILLION)
    7.6 OTHER RAPID MICROBIOLOGY TESTING METHODS 
          TABLE 102 OTHER RAPID MICROBIOLOGY TESTING METHODS MARKET, BY REGION,  2022–2029 (USD MILLION)
          TABLE 103 NORTH AMERICA: OTHER RAPID MICROBIOLOGY TESTING METHODS MARKET,  BY COUNTRY, 2022–2029 (USD MILLION)
          TABLE 104 EUROPE: OTHER RAPID MICROBIOLOGY TESTING METHODS MARKET, BY COUNTRY, 2022–2029 (USD MILLION)
          TABLE 105 ASIA PACIFIC: OTHER RAPID MICROBIOLOGY TESTING METHODS MARKET, BY COUNTRY, 2022–2029 (USD MILLION)
          TABLE 106 LATIN AMERICA: OTHER RAPID MICROBIOLOGY TESTING METHODS MARKET,  BY COUNTRY, 2022–2029 (USD MILLION)
 
8 RAPID MICROBIOLOGY TESTING MARKET, BY APPLICATION (Page No. - 151)
    8.1 INTRODUCTION 
          TABLE 107 RAPID MICROBIOLOGY TESTING INDUSTRY, BY APPLICATION, 2022–2029 (USD MILLION)
           8.1.1 PRIMARY NOTES
                    8.1.1.1 Key industry insights
    8.2 INDUSTRIAL TESTING 
          TABLE 108 MARKET FOR INDUSTRIAL TESTING APPLICATIONS,  BY REGION, 2022–2029 (USD MILLION)
          TABLE 109 MARKET FOR INDUSTRIAL TESTING APPLICATIONS,  BY TYPE, 2022–2029 (USD MILLION)
          TABLE 110 NORTH AMERICA: MARKET FOR INDUSTRIAL TESTING APPLICATIONS, BY COUNTRY, 2022–2029 (USD MILLION)
          TABLE 111 EUROPE: MARKET FOR INDUSTRIAL TESTING APPLICATIONS, BY COUNTRY, 2022–2029 (USD MILLION)
          TABLE 112 ASIA PACIFIC: MARKET FOR INDUSTRIAL TESTING APPLICATIONS, BY COUNTRY, 2022–2029 (USD MILLION)
          TABLE 113 LATIN AMERICA: MARKET FOR INDUSTRIAL TESTING APPLICATIONS, BY COUNTRY, 2022–2029 (USD MILLION)
           8.2.1 FOOD & BEVERAGE TESTING
                    8.2.1.1 Stringent quality control and quality assurance processes to drive market growth
                                TABLE 114 MARKET FOR FOOD & BEVERAGE TESTING APPLICATIONS, BY REGION, 2022–2029 (USD MILLION)
                                TABLE 115 NORTH AMERICA: MARKET FOR FOOD & BEVERAGE TESTING APPLICATIONS, BY COUNTRY, 2022–2029 (USD MILLION)
                                TABLE 116 EUROPE: MARKET FOR FOOD & BEVERAGE TESTING APPLICATIONS, BY COUNTRY, 2022–2029 (USD MILLION)
                                TABLE 117 ASIA PACIFIC: MARKET FOR FOOD & BEVERAGE TESTING APPLICATIONS, BY COUNTRY, 2022–2029 (USD MILLION)
                                TABLE 118 LATIN AMERICA: MARKET FOR FOOD & BEVERAGE TESTING APPLICATIONS, BY COUNTRY, 2022–2029 (USD MILLION)
           8.2.2 PHARMACEUTICAL & BIOLOGICAL DRUG TESTING
                    8.2.2.1 Improved regulatory scenario for drug development to support market growth
                                TABLE 119 MARKET FOR PHARMACEUTICAL & BIOLOGICAL DRUG TESTING APPLICATIONS, BY REGION, 2022–2029 (USD MILLION)
                                TABLE 120 NORTH AMERICA: MARKET FOR PHARMACEUTICAL & BIOLOGICAL DRUG TESTING APPLICATIONS, BY COUNTRY, 2022–2029 (USD MILLION)
                                TABLE 121 EUROPE: MARKET FOR PHARMACEUTICAL & BIOLOGICAL DRUG TESTING APPLICATIONS, BY COUNTRY, 2022–2029 (USD MILLION)
                                TABLE 122 ASIA PACIFIC: MARKET FOR PHARMACEUTICAL & BIOLOGICAL DRUG TESTING APPLICATIONS, BY COUNTRY, 2022–2029 (USD MILLION)
                                TABLE 123 LATIN AMERICA: MARKET FOR PHARMACEUTICAL & BIOLOGICAL DRUG TESTING APPLICATIONS, BY COUNTRY, 2022–2029 (USD MILLION)
           8.2.3 ENVIRONMENTAL TESTING
                    8.2.3.1 Growing focus on environmental monitoring to boost segmental growth
                                TABLE 124 MARKET FOR ENVIRONMENTAL TESTING APPLICATIONS, BY REGION, 2022–2029 (USD MILLION)
                                TABLE 125 NORTH AMERICA: MARKET FOR ENVIRONMENTAL TESTING APPLICATIONS, BY COUNTRY, 2022–2029 (USD MILLION)
                                TABLE 126 EUROPE: MARKET FOR ENVIRONMENTAL TESTING APPLICATIONS, BY COUNTRY, 2022–2029 (USD MILLION)
                                TABLE 127 ASIA PACIFIC: MARKET FOR ENVIRONMENTAL TESTING APPLICATIONS, BY COUNTRY, 2022–2029 (USD MILLION)
                                TABLE 128 LATIN AMERICA: MARKET FOR ENVIRONMENTAL TESTING APPLICATIONS, BY COUNTRY, 2022–2029 (USD MILLION)
           8.2.4 COSMETICS & PERSONAL CARE PRODUCTS TESTING
                    8.2.4.1 Growing use of rapid microbiology testing in these industries to determine presence of microbes to favor market growth
                                TABLE 129 MARKET FOR COSMETICS & PERSONAL CARE PRODUCTS TESTING APPLICATIONS, BY REGION, 2022–2029 (USD MILLION)
                                TABLE 130 NORTH AMERICA: MARKET FOR COSMETICS & PERSONAL CARE PRODUCTS TESTING APPLICATIONS, BY COUNTRY,  2022–2029 (USD MILLION)
                                TABLE 131 EUROPE: MARKET FOR COSMETICS & PERSONAL CARE PRODUCTS TESTING APPLICATIONS, BY COUNTRY, 2022–2029 (USD MILLION)
                                TABLE 132 ASIA PACIFIC: MARKET FOR COSMETICS & PERSONAL CARE PRODUCTS TESTING APPLICATIONS, BY COUNTRY, 2022–2029 (USD MILLION)
                                TABLE 133 LATIN AMERICA: MARKET FOR COSMETICS & PERSONAL CARE PRODUCTS TESTING APPLICATIONS, BY COUNTRY, 2022–2029 (USD MILLION)
           8.2.5 OTHER INDUSTRIAL TESTING APPLICATIONS
                    TABLE 134 MARKET FOR OTHER INDUSTRIAL TESTING APPLICATIONS, BY REGION, 2022–2029 (USD MILLION)
                    TABLE 135 NORTH AMERICA: MARKET FOR OTHER INDUSTRIAL TESTING APPLICATIONS, BY COUNTRY, 2022–2029 (USD MILLION)
                    TABLE 136 EUROPE: MARKET FOR OTHER INDUSTRIAL TESTING APPLICATIONS, BY COUNTRY, 2022–2029 (USD MILLION)
                    TABLE 137 ASIA PACIFIC: MARKET FOR OTHER INDUSTRIAL TESTING APPLICATIONS, BY COUNTRY, 2022–2029 (USD MILLION)
                    TABLE 138 LATIN AMERICA: MARKET FOR OTHER INDUSTRIAL TESTING APPLICATIONS, BY COUNTRY, 2022–2029 (USD MILLION)
    8.3 CLINICAL DISEASE DIAGNOSIS 
           8.3.1 HIGH BURDEN OF INFECTIOUS DISEASES AND HAIS TO PROPEL MARKET GROWTH
                    TABLE 139 MARKET FOR CLINICAL DISEASE DIAGNOSIS APPLICATIONS, BY REGION, 2022–2029 (USD MILLION)
                    TABLE 140 NORTH AMERICA: MARKET FOR CLINICAL DISEASE DIAGNOSIS APPLICATIONS, BY COUNTRY, 2022–2029 (USD MILLION)
                    TABLE 141 EUROPE: MARKET FOR CLINICAL DISEASE DIAGNOSIS APPLICATIONS, BY COUNTRY, 2022–2029 (USD MILLION)
                    TABLE 142 ASIA PACIFIC: MARKET FOR CLINICAL DISEASE DIAGNOSIS APPLICATIONS, BY COUNTRY, 2022–2029 (USD MILLION)
                    TABLE 143 LATIN AMERICA: MARKET FOR CLINICAL DISEASE DIAGNOSIS APPLICATIONS, BY COUNTRY, 2022–2029 (USD MILLION)
    8.4 RESEARCH APPLICATIONS 
           8.4.1 INCREASING NUMBER OF EPIDEMIOLOGY-BASED RESEARCH STUDIES TO DRIVE MARKET GROWTH
                    TABLE 144 MARKET FOR RESEARCH APPLICATIONS, BY REGION, 2022–2029 (USD MILLION)
                    TABLE 145 NORTH AMERICA: MARKET FOR RESEARCH APPLICATIONS, BY COUNTRY, 2022–2029 (USD MILLION)
                    TABLE 146 EUROPE: MARKET FOR RESEARCH APPLICATIONS,  BY COUNTRY, 2022–2029 (USD MILLION)
                    TABLE 147 ASIA PACIFIC: MARKET FOR RESEARCH APPLICATIONS, BY COUNTRY, 2022–2029 (USD MILLION)
                    TABLE 148 LATIN AMERICA: MARKET FOR RESEARCH APPLICATIONS, BY COUNTRY, 2022–2029 (USD MILLION)
 
9 RAPID MICROBIOLOGY TESTING MARKET, BY REGION (Page No. - 178)
    9.1 INTRODUCTION 
          TABLE 149 RAPID MICROBIOLOGY TESTING INDUSTRY, BY REGION, 2022–2029 (USD MILLION)
    9.2 NORTH AMERICA 
          FIGURE 25 NORTH AMERICA: RAPID MICROBIOLOGY TESTING MARKET SNAPSHOT
          TABLE 150 NORTH AMERICA: MARKET, BY COUNTRY,  2022–2029 (USD MILLION)
          TABLE 151 NORTH AMERICA: MARKET, BY PRODUCT,  2022–2029 (USD MILLION)
          TABLE 152 NORTH AMERICA: RAPID MICROBIOLOGY TESTING INSTRUMENTS MARKET, BY TYPE, 2022–2029 (USD MILLION)
          TABLE 153 NORTH AMERICA: RAPID MICROBIOLOGY TESTING REAGENTS & KITS MARKET, BY TYPE, 2022–2029 (USD MILLION)
          TABLE 154 NORTH AMERICA: MARKET, BY METHOD,  2022–2029 (USD MILLION)
          TABLE 155 NORTH AMERICA: MARKET, BY APPLICATION,  2022–2029 (USD MILLION)
           9.2.1 NORTH AMERICA: RECESSION IMPACT
           9.2.2 US
                    9.2.2.1 Increasing adoption of technologically advanced products in US to favor market growth
                                TABLE 156 US: RAPID MICROBIOLOGY TESTING MARKET, BY PRODUCT, 2022–2029 (USD MILLION)
                                TABLE 157 US: RAPID MICROBIOLOGY TESTING INSTRUMENTS MARKET, BY TYPE,  2022–2029 (USD MILLION)
                                TABLE 158 US: RAPID MICROBIOLOGY TESTING REAGENTS & KITS MARKET, BY TYPE,  2022–2029 (USD MILLION)
                                TABLE 159 US: MARKET, BY METHOD, 2022–2029 (USD MILLION)
                                TABLE 160 US: MARKET, BY APPLICATION,  2022–2029 (USD MILLION)
           9.2.3 CANADA
                    9.2.3.1 Favorable environment for R&D and rising incidence of infectious diseases to drive market
                                TABLE 161 CANADA: RAPID MICROBIOLOGY TESTING MARKET, BY PRODUCT,  2022–2029 (USD MILLION)
                                TABLE 162 CANADA: RAPID MICROBIOLOGY TESTING INSTRUMENTS MARKET, BY TYPE,  2022–2029 (USD MILLION)
                                TABLE 163 CANADA: RAPID MICROBIOLOGY TESTING REAGENTS & KITS MARKET, BY TYPE,  2022–2029 (USD MILLION)
                                TABLE 164 CANADA: MARKET, BY METHOD,  2022–2029 (USD MILLION)
                                TABLE 165 CANADA: MARKET, BY APPLICATION,  2022–2029 (USD MILLION)
    9.3 EUROPE 
          TABLE 166 EUROPE: RAPID MICROBIOLOGY TESTING MARKET, BY COUNTRY,  2022–2029 (USD MILLION)
          TABLE 167 EUROPE: MARKET, BY PRODUCT,  2022–2029 (USD MILLION)
          TABLE 168 EUROPE: RAPID MICROBIOLOGY TESTING INSTRUMENTS MARKET, BY TYPE,  2022–2029 (USD MILLION)
          TABLE 169 EUROPE: RAPID MICROBIOLOGY TESTING REAGENTS & KITS MARKET, BY TYPE,  2022–2029 (USD MILLION)
          TABLE 170 EUROPE: MARKET, BY METHOD,  2022–2029 (USD MILLION)
          TABLE 171 EUROPE: MARKET, BY APPLICATION,  2022–2029 (USD MILLION)
           9.3.1 EUROPE: RECESSION IMPACT
           9.3.2 GERMANY
                    9.3.2.1 Rising emphasis on food testing and safety to fuel market growth
                                TABLE 172 GERMANY: RAPID MICROBIOLOGY TESTING MARKET, BY PRODUCT,  2022–2029 (USD MILLION)
                                TABLE 173 GERMANY: RAPID MICROBIOLOGY TESTING INSTRUMENTS MARKET, BY TYPE,  2022–2029 (USD MILLION)
                                TABLE 174 GERMANY: RAPID MICROBIOLOGY TESTING REAGENTS & KITS MARKET, BY TYPE,  2022–2029 (USD MILLION)
                                TABLE 175 GERMANY: MARKET, BY METHOD,  2022–2029 (USD MILLION)
                                TABLE 176 GERMANY: MARKET, BY APPLICATION,  2022–2029 (USD MILLION)
           9.3.3 UK
                    9.3.3.1 Increasing investments and funding by government to drive market growth
                                TABLE 177 UK: RAPID MICROBIOLOGY TESTING MARKET, BY PRODUCT, 2022–2029 (USD MILLION)
                                TABLE 178 UK: RAPID MICROBIOLOGY TESTING INSTRUMENTS MARKET, BY TYPE,  2022–2029 (USD MILLION)
                                TABLE 179 UK: RAPID MICROBIOLOGY TESTING REAGENTS & KITS MARKET, BY TYPE,  2022–2029 (USD MILLION)
                                TABLE 180 UK: MARKET, BY METHOD, 2022–2029 (USD MILLION)
                                TABLE 181 UK: MARKET, BY APPLICATION,  2022–2029 (USD MILLION)
           9.3.4 FRANCE
                    9.3.4.1 Rising R&D expenditure to favor market growth
                                TABLE 182 FRANCE: RAPID MICROBIOLOGY TESTING MARKET, BY PRODUCT,  2022–2029 (USD MILLION)
                                TABLE 183 FRANCE: RAPID MICROBIOLOGY TESTING INSTRUMENTS MARKET, BY TYPE,  2022–2029 (USD MILLION)
                                TABLE 184 FRANCE: RAPID MICROBIOLOGY TESTING REAGENTS & KITS MARKET, BY TYPE,  2022–2029 (USD MILLION)
                                TABLE 185 FRANCE: MARKET, BY METHOD,  2022–2029 (USD MILLION)
                                TABLE 186 FRANCE: MARKET, BY APPLICATION,  2022–2029 (USD MILLION)
           9.3.5 ITALY
                    9.3.5.1 Increased adoption of advanced diagnostic technologies and growing government healthcare investments to drive market
                                TABLE 187 ITALY: RAPID MICROBIOLOGY TESTING MARKET, BY PRODUCT,  2022–2029 (USD MILLION)
                                TABLE 188 ITALY: RAPID MICROBIOLOGY TESTING INSTRUMENTS MARKET, BY TYPE,  2022–2029 (USD MILLION)
                                TABLE 189 ITALY: RAPID MICROBIOLOGY TESTING REAGENTS & KITS MARKET, BY TYPE,  2022–2029 (USD MILLION)
                                TABLE 190 ITALY: MARKET, BY METHOD, 2022–2029 (USD MILLION)
                                TABLE 191 ITALY: MARKET, BY APPLICATION,  2022–2029 (USD MILLION)
           9.3.6 SPAIN
                    9.3.6.1 Rising geriatric population and improving healthcare infrastructure to boost market growth
                                TABLE 192 SPAIN: RAPID MICROBIOLOGY TESTING MARKET, BY PRODUCT,  2022–2029 (USD MILLION)
                                TABLE 193 SPAIN: RAPID MICROBIOLOGY TESTING INSTRUMENTS MARKET, BY TYPE,  2022–2029 (USD MILLION)
                                TABLE 194 SPAIN: RAPID MICROBIOLOGY TESTING REAGENTS & KITS MARKET, BY TYPE,  2022–2029 (USD MILLION)
                                TABLE 195 SPAIN: MARKET, BY METHOD,  2022–2029 (USD MILLION)
                                TABLE 196 SPAIN: MARKET, BY APPLICATION,  2022–2029 (USD MILLION)
           9.3.7 RUSSIA
                    9.3.7.1 Increasing access to quality healthcare to propel market growth
                                TABLE 197 RUSSIA: RAPID MICROBIOLOGY TESTING MARKET, BY PRODUCT,  2022–2029 (USD MILLION)
                                TABLE 198 RUSSIA: RAPID MICROBIOLOGY TESTING INSTRUMENTS MARKET, BY TYPE,  2022–2029 (USD MILLION)
                                TABLE 199 RUSSIA: RAPID MICROBIOLOGY TESTING REAGENTS & KITS MARKET, BY TYPE,  2022–2029 (USD MILLION)
                                TABLE 200 RUSSIA: MARKET, BY METHOD,  2022–2029 (USD MILLION)
                                TABLE 201 RUSSIA: MARKET, BY APPLICATION,  2022–2029 (USD MILLION)
           9.3.8 REST OF EUROPE
                    TABLE 202 REST OF EUROPE: RAPID MICROBIOLOGY TESTING MARKET, BY PRODUCT,  2022–2029 (USD MILLION)
                    TABLE 203 REST OF EUROPE: RAPID MICROBIOLOGY TESTING INSTRUMENTS MARKET,  BY TYPE, 2022–2029 (USD MILLION)
                    TABLE 204 REST OF EUROPE: RAPID MICROBIOLOGY TESTING REAGENTS & KITS MARKET, BY TYPE, 2022–2029 (USD MILLION)
                    TABLE 205 REST OF EUROPE: MARKET, BY METHOD,  2022–2029 (USD MILLION)
                    TABLE 206 REST OF EUROPE: MARKET, BY APPLICATION,  2022–2029 (USD MILLION)
    9.4 ASIA PACIFIC 
          FIGURE 26 ASIA PACIFIC: RAPID MICROBIOLOGY TESTING MARKET SNAPSHOT
          TABLE 207 ASIA PACIFIC: MARKET, BY COUNTRY,  2022–2029 (USD MILLION)
          TABLE 208 ASIA PACIFIC: MARKET, BY PRODUCT,  2022–2029 (USD MILLION)
          TABLE 209 ASIA PACIFIC: RAPID MICROBIOLOGY TESTING INSTRUMENTS MARKET, BY TYPE,  2022–2029 (USD MILLION)
          TABLE 210 ASIA PACIFIC: RAPID MICROBIOLOGY TESTING REAGENTS & KITS MARKET, BY TYPE, 2022–2029 (USD MILLION)
          TABLE 211 ASIA PACIFIC: MARKET, BY METHOD,  2022–2029 (USD MILLION)
          TABLE 212 ASIA PACIFIC: MARKET, BY APPLICATION,  2022–2029 (USD MILLION)
           9.4.1 ASIA PACIFIC: RECESSION IMPACT
           9.4.2 CHINA
                    9.4.2.1 Rising importance of quality control across food and pharmaceutical industries to drive market growth
                                TABLE 213 CHINA: RAPID MICROBIOLOGY TESTING MARKET, BY PRODUCT,  2022–2029 (USD MILLION)
                                TABLE 214 CHINA: RAPID MICROBIOLOGY TESTING INSTRUMENTS MARKET, BY TYPE,  2022–2029 (USD MILLION)
                                TABLE 215 CHINA: RAPID MICROBIOLOGY TESTING REAGENTS & KITS MARKET, BY TYPE,  2022–2029 (USD MILLION)
                                TABLE 216 CHINA: MARKET, BY METHOD,  2022–2029 (USD MILLION)
                                TABLE 217 CHINA: MARKET, BY APPLICATION,  2022–2029 (USD MILLION)
           9.4.3 JAPAN
                    9.4.3.1 Rising geriatric population in Japan to support market growth
                                TABLE 218 JAPAN: RAPID MICROBIOLOGY TESTING MARKET, BY PRODUCT,  2022–2029 (USD MILLION)
                                TABLE 219 JAPAN: RAPID MICROBIOLOGY TESTING INSTRUMENTS MARKET, BY TYPE,  2022–2029 (USD MILLION)
                                TABLE 220 JAPAN: RAPID MICROBIOLOGY TESTING REAGENTS & KITS MARKET, BY TYPE,  2022–2029 (USD MILLION)
                                TABLE 221 JAPAN: MARKET, BY METHOD,  2022–2029 (USD MILLION)
                                TABLE 222 JAPAN: MARKET, BY APPLICATION,  2022–2029 (USD MILLION)
           9.4.4 INDIA
                    9.4.4.1 Increasing private and public investments in healthcare systems to drive adoption of rapid microbiology testing products
                                TABLE 223 INDIA: RAPID MICROBIOLOGY TESTING MARKET, BY PRODUCT,  2022–2029 (USD MILLION)
                                TABLE 224 INDIA: RAPID MICROBIOLOGY TESTING INSTRUMENTS MARKET, BY TYPE,  2022–2029 (USD MILLION)
                                TABLE 225 INDIA: RAPID MICROBIOLOGY TESTING REAGENTS & KITS MARKET, BY TYPE,  2022–2029 (USD MILLION)
                                TABLE 226 INDIA: MARKET, BY METHOD,  2022–2029 (USD MILLION)
                                TABLE 227 INDIA: MARKET, BY APPLICATION,  2022–2029 (USD MILLION)
           9.4.5 AUSTRALIA
                    9.4.5.1 Increasing awareness about antimicrobial resistance to fuel market
                                TABLE 228 AUSTRALIA: RAPID MICROBIOLOGY TESTING MARKET, BY PRODUCT,  2022–2029 (USD MILLION)
                                TABLE 229 AUSTRALIA: RAPID MICROBIOLOGY TESTING INSTRUMENTS MARKET,  BY TYPE, 2022–2029 (USD MILLION)
                                TABLE 230 AUSTRALIA: RAPID MICROBIOLOGY TESTING REAGENTS & KITS MARKET, BY TYPE,  2022–2029 (USD MILLION)
                                TABLE 231 AUSTRALIA: MARKET, BY METHOD,  2022–2029 (USD MILLION)
                                TABLE 232 AUSTRALIA: MARKET, BY APPLICATION,  2022–2029 (USD MILLION)
           9.4.6 REST OF ASIA PACIFIC
                    TABLE 233 REST OF ASIA PACIFIC: RAPID MICROBIOLOGY TESTING MARKET, BY PRODUCT,  2022–2029 (USD MILLION)
                    TABLE 234 REST OF ASIA PACIFIC: RAPID MICROBIOLOGY TESTING INSTRUMENTS MARKET, BY TYPE, 2022–2029 (USD MILLION)
                    TABLE 235 REST OF ASIA PACIFIC: RAPID MICROBIOLOGY TESTING REAGENTS & KITS MARKET,  BY TYPE, 2022–2029 (USD MILLION)
                    TABLE 236 REST OF ASIA PACIFIC: MARKET, BY METHOD,  2022–2029 (USD MILLION)
                    TABLE 237 REST OF ASIA PACIFIC: MARKET, BY APPLICATION, 2022–2029 (USD MILLION)
    9.5 LATIN AMERICA 
          TABLE 238 LATIN AMERICA: RAPID MICROBIOLOGY TESTING MARKET, BY COUNTRY,  2022–2029 (USD MILLION)
          TABLE 239 LATIN AMERICA: MARKET, BY PRODUCT,  2022–2029 (USD MILLION)
          TABLE 240 LATIN AMERICA: RAPID MICROBIOLOGY TESTING INSTRUMENTS MARKET, BY TYPE, 2022–2029 (USD MILLION)
          TABLE 241 LATIN AMERICA: RAPID MICROBIOLOGY TESTING REAGENTS & KITS MARKET,  BY TYPE, 2022–2029 (USD MILLION)
          TABLE 242 LATIN AMERICA: MARKET, BY METHOD,  2022–2029 (USD MILLION)
          TABLE 243 LATIN AMERICA: MARKET, BY APPLICATION,  2022–2029 (USD MILLION)
           9.5.1 LATIN AMERICA: RECESSION IMPACT
           9.5.2 BRAZIL
                    9.5.2.1 Improving healthcare infrastructure and stringent regulations to fuel market
                                TABLE 244 BRAZIL: RAPID MICROBIOLOGY TESTING MARKET, BY PRODUCT,  2022–2029 (USD MILLION)
                                TABLE 245 BRAZIL: RAPID MICROBIOLOGY TESTING INSTRUMENTS MARKET, BY TYPE,  2022–2029 (USD MILLION)
                                TABLE 246 BRAZIL: RAPID MICROBIOLOGY TESTING REAGENTS & KITS MARKET, BY TYPE,  2022–2029 (USD MILLION)
                                TABLE 247 BRAZIL: MARKET, BY METHOD,  2022–2029 (USD MILLION)
                                TABLE 248 BRAZIL: MARKET, BY APPLICATION,  2022–2029 (USD MILLION)
           9.5.3 MEXICO
                    9.5.3.1 Improving accessibility and affordability of healthcare services to support market growth
                                TABLE 249 MEXICO: RAPID MICROBIOLOGY TESTING MARKET, BY PRODUCT,  2022–2029 (USD MILLION)
                                TABLE 250 MEXICO: RAPID MICROBIOLOGY TESTING INSTRUMENTS MARKET, BY TYPE,  2022–2029 (USD MILLION)
                                TABLE 251 MEXICO: RAPID MICROBIOLOGY TESTING REAGENTS & KITS MARKET, BY TYPE,  2022–2029 (USD MILLION)
                                TABLE 252 MEXICO: MARKET, BY METHOD,  2022–2029 (USD MILLION)
                                TABLE 253 MEXICO: MARKET, BY APPLICATION,  2022–2029 (USD MILLION)
           9.5.4 REST OF LATIN AMERICA
                    TABLE 254 REST OF LATIN AMERICA: RAPID MICROBIOLOGY TESTING MARKET, BY PRODUCT,  2022–2029 (USD MILLION)
                    TABLE 255 REST OF LATIN AMERICA: RAPID MICROBIOLOGY TESTING INSTRUMENTS MARKET,  BY TYPE, 2022–2029 (USD MILLION)
                    TABLE 256 REST OF LATIN AMERICA: RAPID MICROBIOLOGY TESTING REAGENTS & KITS MARKET,  BY TYPE, 2022–2029 (USD MILLION)
                    TABLE 257 REST OF LATIN AMERICA: MARKET, BY METHOD,  2022–2029 (USD MILLION)
                    TABLE 258 REST OF LATIN AMERICA: MARKET, BY APPLICATION, 2022–2029 (USD MILLION)
    9.6 MIDDLE EAST & AFRICA 
           9.6.1 ADVANCEMENTS IN DIAGNOSTIC TECHNOLOGIES AND INCREASED HEALTHCARE INVESTMENTS TO PROPEL MARKET
                    TABLE 259 MIDDLE EAST & AFRICA: RAPID MICROBIOLOGY TESTING MARKET, BY PRODUCT,  2022–2029 (USD MILLION)
                    TABLE 260 MIDDLE EAST & AFRICA: RAPID MICROBIOLOGY TESTING INSTRUMENTS MARKET,  BY TYPE, 2022–2029 (USD MILLION)
                    TABLE 261 MIDDLE EAST & AFRICA: RAPID MICROBIOLOGY TESTING REAGENTS & KITS MARKET,  BY TYPE, 2022–2029 (USD MILLION)
                    TABLE 262 MIDDLE EAST & AFRICA: MARKET, BY METHOD,  2022–2029 (USD MILLION)
                    TABLE 263 MIDDLE EAST & AFRICA: MARKET, BY APPLICATION, 2022–2029 (USD MILLION)
           9.6.2 MIDDLE EAST & AFRICA: RECESSION IMPACT
    9.7 GCC COUNTRIES 
           9.7.1 RISING FOCUS ON ADVANCED HEALTH INFRASTRUCTURE TO DRIVE MARKET
                    TABLE 264 GCC COUNTRIES: RAPID MICROBIOLOGY TESTING MARKET, BY PRODUCT,  2022–2029 (USD MILLION)
                    TABLE 265 GCC COUNTRIES: RAPID MICROBIOLOGY TESTING INSTRUMENTS MARKET,  BY TYPE, 2022–2029 (USD MILLION)
                    TABLE 266 GCC COUNTRIES: RAPID MICROBIOLOGY TESTING REAGENTS & KITS MARKET, BY TYPE, 2022–2029 (USD MILLION)
                    TABLE 267 GCC COUNTRIES: MARKET, BY METHOD,  2022–2029 (USD MILLION)
                    TABLE 268 GCC COUNTRIES: MARKET, BY APPLICATION,  2022–2029 (USD MILLION)
           9.7.2 GCC COUNTRIES: RECESSION IMPACT
 
10 COMPETITIVE LANDSCAPE (Page No. - 253)
     10.1 INTRODUCTION 
     10.2 RIGHT-TO-WIN APPROACHES ADOPTED BY KEY PLAYERS 
             10.2.1 OVERVIEW OF STRATEGIES DEPLOYED BY PLAYERS IN RAPID MICROBIOLOGY TESTING MARKET
                        TABLE 269 RAPID MICROBIOLOGY TESTING INDUSTRY: STRATEGIES ADOPTED
     10.3 REVENUE SHARE ANALYSIS 
             FIGURE 27 REVENUE ANALYSIS OF KEY PLAYERS (2018–2022)
     10.4 MARKET SHARE ANALYSIS 
             10.4.1 MARKET
                        FIGURE 28 MARKET SHARE ANALYSIS OF KEY PLAYERS (2022)
                        TABLE 270 RAPID MICROBIOLOGY TESTING INDUSTRY: DEGREE OF COMPETITION
     10.5 COMPANY EVALUATION MATRIX: KEY PLAYERS 
             10.5.1 LIST OF EVALUATED VENDORS
             10.5.2 STARS
             10.5.3 EMERGING LEADERS
             10.5.4 PERVASIVE PLAYERS
             10.5.5 PARTICIPANTS
                        FIGURE 29 MARKET: COMPANY EVALUATION MATRIX  (KEY PLAYERS), 2022
             10.5.6 COMPANY FOOTPRINT
                        FIGURE 30 RAPID MICROBIOLOGY TESTING INDUSTRY: COMPANY FOOTPRINT
                        TABLE 271 RAPID MICROBIOLOGY TESTING INDUSTRY: PRODUCT FOOTPRINT
                        TABLE 272 RAPID MICROBIOLOGY TESTING INDUSTRY: REGIONAL FOOTPRINT
                        TABLE 273 RAPID MICROBIOLOGY TESTING INDUSTRY: APPLICATION FOOTPRINT
     10.6 COMPANY EVALUATION MATRIX: STARTUPS/SMES 
             10.6.1 PROGRESSIVE COMPANIES
             10.6.2 RESPONSIVE COMPANIES
             10.6.3 DYNAMIC COMPANIES
             10.6.4 STARTING BLOCKS
                        FIGURE 31 RAPID MICROBIOLOGY TESTING INDUSTRY: COMPANY EVALUATION MATRIX (STARTUPS/SMES), 2022
             10.6.5 COMPETITIVE BENCHMARKING OF STARTUP/SME PLAYERS
                        TABLE 274 MARKET: DETAILED LIST OF KEY STARTUPS/SME PLAYERS
     10.7 VALUATION AND FINANCIAL METRICS OF RAPID MICROBIOLOGY TESTING VENDORS 
             FIGURE 32 EV/EBITDA OF KEY VENDORS
             FIGURE 33 P/E RATIO OF KEY VENDORS
     10.8 BRAND/PRODUCT COMPARATIVE ANALYSIS 
             FIGURE 34 PRODUCT/BRAND COMPARISON: CELLULAR COMPONENT-BASED RAPID MICROBIOLOGY TESTING PRODUCTS
     10.9 COMPETITIVE SCENARIO 
             10.9.1 PRODUCT LAUNCHES
                        TABLE 275 RAPID MICROBIOLOGY TESTING INDUSTRY: PRODUCT LAUNCHES, JANUARY 2020–JANUARY 2024
             10.9.2 DEALS
                        TABLE 276 MARKET: DEALS, JANUARY 2020–JANUARY 2024
             10.9.3 EXPANSIONS
                        TABLE 277 RAPID MICROBIOLOGY TESTING INDUSTRY: EXPANSIONS, JANUARY 2020–JANUARY 2024
 
11 COMPANY PROFILES (Page No. - 268)
(Business overview, Products offered, Recent Developments, MNM view)*
     11.1 KEY PLAYERS 
             11.1.1 BIOMÉRIEUX SA
                        TABLE 278 BIOMÉRIEUX SA: COMPANY OVERVIEW
                        FIGURE 35 BIOMÉRIEUX SA: COMPANY SNAPSHOT (2022)
                        TABLE 279 BIOMÉRIEUX SA: PRODUCTS OFFERED
                        TABLE 280 BIOMÉRIEUX SA: PRODUCT LAUNCHES & APPROVALS
                        TABLE 281 BIOMÉRIEUX SA: DEALS
                        TABLE 282 BIOMÉRIEUX SA: OTHER DEVELOPMENTS
             11.1.2 BECTON, DICKINSON AND COMPANY
                        TABLE 283 BECTON, DICKINSON AND COMPANY: COMPANY OVERVIEW
                        FIGURE 36 BECTON, DICKINSON AND COMPANY: COMPANY SNAPSHOT (2023)
                        TABLE 284 BECTON, DICKINSON AND COMPANY: PRODUCTS OFFERED
                        TABLE 285 BECTON, DICKINSON AND COMPANY: PRODUCT LAUNCHES & APPROVALS
                        TABLE 286 BECTON, DICKINSON AND COMPANY: DEALS
             11.1.3 DANAHER CORPORATION
                        TABLE 287 DANAHER CORPORATION: COMPANY OVERVIEW
                        FIGURE 37 DANAHER CORPORATION: COMPANY SNAPSHOT (2022)
                        TABLE 288 DANAHER CORPORATION: PRODUCTS OFFERED
                        TABLE 289 DANAHER CORPORATION: PRODUCT LAUNCHES & APPROVALS
                        TABLE 290 DANAHER CORPORATION: DEALS
                        TABLE 291 DANAHER CORPORATION: EXPANSIONS
             11.1.4 ABBOTT LABORATORIES
                        TABLE 292 ABBOTT LABORATORIES: COMPANY OVERVIEW
                        FIGURE 38 ABBOTT LABORATORIES: COMPANY SNAPSHOT (2023)
                        TABLE 293 ABBOTT LABORATORIES: PRODUCTS OFFERED
                        TABLE 294 ABBOTT LABORATORIES: PRODUCT LAUNCHES & APPROVALS
             11.1.5 THERMO FISHER SCIENTIFIC INC.
                        TABLE 295 THERMO FISHER SCIENTIFIC INC.: COMPANY OVERVIEW
                        FIGURE 39 THERMO FISHER SCIENTIFIC INC.: COMPANY SNAPSHOT (2022)
                        TABLE 296 THERMO FISHER SCIENTIFIC INC.: PRODUCTS OFFERED
                        TABLE 297 THERMO FISHER SCIENTIFIC INC.: PRODUCT LAUNCHES
                        TABLE 298 THERMO FISHER SCIENTIFIC INC.: DEALS
             11.1.6 MERCK KGAA
                        TABLE 299 MERCK KGAA: COMPANY OVERVIEW
                        FIGURE 40 MERCK KGAA: COMPANY SNAPSHOT (2022)
                        TABLE 300 MERCK KGAA: PRODUCTS OFFERED
                        TABLE 301 MERCK KGAA: DEALS
             11.1.7 BRUKER
                        TABLE 302 BRUKER: COMPANY OVERVIEW
                        FIGURE 41 BRUKER: COMPANY SNAPSHOT (2022)
                        TABLE 303 BRUKER: PRODUCTS OFFERED
                        TABLE 304 BRUKER: PRODUCT LAUNCHES
             11.1.8 QUIDELORTHO CORPORATION
                        TABLE 305 QUIDELORTHO CORPORATION: COMPANY OVERVIEW
                        FIGURE 42 QUIDELORTHO CORPORATION: COMPANY SNAPSHOT (2022)
                        TABLE 306 QUIDELORTHO CORPORATION: PRODUCTS OFFERED
                        TABLE 307 QUIDELORTHO CORPORATION: PRODUCT LAUNCHES & APPROVALS
                        TABLE 308 QUIDELORTHO CORPORATION: DEALS
                        TABLE 309 QUIDELORTHO CORPORATION: OTHER DEVELOPMENTS
             11.1.9 SARTORIUS AG
                        TABLE 310 SARTORIUS AG: COMPANY OVERVIEW
                        FIGURE 43 SARTORIUS AG: COMPANY SNAPSHOT (2023)
                        TABLE 311 SARTORIUS AG: PRODUCTS OFFERED
             11.1.10 CHARLES RIVER LABORATORIES
                        TABLE 312 CHARLES RIVER LABORATORIES: COMPANY OVERVIEW
                        FIGURE 44 CHARLES RIVER LABORATORIES: COMPANY SNAPSHOT (2022)
                        TABLE 313 CHARLES RIVER LABORATORIES: PRODUCTS OFFERED
                        TABLE 314 CHARLES RIVER LABORATORIES: PRODUCT LAUNCHES
                        TABLE 315 CHARLES RIVER LABORATORIES: DEALS
             11.1.11 NEOGEN CORPORATION
                        TABLE 316 NEOGEN CORPORATION: COMPANY OVERVIEW
                        FIGURE 45 NEOGEN CORPORATION: COMPANY SNAPSHOT (2022)
                        TABLE 317 NEOGEN CORPORATION: PRODUCTS OFFERED
                        TABLE 318 NEOGEN CORPORATION: PRODUCT LAUNCHES
*Details on Business overview, Products/Services/Solutions offered, Recent Developments, MNM view might not be captured in case of unlisted companies.
     11.2 OTHER PLAYERS 
             11.2.1 DON WHITLEY SCIENTIFIC LIMITED
             11.2.2 RAPID MICRO BIOSYSTEMS, INC.
             11.2.3 GRADIENTECH
             11.2.4 PERKINELMER INC.
             11.2.5 RQMICRO AG
             11.2.6 COLIFAST AS
             11.2.7 SEROSEP LIMITED
             11.2.8 BTNX INC.
             11.2.9 R-BIOPHARM AG
             11.2.10 PARAGON GENOMICS, INC.
             11.2.11 KYPHA INC.
             11.2.12 VIVIONE BIOSCIENCES
             11.2.13 BACTEST LTD.
             11.2.14 CORDX
 
12 APPENDIX (Page No. - 324)
     12.1 DISCUSSION GUIDE 
     12.2 KNOWLEDGESTORE: MARKETSANDMARKETS’  SUBSCRIPTION PORTAL 
     12.3 CUSTOMIZATION OPTIONS 
     12.4 RELATED REPORTS 
     12.5 AUTHOR DETAILS 

The objective of the study is to analyze the key market dynamics, such as drivers, opportunities, restraints, challenges, and key player strategies. To track company developments such as acquisitions, product launches, expansions, agreements, and partnerships of the leading players, the competitive landscape of the rapid microbiology testing market to analyze market players on various parameters within the broad categories of business and product strategy. Top-down and bottom-up approaches were used to estimate the market size. To estimate the market size of segments and subsegments, the market breakdown and data triangulation were used.

The four steps involved in estimating the market size are

Secondary Research

In the secondary research process, various secondary sources such as annual reports, press releases & investor presentations of companies, white papers, certified publications, articles by recognized authors, gold-standard & silver-standard websites, regulatory bodies, and databases (such as D&B Hoovers, Bloomberg Business, and Factiva) were referred to identify and collect information for this study.

Primary Research

In the primary research process, various sources from both the supply and demand sides were interviewed to obtain qualitative and quantitative information for this report. Primary sources were mainly industry experts from the core and related industries and preferred suppliers, manufacturers, distributors, service providers, technology developers, researchers, and organizations related to all segments of this industry’s value chain. In-depth interviews were conducted with various primary respondents, including key industry participants, subject-matter experts, C-level executives of key market players, and industry consultants, to obtain and verify critical qualitative and quantitative information as well as assess prospects.

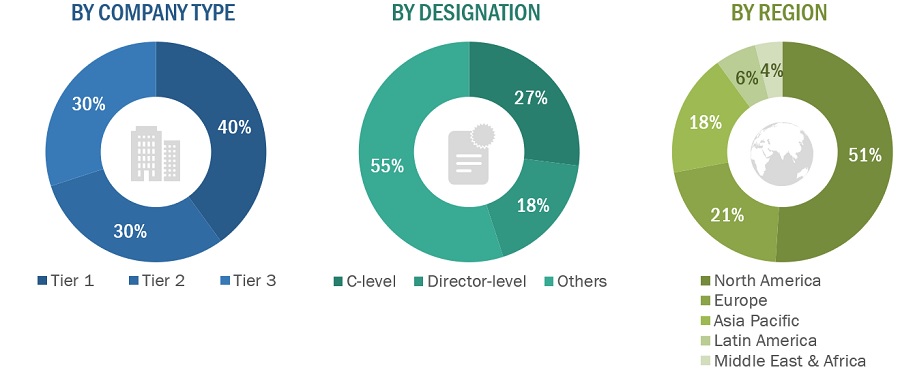
The following is a breakdown of the primary respondents:

Breakdown of Primary Participants:
Rapid  Microbiology Testing Market Size, and Share

Note 1: Others include sales managers, marketing managers, and product managers.

Note 2: Companies are classified into tiers based on their total revenues. As of 2022/2023, Tier 1 = >USD 100 million, Tier 2 = USD 10 million to USD 100 million, and Tier 3 = <USD 10 million.

To know about the assumptions considered for the study, download the pdf brochure

COMPANY NAME

DESIGNATION

Abbott

Senior Manager

Becton, Dickinson and Company

Sales Executive

Market Size Estimation

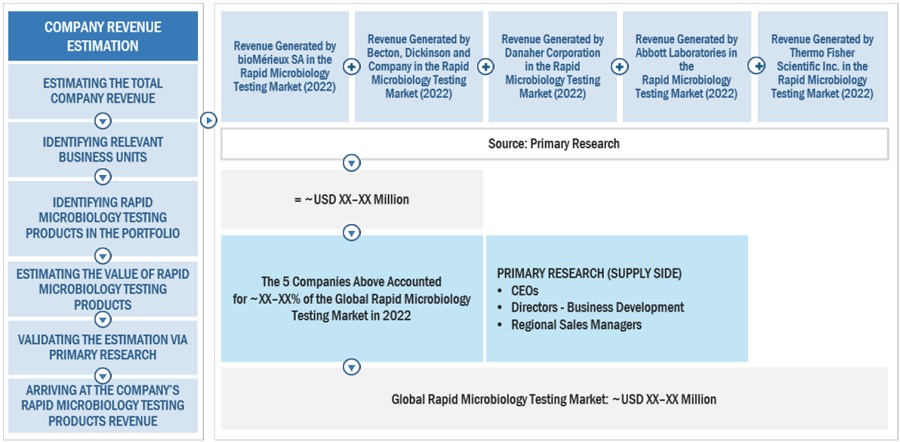
Both top-down and bottom-up approaches were used to estimate and validate the rapid microbiology testing market's total size. These methods were also used extensively to estimate the size of various subsegments in the market. The research methodology used to estimate the market size includes the following:

  • The key players in the industry have been identified through extensive secondary research
  • The revenues generated by leading players operating in the rapid microbiology testing market have been determined through primary and secondary research.
  • All percentage shares, splits, and breakdowns have been determined using secondary sources and verified through primary sources.

Global Rapid microbiology testing Market Size: Bottom Up Approach
Rapid  Microbiology Testing Market Size, and Share

To know about the assumptions considered for the study, Request for Free Sample Report

Global Rapid Microbiology Testing Market Size: Top-Down Approach

Rapid  Microbiology Testing Market Size, and Share

Data Triangulation

After arriving at the overall market size by applying the process mentioned above, the total market was split into several segments and subsegments. To complete the overall market engineering process and arrive at the exact statistics for all segments and subsegments, data triangulation and market breakdown procedures were employed, wherever applicable. The data was triangulated by studying various factors and trends from both the demand and supply sides.

Market Definition

Rapid microbiology testing products are used to rapidly detect, screen, enumerate, and identify microbes and microbial contaminants causing or spreading diseases. These testing procedures include microbial methods that give sensitive and accurate results faster than conventional microbial testing methods.

Key Stakeholders

  • Senior Management
  • End User
  • Finance/Procurement Department
  • R&D Department

Report Objectives

  • To define, describe, segment, and forecast the rapid microbiology testing market by product, method, application, and region
  • To provide detailed information regarding the major factors influencing the market growth (drivers, restraints, opportunities, and challenges)
  • To analyze micromarkets with respect to individual growth trends, prospects, and contributions to the overall market
  • To analyze market opportunities for stakeholders and provide details of the competitive landscape for key players
  • To forecast the size of the market segments with respect to six regions: North America, Europe, the Asia Pacific, Middle East & Africa, Latin America, and GCC countries
  • To profile the key players and comprehensively analyze their product portfolios, market positions, and core competencies
  • To track and analyze company developments such as acquisitions, collaborations, partnerships, agreements, and product launches & approvals in the rapid microbiology testing market
  • To benchmark players within the market using the Company Evaluation Matrix framework, which analyzes market players on various parameters within the broad categories of business strategy, market share, and product offerings

Available Customizations

MarketsandMarkets offers the following customizations for this market report.

Country Information

  • Additional country-level analysis of the rapid microbiology testing market

Company profiles

  • Additional five company profiles of players operating in the rapid microbiology testing market.

Product Analysis

  • Product matrix, which provides a detailed comparison of the product portfolio of each company in the rapid microbiology testing market
Custom Market Research Services

We will customize the research for you, in case the report listed above does not meet with your exact requirements. Our custom research will comprehensively cover the business information you require to help you arrive at strategic and profitable business decisions.

Request Customization

Instant Answers with GPT - Ask Now!

Ask real questions. Get complete answers !
Report Code
MD 6602
Published ON
Apr, 2024
Choose License Type
BUY NOW
  • SHARE
X
Request Customization
Speak to Analyst
Speak to Analyst
OR FACE-TO-FACE MEETING
PERSONALIZE THIS RESEARCH
  • Triangulate with your Own Data
  • Get Data as per your Format and Definition
  • Gain a Deeper Dive on a Specific Application, Geography, Customer or Competitor
  • Any level of Personalization
REQUEST A FREE CUSTOMIZATION
LET US HELP YOU!
  • What are the Known and Unknown Adjacencies Impacting the Rapid Microbiology Testing Market
  • What will your New Revenue Sources be?
  • Who will be your Top Customer; what will make them switch?
  • Defend your Market Share or Win Competitors
  • Get a Scorecard for Target Partners
CUSTOMIZED WORKSHOP REQUEST
+1-888-600-6441
  • Call Us
  • +1-888-600-6441 (Corporate office hours)
  • +1-888-600-6441 (US/Can toll free)
  • +44-800-368-9399 (UK office hours)
CONNECT WITH US
ABOUT TRUST ONLINE
©2024 MarketsandMarkets Research Private Ltd. All rights reserved
DMCA.com Protection Status Website Feedback