Rice Husk Ash Market

Rice Husk Ash Market by Application (Building & Construction, Steel Industry, Silica, Ceramics & Refractory, Rubber), Silica Content (80-84%, 85-89%, 90-94%, and greater than 95%), Process, Product, and Region - Global Forecast to 2028

Report Code: CH 4145 Mar, 2024, by marketsandmarkets.com

The global Rice Husk Ash Market is projected to grow from USD 2.6 billion in 2023 to USD 3.2 billion by 2028, at a CAGR of 4.5 % during the forecast period. Use of Rice husk ash in building and construction is driving the growth in rice husk ash market. The use of rice husk ash is crucial due to its versatile applications in industries such as construction, agriculture, and manufacturing. It serves as a valuable resource for enhancing concrete strength, soil fertility, and as a raw material for various products, contributing to sustainable practices and resource optimization.

Attractive Opportunities in the Rice Husk Ash Market

Rice Husk Ash Market

To know about the assumptions considered for the study, Request for Free Sample Report

Rice Husk Ash Market

Market Dynamics:

Driver: Low Manufacturing and raw material cost

The rice husk ash market is driven by low manufacturing costs and minimal material expenses. Utilizing rice husk ash as a raw material significantly reduces manufacturing expenses, as it is a byproduct of rice milling, readily available, and often considered waste. Furthermore, its abundant availability makes sourcing inexpensive, contributing to cost-effectiveness. Low production costs coupled with the versatility of rice husk ash in various applications such as construction, ceramics, and agriculture, amplify its market demand. This affordability attracts industries seeking economical alternatives, fostering growth in the rice husk ash market.

Restraints: Manufacturing is highly dependent on the production of rice paddy

The manufacturing of rice husk ash is intricately tied to the production of rice paddy, posing a significant restraint on the rice husk ash market. As rice husk ash is a byproduct of rice milling, any fluctuations or disruptions in rice paddy production directly impact its availability and, consequently, the supply of rice husk ash. Factors such as adverse weather conditions, fluctuations in agricultural practices, and market instability can disrupt rice paddy production, leading to supply shortages and volatility in the rice husk ash market. This dependency on rice paddy production underscores the vulnerability of the rice husk ash market to fluctuations in the agricultural sector, posing challenges for consistent supply and market stability.

Opportunity: Increasing use of rice husk ash in the cement and construction industry

The increasing utilization of rice husk ash in building and construction presents a significant opportunity for the rice husk ash market. Its unique properties, such as high silica content and pozzolanic characteristics, make it an attractive sustainable alternative to traditional construction materials like cement. Incorporating rice husk ash in concrete formulations enhances strength, durability, and reduces environmental impact, offering builders and developers an eco-friendly solution. Additionally, its thermal insulating properties and fire resistance make it desirable for various construction applications, further expanding its market potential. As sustainable construction practices gain traction globally, the demand for rice husk ash in the building sector is expected to grow, creating lucrative opportunities for market players to capitalize on this trend.

Challenge: Limited awareness about rice husk ash

Limited awareness about rice husk ash poses a significant challenge for the market. Despite its numerous benefits and applications, many potential users, including builders, manufacturers, and agriculturalists, remain unaware of its potential. This lack of awareness hampers market penetration and adoption, hindering the realization of its full market potential. Educational initiatives and outreach programs are essential to inform stakeholders about the advantages of rice husk ash and its sustainable properties. Increasing awareness through targeted marketing efforts and collaborations with industry associations can help overcome this challenge and drive market growth.

Rice Husk Ash Market : Ecosystem

Prominent companies in this market include well-established, and financially stable manufacturers of rice husk ash market. These companies have been operating in the market for several years and possess a diversified product portfolio and strong global sales and marketing networks. Prominent companies in this market include Usher Agro limited (India), KRBL Ltd (India), Guru Meta Chem (India), Yihai Kerry Investment (China), Jasurya Rice Mill (India).

Rice Husk Ash Market Ecosystem

"Silica, by application, is estimated to account for the highest CAGR during the forecast period."

Silica is set to dominate the rice husk ash market's CAGR due to its broad applicability. Its use in construction, manufacturing, agriculture, water treatment, and electronics showcases its versatility and indispensability. As industries prioritize sustainability, silica's role in enhancing durability and eco-friendliness in construction materials like concrete boosts its demand. Additionally, its effectiveness in soil enrichment and water filtration further propels its adoption across agricultural and environmental sectors. Furthermore, in electronics manufacturing, particularly in semiconductor production, silica's importance drives market growth, ensuring its position as the highest CAGR value contributor in the rice husk ash market.

"Silica Content 90-94%, by silica content, is estimated to account for the highest CAGR during the forecast period."

Rice husk ash with a silica content ranging from 90% to 94% experiences the highest Compound Annual Growth Rate (CAGR) in the market during the forecast period. This high silica content makes it particularly desirable for various applications, including concrete production, where it enhances strength and durability. Industries such as construction, ceramics, and refractories increasingly seek materials with high silica content for their unique properties. Moreover, the growing emphasis on sustainable and eco-friendly alternatives in manufacturing processes further drives demand for rice husk ash with high silica content. As a result, suppliers focusing on this premium-grade rice husk ash witness significant growth opportunities and market expansion.

"Middle East & Africa is estimated to account for the highest CAGR during the forecast period."

The Middle East & Africa region experiences a highest CAGR value for rice husk ash during the forecast period due to several factors. Rapid industrialization and urbanization increase the demand for sustainable construction materials, with rice husk ash being a viable alternative. Additionally, growing awareness of environmental sustainability and green building practices promotes its adoption. The region's abundant rice husk supply from countries like Egypt and Saudi Arabia further boosts its availability. Government incentives for renewable energy and waste management also contribute to its growth.

Rice Husk Ash Market by Region

Source: Secondary Research, Expert Interviews, and MarketsandMarkets Analysis

To know about the assumptions considered for the study, download the pdf brochure

Key Market Players

Major companies in the Rice Husk Ash Market include Usher Agro limited (India), KRBL Ltd (India), Guru Meta Chem(India), Yihai Kerry Investment (China), Jasurya Rice Mill (India), Rescon India Pvt Ltd (India), Astra Chemicals (India) and others. A total of 16 major players have been covered. These players have adopted product launches, agreements, joint ventures, investments, acquisitions, mergers, and expansions as the major strategies to consolidate their position in the market.

Get online access to the report on the World's First Market Intelligence Cloud

  • Easy to Download Historical Data & Forecast Numbers
  • Company Analysis Dashboard for high growth potential opportunities
  • Research Analyst Access for customization & queries
  • Competitor Analysis with Interactive dashboard
  • Latest News, Updates & Trend analysis
Request Sample

Scope of the Report

Report Metric

Details

Market Size Available for Years

2018–2028

Base Year Considered

2022

Forecast Period

2023–2028

Forecast Units

Value (USD Billion/Million) and Volume (kilotons)

Segments Covered

By Product, Silica Content, Application, Process and Region.

Geographies Covered

Asia Pacific, Europe, Middle East & Africa, South and North America

Companies Covered

The major market players include Usher Agro Limited (India), KRBL Ltd. (India), Guru Meta Chem, (India), Yihai Kerry Investment (China), Jasurya Rice Mill (India), Rescon India Pvt Ltd (India), Astrra Chemicals (India), J M Biotech Pvt Ltd (India), Global Recycling(India), Rice Husk Ash (Thailand) Refsteel Solutions (India), Gia Gia Nguyen Co., Ltd (Vietnam), KV Menachem (India), NK Enterprises (India), and others.

This research report categorizes the Rice Husk Ash Market based on Silica Content, Process, Product, and Region.

Based on Silica Content, the rice husk ash market has been segmented as follows:
  • Silica content between 80-84%
  • Silica content between 85-89%
  • Silica content between 90-94%
  • Silica content more than or equal to 95% 
Based on Process, the rice husk ash market has been segmented as follows:
  • Alkaline extraction method for silica gel
  • Participated silica extraction method
  • Mesoporous silica extraction method
  • Silica gel extraction  by sol-gel method
Based on Product, the rice husk ash market has been segmented as follows:
  • Nodules
  • Powder
  • Granules
Based on region, the rice husk ash market has been segmented as follows:
  • Asia Pacific
  • Europe
  • Middle East & Africa
  • South America
  • North America

Frequently Asked Questions (FAQ):

To speak to our analyst for a discussion on the above findings, click Speak to Analyst

TABLE OF CONTENTS
 
1 INTRODUCTION (Page No. - 29)
    1.1 STUDY OBJECTIVES 
    1.2 MARKET DEFINITION 
           1.2.1 INCLUSIONS AND EXCLUSIONS
                    TABLE 1 RICE HUSK ASH MARKET: INCLUSIONS AND EXCLUSIONS
    1.3 MARKET SCOPE 
          FIGURE 1 RICE HUSK ASH MARKET SEGMENTATION
           1.3.1 REGIONAL SCOPE
           1.3.2 YEARS CONSIDERED
    1.4 CURRENCY CONSIDERED 
    1.5 UNITS CONSIDERED 
    1.6 LIMITATIONS 
    1.7 STAKEHOLDERS 
    1.8 SUMMARY OF CHANGES 
 
2 RESEARCH METHODOLOGY (Page No. - 33)
    2.1 RESEARCH DATA 
          FIGURE 2 RICE HUSK ASH MARKET: RESEARCH DESIGN
           2.1.1 SECONDARY DATA
                    2.1.1.1 Key data from secondary sources
           2.1.2 PRIMARY DATA
                    2.1.2.1 Key data from primary sources
                    2.1.2.2 Participating companies for primary research
                    2.1.2.3 Breakdown of interviews with experts
    2.2 MARKET SIZE ESTIMATION 
           2.2.1 BOTTOM-UP APPROACH
                    FIGURE 3 MARKET SIZE ESTIMATION: BOTTOM-UP APPROACH
           2.2.2 TOP-DOWN APPROACH
                    FIGURE 4 MARKET SIZE ESTIMATION: TOP-DOWN APPROACH
    2.3 METHODOLOGY FOR SUPPLY-SIDE SIZING OF RICE HUSK  ASH MARKET-1 
    2.4 METHODOLOGY FOR SUPPLY-SIDE SIZING OF RICE  HUSK ASH MARKET-2 
           2.4.1 CALCULATIONS FOR SUPPLY-SIDE ANALYSIS
           2.4.2 FORECAST
           2.4.3 GROWTH RATE ASSUMPTIONS/GROWTH FORECAST
    2.5 DATA TRIANGULATION 
          FIGURE 5 RICE HUSK ASH MARKET: DATA TRIANGULATION
           2.5.1 RESEARCH ASSUMPTIONS
           2.5.2 RESEARCH LIMITATIONS
           2.5.3 IMPACT OF RECESSION
           2.5.4 RISK ANALYSIS
 
3 EXECUTIVE SUMMARY (Page No. - 42)
    TABLE 2 RICE HUSK ASH MARKET SNAPSHOT: 2023 VS. 2028
    FIGURE 6 BUILDING & CONSTRUCTION SEGMENT TO DOMINATE MARKET DURING FORECAST PERIOD
    FIGURE 7 ASIA PACIFIC DOMINATED RICE HUSK ASH MARKET IN 2022
 
4 PREMIUM INSIGHTS (Page No. - 44)
    4.1 ATTRACTIVE OPPORTUNITIES FOR PLAYERS IN RICE HUSK  ASH MARKET 
          FIGURE 8 RICE HUSK ASH MARKET TO WITNESS SIGNIFICANT GROWTH  BETWEEN 2023 AND 2028
    4.2 RICE HUSK ASH MARKET, BY SILICA CONTENT 
          FIGURE 9 85-89% SEGMENT TO DOMINATE MARKET DURING FORECAST PERIOD
    4.3 RICE HUSK ASH MARKET, BY APPLICATION 
          FIGURE 10 BUILDING & CONSTRUCTION SEGMENT TO DOMINATE MARKET DURING FORECAST PERIOD
    4.4 RICE HUSK ASH MARKET, BY MAJOR COUNTRIES 
          FIGURE 11 MARKET IN INDIA TO GROW AT HIGHEST CAGR DURING FORECAST PERIOD
 
5 MARKET OVERVIEW (Page No. - 46)
    5.1 INTRODUCTION 
    5.2 MARKET DYNAMICS 
          FIGURE 12 DRIVERS, RESTRAINTS, OPPORTUNITIES, AND CHALLENGES IN RICE HUSK ASH MARKET
           5.2.1 DRIVERS
                    5.2.1.1 Low manufacturing and raw material cost
                    5.2.1.2 Use of rice husk ash to produce high-purity silica
                                FIGURE 13 RICE PRODUCTION, 2018 VS. 2021
           5.2.2 RESTRAINTS
                    5.2.2.1 High dependence on production of rice paddy
                    5.2.2.2 Availability of various substitutes
           5.2.3 OPPORTUNITIES
                    5.2.3.1 Increasing use of rice husk ash in production of rubber tires
                    5.2.3.2 Demand for rice husk ash in cement & construction industry
           5.2.4 CHALLENGES
                    5.2.4.1 Limited awareness and need for proper disposal of waste
                    5.2.4.2 Inefficient infrastructure and technology
    5.3 PORTER'S FIVE FORCES ANALYSIS 
          FIGURE 14 RICE HUSK ASH MARKET: PORTER'S FIVE FORCES ANALYSIS
          TABLE 3 RICE HUSK ASH MARKET: PORTER'S FIVE FORCES ANALYSIS
           5.3.1 BARGAINING POWER OF SUPPLIERS
           5.3.2 THREAT OF NEW ENTRANTS
           5.3.3 THREAT OF SUBSTITUTES
           5.3.4 BARGAINING POWER OF BUYERS
           5.3.5 INTENSITY OF COMPETITIVE RIVALRY
    5.4 REGULATORY LANDSCAPE 
           5.4.1 REGULATIONS RELATED TO RICE HUSK ASH MARKET
           5.4.2 REGULATORY BODIES, GOVERNMENT AGENCIES, AND OTHER ORGANIZATIONS
                    TABLE 4 NORTH AMERICA: REGULATORY BODIES, GOVERNMENT AGENCIES,  AND OTHER ORGANIZATIONS
                    TABLE 5 EUROPE: REGULATORY BODIES, GOVERNMENT AGENCIES, AND OTHER ORGANIZATIONS
                    TABLE 6 ASIA PACIFIC: REGULATORY BODIES, GOVERNMENT AGENCIES,  AND OTHER ORGANIZATIONS
    5.5 VALUE CHAIN ANALYSIS 
          FIGURE 15 RICE HUSK ASH MARKET: VALUE CHAIN ANALYSIS
           5.5.1 RAW MATERIAL PROCUREMENT
           5.5.2 RICE HUSK PROCESSING
           5.5.3 END-USE APPLICATIONS
    5.6 ECOSYSTEM/MARKET MAP 
          FIGURE 16 RICE HUSK ASH MARKET: ECOSYSTEM MAPPING
          TABLE 7 RICE HUSK ASH MARKET: ROLE IN ECOSYSTEM
    5.7 CASE STUDIES 
           5.7.1 PROBLEM STATEMENT
           5.7.2 SOLUTION OFFERED
    5.8 TECHNOLOGY ANALYSIS 
    5.9 KEY STAKEHOLDERS AND BUYING CRITERIA 
           5.9.1 KEY STAKEHOLDERS IN BUYING PROCESS
                    FIGURE 17 INFLUENCE OF STAKEHOLDERS ON BUYING PROCESS FOR  TOP THREE APPLICATIONS
                    TABLE 8 INFLUENCE OF STAKEHOLDERS ON BUYING PROCESS FOR TOP THREE APPLICATIONS (%)
           5.9.2 BUYING CRITERIA
                    FIGURE 18 KEY BUYING CRITERIA FOR TOP THREE APPLICATIONS
                    TABLE 9 KEY BUYING CRITERIA FOR TOP THREE APPLICATIONS
    5.10 KEY CONFERENCES AND EVENTS (2024) 
           TABLE 10 RICE HUSK ASH MARKET: KEY CONFERENCES AND EVENTS (2024)
    5.11 PRICING ANALYSIS 
           5.11.1 AVERAGE SELLING PRICE FOR RICE HUSK ASH, BY APPLICATION
                     FIGURE 19 AVERAGE SELLING PRICE FOR TOP THREE APPLICATIONS
           5.11.2 AVERAGE SELLING PRICE FOR RICE HUSK ASH, BY REGION
                     FIGURE 20 AVERAGE SELLING PRICE IN TOP THREE REGIONS
    5.12 TRADE DATA 
           TABLE 11 IMPORT OF RICE HUSK (USD THOUSAND)
           TABLE 12 EXPORT OF RICE HUSK (USD THOUSAND)
    5.13 TRENDS/DISRUPTIONS IMPACTING CUSTOMERS’ BUSINESSES 
           FIGURE 21 TRENDS/DISRUPTIONS IMPACTING CUSTOMERS' BUSINESSES
    5.14 PATENT ANALYSIS 
           5.14.1 METHODOLOGY
                     FIGURE 22 LIST OF MAJOR PATENTS FOR RICE HUSK ASH
           5.14.2 MAJOR PATENTS
 
6 RICE HUSK ASH MARKET, BY APPLICATION (Page No. - 65)
    6.1 INTRODUCTION 
          FIGURE 23 BUILDING & CONSTRUCTION APPLICATION SEGMENT TO DOMINATE MARKET DURING FORECAST PERIOD
          TABLE 13 RICE HUSK ASH MARKET, BY APPLICATION, 2018–2022 (KILOTON)
          TABLE 14 RICE HUSK ASH MARKET, BY APPLICATION, 2023–2028 (KILOTON)
          TABLE 15 RICE HUSK ASH MARKET, BY APPLICATION, 2018–2022 (USD MILLION)
          TABLE 16 RICE HUSK ASH MARKET, BY APPLICATION, 2023–2028 (USD MILLION)
    6.2 BUILDING & CONSTRUCTION 
           6.2.1 STRINGENT REGULATIONS AND SUSTAINABILITY TO DRIVE MARKET
                    TABLE 17 BUILDING & CONSTRUCTION: RICE HUSK ASH MARKET, BY REGION,  2018–2022 (KILOTON)
                    TABLE 18 BUILDING & CONSTRUCTION: RICE HUSK ASH MARKET, BY REGION,  2023–2028 (KILOTON)
                    TABLE 19 BUILDING & CONSTRUCTION: RICE HUSK ASH MARKET, BY REGION,  2018–2022 (USD MILLION)
                    TABLE 20 BUILDING & CONSTRUCTION: RICE HUSK ASH MARKET, BY REGION,  2023–2028 (USD MILLION)
    6.3 SILICA 
           6.3.1 RISING DEMAND IN FOOD & BEVERAGE, COSMETIC, AND CONSTRUCTION INDUSTRIES TO DRIVE MARKET
                    TABLE 21 SILICA: RICE HUSK ASH MARKET, BY REGION, 2018–2022 (KILOTON)
                    TABLE 22 SILICA: RICE HUSK ASH MARKET, BY REGION, 2023–2028 (KILOTON)
                    TABLE 23 SILICA: RICE HUSK ASH MARKET, BY REGION, 2018–2022 (USD MILLION)
                    TABLE 24 SILICA: RICE HUSK ASH MARKET, BY REGION, 2023–2028 (USD MILLION)
    6.4 STEEL 
           6.4.1 WIDELY USED IN STEEL INDUSTRY TO PRODUCE HIGH-STEEL QUALITY
                    TABLE 25 STEEL: RICE HUSK ASH MARKET, BY REGION, 2018–2022 (KILOTON)
                    TABLE 26 STEEL: RICE HUSK ASH MARKET, BY REGION, 2023–2028 (KILOTON)
                    TABLE 27 STEEL: RICE HUSK ASH MARKET, BY REGION, 2018–2022 (USD MILLION)
                    TABLE 28 STEEL: RICE HUSK ASH MARKET, BY REGION, 2023–2028 (USD MILLION)
    6.5 CERAMICS & REFRACTORY 
           6.5.1 INSULATION PROPERTIES AND RESISTANCE TO CHEMICAL CORROSION TO DRIVE MARKET
                    TABLE 29 CERAMICS & REFRACTORY: RICE HUSK ASH MARKET, BY REGION, 2018–2022 (KILOTON)
                    TABLE 30 CERAMICS & REFRACTORY: RICE HUSK ASH MARKET, BY REGION,  2023–2028 (KILOTON)
                    TABLE 31 CERAMICS & REFRACTORY: RICE HUSK ASH MARKET, BY REGION,  2018–2022 (USD MILLION)
                    TABLE 32 CERAMICS & REFRACTORY: RICE HUSK ASH MARKET, BY REGION,  2023–2028 (USD MILLION)
    6.6 RUBBER 
           6.6.1 RICE HUSK ASH USED TO IMPROVE MECHANICAL PROPERTIES OF RUBBER PRODUCTS
                    TABLE 33 RUBBER: RICE HUSK ASH MARKET, BY REGION, 2018–2022 (KILOTON)
                    TABLE 34 RUBBER: RICE HUSK ASH MARKET, BY REGION, 2023–2028 (KILOTON)
                    TABLE 35 RUBBER: RICE HUSK ASH MARKET, BY REGION, 2018–2022 (USD MILLION)
                    TABLE 36 RUBBER: RICE HUSK ASH MARKET, BY REGION, 2023–2028 (USD MILLION)
    6.7 OTHER APPLICATIONS 
          TABLE 37 OTHER APPLICATIONS: RICE HUSK ASH MARKET, BY REGION, 2018–2022 (KILOTON)
          TABLE 38 OTHER APPLICATIONS: RICE HUSK ASH MARKET, BY REGION,  2023–2028 (KILOTON)
          TABLE 39 OTHER APPLICATIONS: RICE HUSK ASH MARKET, BY REGION, 2018–2022 (USD MILLION)
          TABLE 40 OTHER APPLICATIONS: RICE HUSK ASH MARKET, BY REGION, 2023–2028 (USD MILLION)
 
7 RICE HUSK ASH MARKET, BY PRODUCT (Page No. - 78)
    7.1 INTRODUCTION 
    7.2 NODULES 
           7.2.1 ENABLES DENSITY REDUCTION IN CONCRETE AND IMPROVING DURABILITY AND STRENGTH
    7.3 POWDER 
           7.3.1 ABILITY TO INCREASE STRENGTH, DURABILITY, AND RESISTANCE TO CHEMICAL ATTACKS TO DRIVE MARKET
    7.4 GRANULES 
           7.4.1 DEMAND FOR SUSTAINABLE AND EFFICIENT SOLUTION IN CONSTRUCTION SECTOR TO DRIVE MARKET
 
8 RICE HUSK ASH MARKET, BY SILICA CONTENT (Page No. - 80)
    8.1 INTRODUCTION 
          FIGURE 24 85%-89% SEGMENT TO DOMINATE MARKET DURING FORECAST PERIOD
          TABLE 41 RICE HUSK ASH MARKET, BY SILICA CONTENT, 2018–2022 (KILOTON)
          TABLE 42 RICE HUSK ASH MARKET, BY SILICA CONTENT, 2023–2028 (KILOTON)
    8.2 80%-84% 
           8.2.1 REQUIREMENT FOR BALANCE BETWEEN COST AND SILICA CONTENT TO DRIVE MARKET
    8.3 85%-89% 
           8.3.1 GROWING DEMAND IN BUILDING & CONSTRUCTION SECTOR TO DRIVE MARKET
    8.4 90%-94 
           8.4.1 PRODUCTION OF HIGH-STRENGTH CONCRETE, CEMENT, AND OTHER ADVANCED MATERIALS TO DRIVE MARKET
    8.5 MORE THAN OR EQUAL TO 95% 
           8.5.1 DEMAND FOR HIGH-PURITY SILICA FOR SPECIALIZED APPLICATIONS IN PHARMACEUTICAL SECTOR TO DRIVE MARKET
 
9 RICE HUSK ASH MARKET, BY PROCESS (Page No. - 83)
    9.1 INTRODUCTION 
    9.2 ALKALINE EXTRACTION METHOD 
           9.2.1 INTEGRAL PROCESS FOR MEETING DEMANDS FOR PURE SILICA GEL
    9.3 PRECIPITATED SILICA EXTRACTION METHOD 
           9.3.1 WIDELY USED METHOD IN RICE HUSK ASH INDUSTRY FOR VARIOUS APPLICATIONS
    9.4 MESOPOROUS SILICA EXTRACTION METHOD 
           9.4.1 OFFERS COST-EFFECTIVE METHOD FOR SILICA EXTRACTION
    9.5 SILICA GEL EXTRACTION 
           9.5.1 OFFERS SUSTAINABLE ALTERNATIVE TO TRADITIONAL HEAT-BASED EXTRACTION METHODS
 
10 RICE HUSK ASH MARKET, BY REGION (Page No. - 85)
     10.1 INTRODUCTION 
             FIGURE 25 ASIA PACIFIC TO DOMINATE MARKET DURING FORECAST PERIOD
             TABLE 43 RICE HUSK ASH MARKET, BY REGION, 2018–2022 (KILOTON)
             TABLE 44 RICE HUSK ASH MARKET, BY REGION, 2023–2028 (KILOTON)
             TABLE 45 RICE HUSK ASH MARKET, BY REGION, 2018–2022 (USD MILLION)
             TABLE 46 RICE HUSK ASH MARKET, BY REGION, 2023–2028 (USD MILLION)
     10.2 ASIA PACIFIC 
             10.2.1 IMPACT OF RECESSION ON ASIA PACIFIC
                        FIGURE 26 ASIA PACIFIC: RICE HUSK ASH MARKET SNAPSHOT
                        TABLE 47 ASIA PACIFIC: RICE HUSK ASH MARKET, BY COUNTRY, 2018–2022 (KILOTON)
                        TABLE 48 ASIA PACIFIC: RICE HUSK ASH MARKET, BY COUNTRY, 2023–2028 (KILOTON)
                        TABLE 49 ASIA PACIFIC: RICE HUSK ASH MARKET, BY COUNTRY, 2018–2022 (USD MILLION)
                        TABLE 50 ASIA PACIFIC: RICE HUSK ASH MARKET, BY COUNTRY, 2023–2028 (USD MILLION)
                        TABLE 51 ASIA PACIFIC: RICE HUSK ASH MARKET, BY APPLICATION, 2018–2022 (KILOTON)
                        TABLE 52 ASIA PACIFIC: RICE HUSK ASH MARKET, BY APPLICATION, 2023–2028 (KILOTON)
                        TABLE 53 ASIA PACIFIC: RICE HUSK ASH MARKET, BY APPLICATION, 2018–2022 (USD MILLION)
                        TABLE 54 ASIA PACIFIC: RICE HUSK ASH MARKET, BY APPLICATION, 2023–2028 (USD MILLION)
             10.2.2 CHINA
                        10.2.2.1 Government subsidies for increased rice production to drive market
                                      TABLE 55 CHINA: RICE HUSK ASH MARKET, BY APPLICATION, 2018–2022 (KILOTON)
                                      TABLE 56 CHINA: RICE HUSK ASH MARKET, BY APPLICATION, 2023–2028 (KILOTON)
                                      TABLE 57 CHINA: RICE HUSK ASH MARKET, BY APPLICATION, 2018–2022 (USD MILLION)
                                      TABLE 58 CHINA: RICE HUSK ASH MARKET, BY APPLICATION, 2023–2028 (USD MILLION)
             10.2.3 SOUTH KOREA
                        10.2.3.1 Surge in rice production to drive market
                                      TABLE 59 SOUTH KOREA: RICE HUSK ASH MARKET, BY APPLICATION, 2018–2022 (KILOTON)
                                      TABLE 60 SOUTH KOREA: RICE HUSK ASH MARKET, BY APPLICATION, 2023–2028 (KILOTON)
                                      TABLE 61 SOUTH KOREA: RICE HUSK ASH MARKET, BY APPLICATION, 2018–2022 (USD MILLION)
                                      TABLE 62 SOUTH KOREA: RICE HUSK ASH MARKET, BY APPLICATION, 2023–2028 (USD MILLION)
             10.2.4 JAPAN
                        10.2.4.1 Technological advancements and sustainability to drive market
                                      TABLE 63 JAPAN: RICE HUSK ASH MARKET, BY APPLICATION, 2018–2022 (KILOTON)
                                      TABLE 64 JAPAN: RICE HUSK ASH MARKET, BY APPLICATION, 2023–2028 (KILOTON)
                                      TABLE 65 JAPAN: RICE HUSK ASH MARKET, BY APPLICATION, 2018–2022 (USD MILLION)
                                      TABLE 66 JAPAN: RICE HUSK ASH MARKET, BY APPLICATION, 2023–2028 (USD MILLION)
             10.2.5 INDIA
                        10.2.5.1 Government support for agricultural sector to drive market
                                      TABLE 67 INDIA: RICE HUSK ASH MARKET, BY APPLICATION, 2018–2022 (KILOTON)
                                      TABLE 68 INDIA: RICE HUSK ASH MARKET, BY APPLICATION, 2023–2028 (KILOTON)
                                      TABLE 69 INDIA: RICE HUSK ASH MARKET, BY APPLICATION, 2018–2022 (USD MILLION)
                                      TABLE 70 INDIA: RICE HUSK ASH MARKET, BY APPLICATION, 2023–2028 (USD MILLION)
             10.2.6 VIETNAM
                        10.2.6.1 Technological advancements in rice production to drive market
                                      TABLE 71 VIETNAM: RICE HUSK ASH MARKET, BY APPLICATION, 2018–2022 (KILOTON)
                                      TABLE 72 VIETNAM: RICE HUSK ASH MARKET, BY APPLICATION, 2023–2028 (KILOTON)
                                      TABLE 73 VIETNAM: RICE HUSK ASH MARKET, BY APPLICATION, 2018–2022 (USD MILLION)
                                      TABLE 74 VIETNAM: RICE HUSK ASH MARKET, BY APPLICATION, 2023–2028 (USD MILLION)
             10.2.7 THAILAND
                        10.2.7.1 Significant production of rice to drive market
                                      TABLE 75 THAILAND: RICE HUSK ASH MARKET, BY APPLICATION, 2018–2022 (KILOTON)
                                      TABLE 76 THAILAND: RICE HUSK ASH MARKET, BY APPLICATION, 2023–2028 (KILOTON)
                                      TABLE 77 THAILAND: RICE HUSK ASH MARKET, BY APPLICATION, 2018–2022 (USD MILLION)
                                      TABLE 78 THAILAND: RICE HUSK ASH MARKET, BY APPLICATION, 2023–2028 (USD MILLION)
             10.2.8 REST OF ASIA PACIFIC
                        TABLE 79 REST OF ASIA PACIFIC: RICE HUSK ASH MARKET, BY APPLICATION,  2018–2022 (KILOTON)
                        TABLE 80 REST OF ASIA PACIFIC: RICE HUSK ASH MARKET, BY APPLICATION,  2023–2028 (KILOTON)
                        TABLE 81 REST OF ASIA PACIFIC: RICE HUSK ASH MARKET, BY APPLICATION,  2018–2022 (USD MILLION)
                        TABLE 82 REST OF ASIA PACIFIC: RICE HUSK ASH MARKET, BY APPLICATION,  2023–2028 (USD MILLION)
     10.3 NORTH AMERICA 
             10.3.1 IMPACT OF RECESSION ON NORTH AMERICA
                        FIGURE 27 NORTH AMERICA: RICE HUSH ASH MARKET SNAPSHOT
                        TABLE 83 NORTH AMERICA: RICE HUSK ASH MARKET, BY COUNTRY, 2018–2022 (KILOTON)
                        TABLE 84 NORTH AMERICA: RICE HUSK ASH MARKET, BY COUNTRY, 2023–2028 (KILOTON)
                        TABLE 85 NORTH AMERICA: RICE HUSK ASH MARKET, BY COUNTRY,  2018–2022 (USD MILLION)
                        TABLE 86 NORTH AMERICA: RICE HUSK ASH MARKET, BY COUNTRY,  2023–2028 (USD MILLION)
                        TABLE 87 NORTH AMERICA: RICE HUSK ASH MARKET, BY APPLICATION, 2018–2022 (KILOTON)
                        TABLE 88 NORTH AMERICA: RICE HUSK ASH MARKET, BY APPLICATION, 2023–2028 (KILOTON)
                        TABLE 89 NORTH AMERICA: RICE HUSK ASH MARKET, BY APPLICATION,  2018–2022 (USD MILLION)
                        TABLE 90 NORTH AMERICA: RICE HUSK ASH MARKET, BY APPLICATION,  2023–2028 (USD MILLION)
             10.3.2 US
                        10.3.2.1 Expanding rice production to drive market
                                      TABLE 91 US: RICE HUSK ASH MARKET, BY APPLICATION, 2018–2022 (KILOTON)
                                      TABLE 92 US: RICE HUSK ASH MARKET, BY APPLICATION, 2023–2028 (KILOTON)
                                      TABLE 93 US: RICE HUSK ASH MARKET, BY APPLICATION, 2018–2022 (USD MILLION)
                                      TABLE 94 US: RICE HUSK ASH MARKET, BY APPLICATION, 2023–2028 (USD MILLION)
             10.3.3 CANADA
                        10.3.3.1 Emphasis on sustainable agriculture and innovation to drive market
                                      TABLE 95 CANADA: RICE HUSK ASH MARKET, BY APPLICATION, 2018–2022 (KILOTON)
                                      TABLE 96 CANADA: RICE HUSK ASH MARKET, BY APPLICATION, 2023–2028 (KILOTON)
                                      TABLE 97 CANADA: RICE HUSK ASH MARKET, BY APPLICATION, 2018–2022 (USD MILLION)
                                      TABLE 98 CANADA: RICE HUSK ASH MARKET, BY APPLICATION, 2023–2028 (USD MILLION)
             10.3.4 MEXICO
                        10.3.4.1 Favorable climate, technological advancements, and supportive government policies to drive market
                                      TABLE 99 MEXICO: RICE HUSK ASH MARKET, BY APPLICATION, 2018–2022 (KILOTON)
                                      TABLE 100 MEXICO: RICE HUSK ASH MARKET, BY APPLICATION, 2023–2028 (KILOTON)
                                      TABLE 101 MEXICO: RICE HUSK ASH MARKET, BY APPLICATION, 2018–2022 (USD MILLION)
                                      TABLE 102 MEXICO: RICE HUSK ASH MARKET, BY APPLICATION, 2023–2028 (USD MILLION)
     10.4 EUROPE 
             10.4.1 IMPACT OF RECESSION ON EUROPE
                        FIGURE 28 EUROPE: RICE HUSK ASH MARKET SNAPSHOT
                        TABLE 103 EUROPE: RICE HUSK ASH MARKET, BY COUNTRY, 2018–2022 (KILOTON)
                        TABLE 104 EUROPE: RICE HUSK ASH MARKET, BY COUNTRY, 2023–2028 (KILOTON)
                        TABLE 105 EUROPE: RICE HUSK ASH MARKET, BY COUNTRY, 2018–2022 (USD MILLION)
                        TABLE 106 EUROPE: RICE HUSK ASH MARKET, BY COUNTRY, 2023–2028 (USD MILLION)
                        TABLE 107 EUROPE: RICE HUSK ASH MARKET, BY APPLICATION, 2018–2022 (KILOTON)
                        TABLE 108 EUROPE: RICE HUSK ASH MARKET, BY APPLICATION, 2023–2028 (KILOTON)
                        TABLE 109 EUROPE: RICE HUSK ASH MARKET, BY APPLICATION, 2018–2022 (USD MILLION)
                        TABLE 110 EUROPE: RICE HUSK ASH MARKET, BY APPLICATION, 2023–2028 (USD MILLION)
             10.4.2 GERMANY
                        10.4.2.1 Growing construction sector to drive market
                                      TABLE 111 GERMANY: RICE HUSK ASH MARKET, BY APPLICATION, 2018–2022 (KILOTON)
                                      TABLE 112 GERMANY: RICE HUSK ASH MARKET, BY APPLICATION, 2023–2028 (KILOTON)
                                      TABLE 113 GERMANY: RICE HUSK ASH MARKET, BY APPLICATION, 2018–2022 (USD MILLION)
                                      TABLE 114 GERMANY: RICE HUSK ASH MARKET, BY APPLICATION, 2023–2028 (USD MILLION)
             10.4.3 FRANCE
                        10.4.3.1 Construction and agriculture sectors to drive market
                                      TABLE 115 FRANCE: RICE HUSK ASH MARKET, BY APPLICATION, 2018–2022 (KILOTON)
                                      TABLE 116 FRANCE: RICE HUSK ASH MARKET, BY APPLICATION, 2023–2028 (KILOTON)
                                      TABLE 117 FRANCE: RICE HUSK ASH MARKET, BY APPLICATION, 2018–2022 (USD MILLION)
                                      TABLE 118 FRANCE: RICE HUSK ASH MARKET, BY APPLICATION, 2023–2028 (USD MILLION)
             10.4.4 UK
                        10.4.4.1 Demand in construction sector to drive market
                                      TABLE 119 UK: RICE HUSK ASH MARKET, BY APPLICATION, 2018–2022 (KILOTON)
                                      TABLE 120 UK: RICE HUSK ASH MARKET, BY APPLICATION, 2023–2028 (KILOTON)
                                      TABLE 121 UK: RICE HUSK ASH MARKET, BY APPLICATION, 2018–2022 (USD MILLION)
                                      TABLE 122 UK: RICE HUSK ASH MARKET, BY APPLICATION, 2023–2028 (USD MILLION)
             10.4.5 ITALY
                        10.4.5.1 Extensive growth of rice sector to drive market
                                      TABLE 123 ITALY: RICE HUSK ASH MARKET, BY APPLICATION, 2018–2022 (KILOTON)
                                      TABLE 124 ITALY: RICE HUSK ASH MARKET, BY APPLICATION, 2023–2028 (KILOTON)
                                      TABLE 125 ITALY: RICE HUSK ASH MARKET, BY APPLICATION, 2018–2022 (USD MILLION)
                                      TABLE 126 ITALY: RICE HUSK ASH MARKET, BY APPLICATION, 2023–2028 (USD MILLION)
             10.4.6 SPAIN
                        10.4.6.1 Significant growth of ceramics & refractory sector to drive market
                                      TABLE 127 SPAIN: RICE HUSK ASH MARKET, BY APPLICATION, 2018–2022 (KILOTON)
                                      TABLE 128 SPAIN: RICE HUSK ASH MARKET, BY APPLICATION, 2023–2028 (KILOTON)
                                      TABLE 129 SPAIN: RICE HUSK ASH MARKET, BY APPLICATION, 2018–2022 (USD MILLION)
                                      TABLE 130 SPAIN: RICE HUSK ASH MARKET, BY APPLICATION, 2023–2028 (USD MILLION)
             10.4.7 RUSSIA
                        10.4.7.1 Investments to increase self-sufficiency in rice production to drive market
                                      TABLE 131 RUSSIA: RICE HUSK ASH MARKET, BY APPLICATION, 2018–2022 (KILOTON)
                                      TABLE 132 RUSSIA: RICE HUSK ASH MARKET, BY APPLICATION, 2023–2028 (KILOTON)
                                      TABLE 133 RUSSIA: RICE HUSK ASH MARKET, BY APPLICATION, 2018–2022 (USD MILLION)
                                      TABLE 134 RUSSIA: RICE HUSK ASH MARKET, BY APPLICATION, 2023–2028 (USD MILLION)
             10.4.8 REST OF EUROPE
                        TABLE 135 REST OF EUROPE: RICE HUSK ASH MARKET, BY APPLICATION, 2018–2022 (KILOTON)
                        TABLE 136 REST OF EUROPE: RICE HUSK ASH MARKET, BY APPLICATION, 2023–2028 (KILOTON)
                        TABLE 137 REST OF EUROPE: RICE HUSK ASH MARKET, BY APPLICATION,  2018–2022 (USD MILLION)
                        TABLE 138 REST OF EUROPE: RICE HUSK ASH MARKET, BY APPLICATION,  2023–2028 (USD MILLION)
     10.5 MIDDLE EAST & AFRICA 
             10.5.1 IMPACT OF RECESSION ON MIDDLE EAST & AFRICA
                        TABLE 139 MIDDLE EAST & AFRICA: RICE HUSK ASH MARKET, BY COUNTRY, 2018–2022 (KILOTON)
                        TABLE 140 MIDDLE EAST & AFRICA: RICE HUSK ASH MARKET, BY COUNTRY, 2023–2028 (KILOTON)
                        TABLE 141 MIDDLE EAST & AFRICA: RICE HUSK ASH MARKET, BY COUNTRY,  2018–2022 (USD MILLION)
                        TABLE 142 MIDDLE EAST & AFRICA: RICE HUSK ASH MARKET, BY COUNTRY,  2023–2028 (USD MILLION)
                        TABLE 143 MIDDLE EAST & AFRICA: RICE HUSK ASH MARKET, BY APPLICATION,  2018–2022 (KILOTON)
                        TABLE 144 MIDDLE EAST & AFRICA: RICE HUSK ASH MARKET, BY APPLICATION,  2023–2028 (KILOTON)
                        TABLE 145 MIDDLE EAST & AFRICA: RICE HUSK ASH MARKET, BY APPLICATION,  2018–2022 (USD MILLION)
                        TABLE 146 MIDDLE EAST & AFRICA: RICE HUSK ASH MARKET, BY APPLICATION,  2023–2028 (USD MILLION)
             10.5.2 GCC COUNTRIES
                        10.5.2.1 Saudi Arabia
                                     10.5.2.1.1 Growing steel industry to drive market
                                                      TABLE 147 SAUDI ARABIA: RICE HUSK ASH MARKET, BY APPLICATION, 2018–2022 (KILOTON)
                                                      TABLE 148 SAUDI ARABIA: RICE HUSK ASH MARKET, BY APPLICATION, 2023–2028 (KILOTON)
                                                      TABLE 149 SAUDI ARABIA: RICE HUSK ASH MARKET, BY APPLICATION, 2018–2022 (USD MILLION)
                                                      TABLE 150 SAUDI ARABIA: RICE HUSK ASH MARKET, BY APPLICATION, 2023–2028 (USD MILLION)
                        10.5.2.2 UAE
                                     10.5.2.2.1 Demand for sustainable building materials to drive market
                                                      TABLE 151 UAE: RICE HUSK ASH MARKET, BY APPLICATION, 2018–2022 (KILOTON)
                                                      TABLE 152 UAE: RICE HUSK ASH MARKET, BY APPLICATION, 2023–2028 (KILOTON)
                                                      TABLE 153 UAE: RICE HUSK ASH MARKET, BY APPLICATION, 2018–2022 (USD MILLION)
                                                      TABLE 154 UAE: RICE HUSK ASH MARKET, BY APPLICATION, 2023–2028 (USD MILLION)
                        10.5.2.3 Rest of GCC countries
             10.5.3 IRAN
                        10.5.3.1 Modernization, technological advancements, and improved irrigation systems in rice production to drive market
                                      TABLE 155 IRAN: RICE HUSK ASH MARKET, BY APPLICATION, 2018–2022 (KILOTON)
                                      TABLE 156 IRAN: RICE HUSK ASH MARKET, BY APPLICATION, 2023–2028 (KILOTON)
                                      TABLE 157 IRAN: RICE HUSK ASH MARKET, BY APPLICATION, 2018–2022 (USD MILLION)
                                      TABLE 158 IRAN: RICE HUSK ASH MARKET, BY APPLICATION, 2023–2028 (USD MILLION)
             10.5.4 REST OF MIDDLE EAST & AFRICA
                        TABLE 159 REST OF MIDDLE EAST & AFRICA: RICE HUSK ASH MARKET, BY APPLICATION,  2018–2022 (KILOTON)
                        TABLE 160 REST OF MIDDLE EAST & AFRICA: RICE HUSK ASH MARKET, BY APPLICATION,  2023–2028 (KILOTON)
                        TABLE 161 REST OF MIDDLE EAST & AFRICA: RICE HUSK ASH MARKET, BY APPLICATION,  2018–2022 (USD MILLION)
                        TABLE 162 REST OF MIDDLE EAST & AFRICA: RICE HUSK ASH MARKET, BY APPLICATION,  2023–2028 (USD MILLION)
     10.6 SOUTH AMERICA 
             10.6.1 IMPACT OF RECESSION
                        TABLE 163 SOUTH AMERICA: RICE HUSK ASH MARKET, BY COUNTRY, 2018–2022 (KILOTON)
                        TABLE 164 SOUTH AMERICA: RICE HUSK ASH MARKET, BY COUNTRY, 2023–2028 (KILOTON)
                        TABLE 165 SOUTH AMERICA: RICE HUSK ASH MARKET, BY COUNTRY, 2018–2022 (USD MILLION)
                        TABLE 166 SOUTH AMERICA: RICE HUSK ASH MARKET, BY COUNTRY, 2023–2028 (USD MILLION)
                        TABLE 167 SOUTH AMERICA: RICE HUSK ASH MARKET, BY APPLICATION, 2018–2022 (KILOTON)
                        TABLE 168 SOUTH AMERICA: RICE HUSK ASH MARKET, BY APPLICATION, 2023–2028 (KILOTON)
                        TABLE 169 SOUTH AMERICA: RICE HUSK ASH MARKET, BY APPLICATION, 2018–2022 (USD MILLION)
                        TABLE 170 SOUTH AMERICA: RICE HUSK ASH MARKET, BY APPLICATION, 2023–2028 (USD MILLION)
             10.6.2 BRAZIL
                        10.6.2.1 Government focus on promoting sustainable practices and reducing waste to drive market
                                      TABLE 171 BRAZIL: RICE HUSK ASH MARKET, BY APPLICATION, 2018–2022 (KILOTON)
                                      TABLE 172 BRAZIL: RICE HUSK ASH MARKET, BY APPLICATION, 2023–2028 (KILOTON)
                                      TABLE 173 BRAZIL: RICE HUSK ASH MARKET, BY APPLICATION, 2018–2022 (USD MILLION)
                                      TABLE 174 BRAZIL: RICE HUSK ASH MARKET, BY APPLICATION, 2023–2028 (USD MILLION)
             10.6.3 ARGENTINA
                        10.6.3.1 Advanced farming techniques, improved seed varieties, and enhanced productivity of rice to drive market
                                      TABLE 175 ARGENTINA: RICE HUSK ASH MARKET, BY APPLICATION, 2018–2022 (KILOTON)
                                      TABLE 176 ARGENTINA: RICE HUSK ASH MARKET, BY APPLICATION, 2023–2028 (KILOTON)
                                      TABLE 177 ARGENTINA: RICE HUSK ASH MARKET, BY APPLICATION, 2018–2022 (USD MILLION)
                                      TABLE 178 ARGENTINA: RICE HUSK ASH MARKET, BY APPLICATION, 2023–2028 (USD MILLION)
             10.6.4 COLOMBIA
                        10.6.4.1 Adoption of sustainable practices in construction to drive market
                                      TABLE 179 COLOMBIA: RICE HUSK ASH MARKET, BY APPLICATION, 2018–2022 (KILOTON)
                                      TABLE 180 COLOMBIA: RICE HUSK ASH MARKET, BY APPLICATION, 2023–2028 (KILOTON)
                                      TABLE 181 COLOMBIA: RICE HUSK ASH MARKET, BY APPLICATION, 2018–2022 (USD MILLION)
                                      TABLE 182 COLOMBIA: RICE HUSK ASH MARKET, BY APPLICATION, 2023–2028 (USD MILLION)
             10.6.5 REST OF SOUTH AMERICA
                        TABLE 183 REST OF SOUTH AMERICA: RICE HUSK ASH MARKET, BY APPLICATION,  2018–2022 (KILOTON)
                        TABLE 184 REST OF SOUTH AMERICA: RICE HUSK ASH MARKET, BY APPLICATION,  2023–2028 (KILOTON)
                        TABLE 185 REST OF SOUTH AMERICA: RICE HUSK ASH MARKET, BY APPLICATION,  2018–2022 (USD MILLION)
                        TABLE 186 REST OF SOUTH AMERICA: RICE HUSK ASH MARKET, BY APPLICATION,  2023–2028 (USD MILLION)
 
11 COMPETITIVE LANDSCAPE (Page No. - 149)
     11.1 INTRODUCTION 
     11.2 STRATEGIES ADOPTED BY KEY PLAYERS 
             11.2.1 OVERVIEW OF STRATEGIES ADOPTED BY KEY MANUFACTURERS
     11.3 REVENUE ANALYSIS 
             FIGURE 29 REVENUE ANALYSIS OF KEY COMPANIES (2018–2022)
     11.4 MARKET SHARE ANALYSIS 
             11.4.1 RANKING OF KEY MARKET PLAYERS
                        FIGURE 30 RANKING OF TOP 5 PLAYERS IN RICE HUSK ASH MARKET, 2022
             11.4.2 MARKET SHARE OF KEY PLAYERS
                        FIGURE 31 RICE HUSK ASH MARKET SHARE ANALYSIS
                        TABLE 187 DEGREE OF COMPETITION: RICE HUSK ASH MARKET
     11.5 BRAND/PRODUCT COMPARISON 
             11.5.1 RICE HUSK ASH POWDER BY USHER AGRO LTD.
             11.5.2 RICE HUSK ASH POWDER BY KRBL LTD.
             11.5.3 RICE HUSK ASH POWDER BY GURU METACHEM
             11.5.4 RICE HUSK ASH POWDER BY YIHAI KERRY ARAWANA  HOLDINGS CO., LTD
             11.5.5 RICE HUSK ASH POWDER BY JASORIYA RICE MILL
     11.6 COMPANY EVALUATION MATRIX (TIER 1) 
             11.6.1 STARS
             11.6.2 EMERGING LEADERS
             11.6.3 PERVASIVE PLAYERS
             11.6.4 PARTICIPANTS
                        FIGURE 32 RICE HUSK ASH MARKET: COMPANY EVALUATION MATRIX (KEY PLAYERS)
             11.6.5 COMPANY FOOTPRINT
                        FIGURE 33 COMPANY OVERALL FOOTPRINT (16 COMPANIES)
                        TABLE 188 COMPANY REGION FOOTPRINT (16 COMPANIES)
                        TABLE 189 COMPANY PRODUCT FOOTPRINT (16 COMPANIES)
                        TABLE 190 COMPANY APPLICATION FOOTPRINT (16 COMPANIES)
     11.7 STARTUP/SME EVALUATION MATRIX 
             11.7.1 PROGRESSIVE COMPANIES
             11.7.2 RESPONSIVE COMPANIES
             11.7.3 DYNAMIC COMPANIES
             11.7.4 STARTING BLOCKS
                        FIGURE 34 RICE HUSK ASH MARKET: STARTUP/SME EVALUATION MATRIX
             11.7.5 COMPETITIVE BENCHMARKING
                        TABLE 191 DETAILED LIST OF KEY STARTUPS/SMES
                        TABLE 192 COMPETITIVE BENCHMARKING OF KEY STARTUPS/SMES
 
12 COMPANY PROFILES (Page No. - 163)
(Business overview, Products/Services/Solutions offered, Recent Developments, MNM view)*
     12.1 KEY PLAYERS 
             12.1.1 USHER AGRO LTD.
                        TABLE 193 USHER AGRO LTD.: COMPANY OVERVIEW
                        TABLE 194 USHER AGRO LTD.: PRODUCTS/SOLUTIONS/SERVICES OFFERED
             12.1.2 KRBL LIMITED
                        TABLE 195 KRBL LTD.: COMPANY OVERVIEW
                        FIGURE 35 KRBL LTD.: COMPANY SNAPSHOT
                        TABLE 196 KRBL LTD.: PRODUCTS/SOLUTIONS/SERVICES OFFERED
             12.1.3 GURU METACHEM
                        TABLE 197 GURU METACHEM: COMPANY OVERVIEW
                        TABLE 198 GURU METACHEM: PRODUCTS/SOLUTIONS/SERVICES OFFERED
             12.1.4 YIHAI KERRY ARAWANA HOLDINGS CO., LTD.
                        TABLE 199 YIHAI KERRY ARAWANA HOLDINGS CO., LTD.: COMPANY OVERVIEW
                        TABLE 200 YIHAI KERRY ARAWANA HOLDINGS CO., LTD.: PRODUCTS/SOLUTIONS/SERVICES OFFERED
             12.1.5 JASORIYA RICE MILL
                        TABLE 201 JASORIYA RICE MILL: COMPANY OVERVIEW
                        TABLE 202 JASORIYA RICE MILL: PRODUCTS/SOLUTIONS/SERVICES OFFERED
             12.1.6 RESCON INDIA PVT. LTD.
                        TABLE 203 RESCON INDIA PVT. LTD.: COMPANY OVERVIEW
                        TABLE 204 RESCON INDIA PVT. LTD.: PRODUCTS/SOLUTIONS/SERVICES OFFERED
             12.1.7 ASTRRA CHEMICALS
                        TABLE 205 ASTRRA CHEMICALS: COMPANY OVERVIEW
                        TABLE 206 ASTRRA CHEMICALS: PRODUCTS/SOLUTIONS/SERVICES OFFERED
             12.1.8 J.M. BIOTECH PVT. LTD.
                        TABLE 207 J.M. BIOTECH PVT. LTD.: COMPANY OVERVIEW
                        TABLE 208 J.M. BIOTECH PVT. LTD.: PRODUCTS/SOLUTIONS/SERVICES OFFERED
             12.1.9 RICE HUSK ASH (THAILAND)
                        TABLE 209 RICE HUSK ASH (THAILAND): COMPANY OVERVIEW
                        TABLE 210 RICE HUSK ASH (THAILAND): PRODUCTS/SOLUTIONS/SERVICES OFFERED
             12.1.10 REFSTEEL SOLUTIONS
                        TABLE 211 REFSTEEL SOLUTIONS: COMPANY OVERVIEW
                        TABLE 212 REFSTEEL SOLUTIONS: PRODUCTS/SOLUTIONS/SERVICES OFFERED
             12.1.11 GLOBAL RECYCLING
                        TABLE 213 GLOBAL RECYCLING: COMPANY OVERVIEW
                        TABLE 214 GLOBAL RECYCLING: PRODUCTS/SOLUTIONS/SERVICES OFFERED
             12.1.12 GIA GIA NGUYEN CO., LTD.
                        TABLE 215 GIA GIA NGUYEN CO., LTD.: COMPANY OVERVIEW
                        TABLE 216 GIA GIA NGUYEN CO., LTD.: PRODUCTS/SOLUTIONS/SERVICES OFFERED
             12.1.13 KV METACHEM
                        TABLE 217 KV METACHEM: COMPANY OVERVIEW
                        TABLE 218 KV METACHEM: PRODUCTS/SOLUTIONS/SERVICES OFFERED
             12.1.14 NK ENTERPRISES
                        TABLE 219 NK ENTERPRISES: COMPANY OVERVIEW
                        TABLE 220 NK ENTERPRISES: PRODUCTS/SOLUTIONS/SERVICES OFFERED
             12.1.15 GELEX AGRO INDUSTRIAL CO., LTD.
                        TABLE 221 GELEX AGRO INDUSTRIAL CO., LTD: COMPANY OVERVIEW
                        TABLE 222 GELEX AGRO INDUSTRIAL CO., LTD.: PRODUCTS/SOLUTIONS/SERVICES OFFERED
             12.1.16 REFRATECHNIK
                        TABLE 223 REFRATECHNIK: COMPANY OVERVIEW
                        TABLE 224 REFRATECHNIK: PRODUCTS/SOLUTIONS/SERVICES OFFERED
     12.2 OTHER PLAYERS 
             12.2.1 VENSPRA IMPEX
                        TABLE 225 VENSPRA IMPEX: COMPANY OVERVIEW
             12.2.2 GLOBAL SILICON
                        TABLE 226 GLOBAL SILICON: COMPANY OVERVIEW
             12.2.3 STEELCON INDUSTRIES
                        TABLE 227 STEELCON INDUSTRIES: COMPANY OVERVIEW
             12.2.4 HARIPRIYA AGRO INDUSTRIES
                        TABLE 228 HARIPRIYA AGRO INDUSTRIES: COMPANY OVERVIEW
 
*Details on Business overview, Products/Services/Solutions offered, Recent Developments, MNM view might not be captured in case of unlisted companies.
 
13 ADJACENT AND RELATED MARKETS (Page No. - 190)
     13.1 INTRODUCTION 
     13.2 LIMITATIONS 
     13.3 RICE HUSK ASH INTERCONNECTED MARKET 
     13.4 SEEDS MARKET 
             13.4.1 MARKET DEFINITION
             13.4.2 MARKET OVERVIEW
             13.4.3 SEEDS MARKET, BY TYPE
                        TABLE 229 SEEDS MARKET, BY TYPE, 2018–2022 (USD MILLION)
                        TABLE 230 SEEDS MARKET, BY TYPE, 2023–2028 (USD MILLION)
                        13.4.3.1 Conventional seeds
                        13.4.3.2 Genetically modified seeds
 
14 APPENDIX (Page No. - 193)
     14.1 DISCUSSION GUIDE 
     14.2 KNOWLEDGESTORE: MARKETSANDMARKETS’  SUBSCRIPTION PORTAL 
     14.3 CUSTOMIZATION OPTIONS 
     14.4 RELATED REPORTS 
     14.5 AUTOR DETAILS 

The study involved four major activities in estimating the current size of the rice husk ash market. Exhaustive secondary research was done to collect information on the market, peer markets, and parent market. The next step was to validate these findings, assumptions, and sizing with the industry experts across the Rice Husk Ash market value chain through primary research. Both top-down and bottom-up approaches were employed to estimate the complete market size. Thereafter, market breakdown and data triangulation were used to estimate the market size of segments and subsegments.

Secondary Research

Secondary sources for this research study include annual reports, press releases, and investor presentations of companies; white papers; certified publications; and articles by recognized authors; gold- and silver-standard websites; Rice Husk Ash market manufacturing companies, regulatory bodies, trade directories, and databases. The secondary research was mainly used to obtain key information about the industry’s supply chain, the total pool of key players, market classification, and segmentation according to industry trends to the bottom-most level and regional markets. It has also been used to obtain information about key developments from a market-oriented perspective.

Primary Research

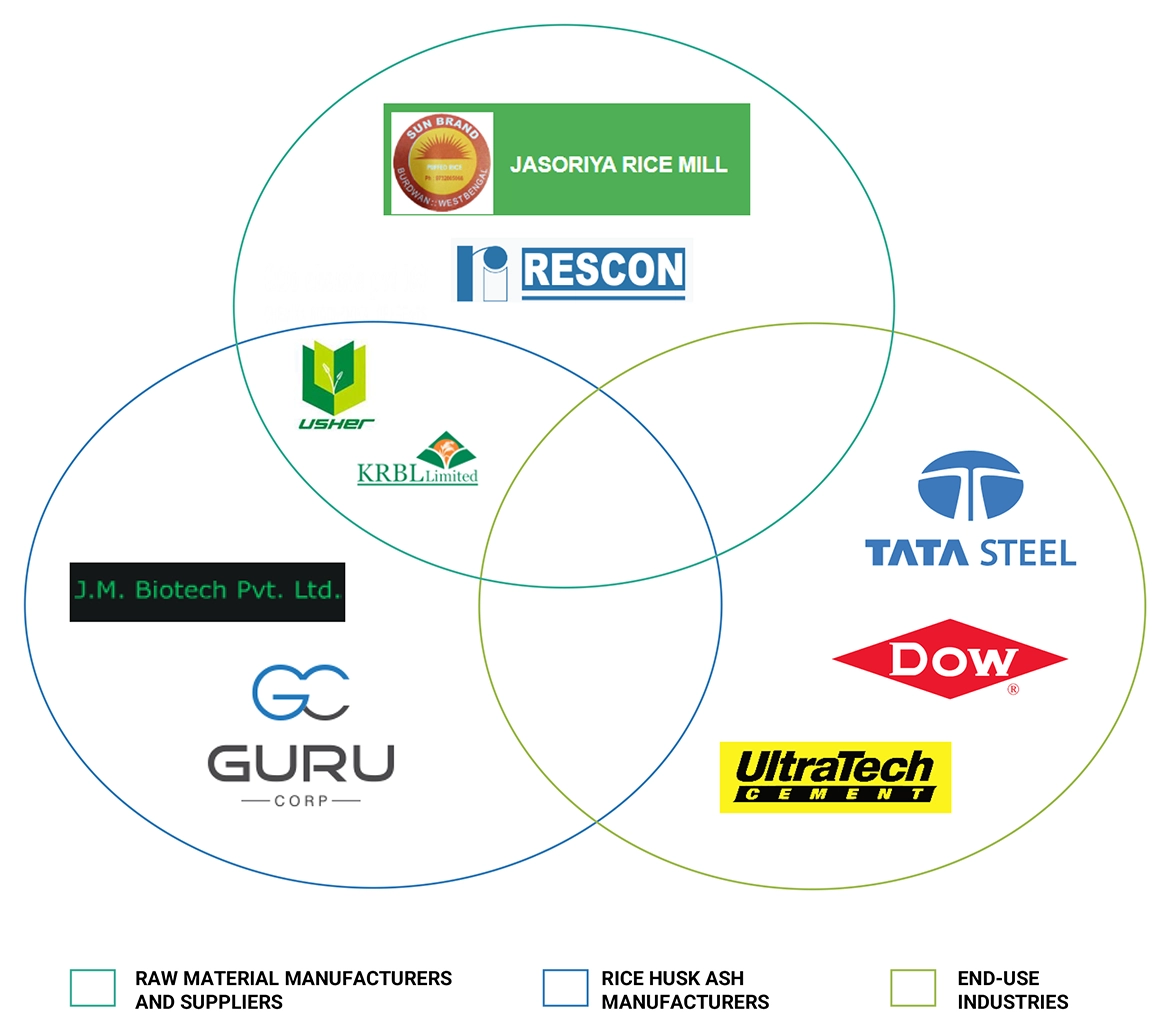
The rice husk ash market  comprises several stakeholders, such as such as raw material suppliers, technology support providers, rice husk ash market manufacturers, and regulatory organizations in the supply chain. Various primary sources from both the supply and demand sides of the market were interviewed to obtain qualitative and quantitative information. Primary sources from the supply side included industry experts such as Chief Executive Officers (CEOs), vice presidents, marketing directors, technology and innovation directors, and related key executives from various key companies and organizations operating in the rice husk ash market. Primary sources from the demand side included directors, marketing heads, and purchase managers from various sourcing industries. Following is the breakdown of the primary respondents:

Rice Husk Ash Market Size, and Share

To know about the assumptions considered for the study, download the pdf brochure

Market Size Estimation

Both the top-down and bottom-up approaches have been used to estimate and validate the total size of the Rice Husk Ash market market. These approaches have also been used extensively to estimate the size of various dependent subsegments of the market. The research methodology used to estimate the market size included the following:

The following segments provide details about the overall market size estimation process employed in this study

  • The key players in the market were identified through secondary research.
  • The market shares in the respective regions were identified through primary and secondary research.
  • The value chain and market size of the Rice Husk Ash market market, in terms of value, were determined through primary and secondary research.
  • All percentage shares, splits, and breakdowns were determined using secondary sources and verified through primary sources.
  • All possible parameters that affect the market covered in this research study were accounted for, viewed in extensive detail, verified through primary research, and analyzed to obtain the final quantitative and qualitative data.
  • The research included the study of annual and financial reports of the top market players and interviews with industry experts, such as CEOs, VPs, directors, sales managers, and marketing executives, for key insights, both quantitative and qualitative.

Global Rice Husk Ash market  Size: Bottom-Up Approach

Rice Husk Ash Market Size, and Share

To know about the assumptions considered for the study, Request for Free Sample Report

Global Rice Husk Ash Market  Size: Top-Down Approach

Rice Husk Ash Market Size, and Share

Data Triangulation

After arriving at the overall market size using the market size estimation processes as explained above, the market was split into several segments and sub-segments. To complete the overall market engineering process and arrive at the exact statistics of each market segment and subsegment, the data triangulation and market breakdown procedures were employed, wherever applicable. The data was triangulated by studying various factors and trends from both the demand and supply sides.

Market Definition

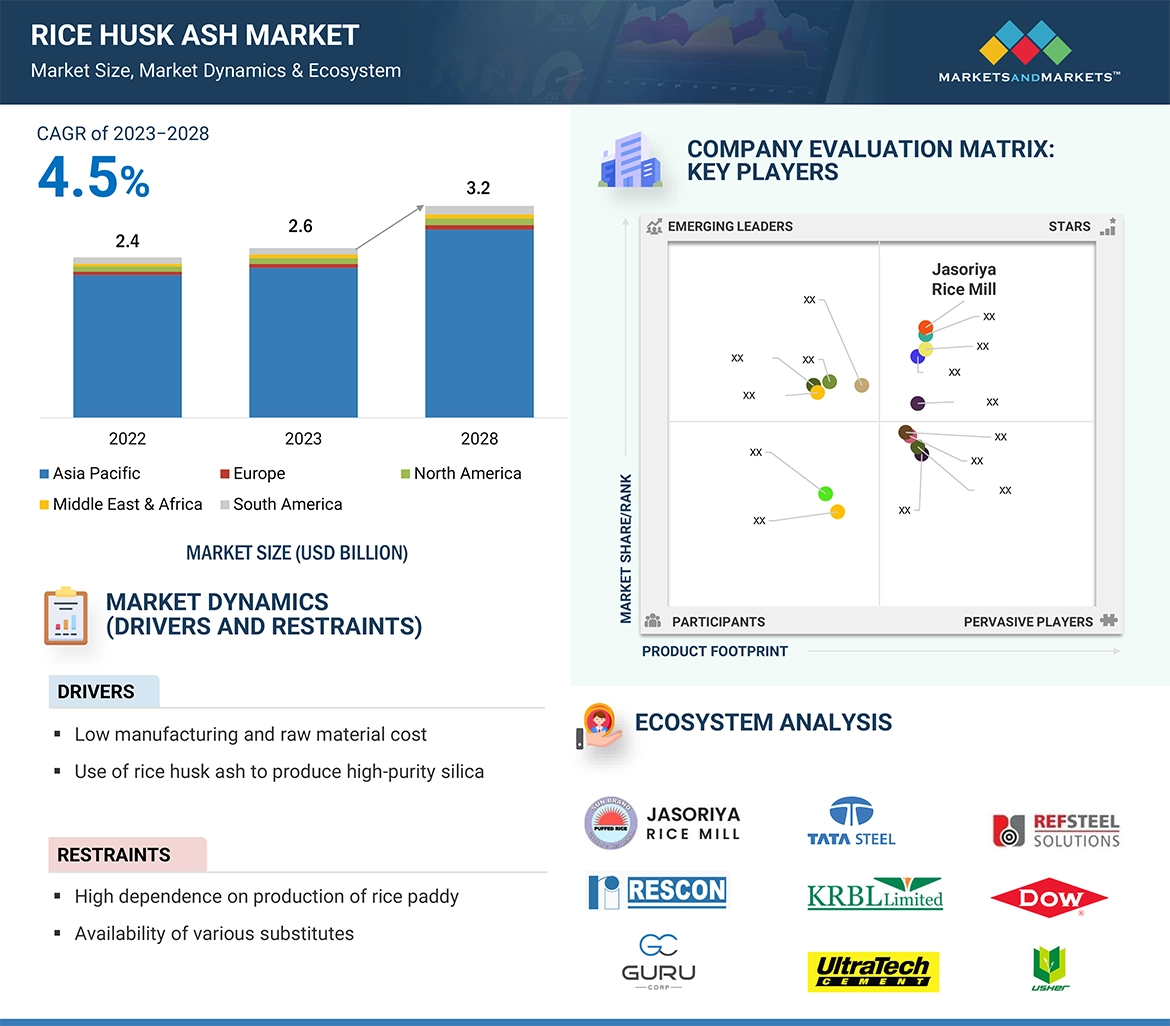
Rice husk ash (RHA) is a natural byproduct obtained from paddy rice during the rice husk processing phase. This husk is characterized by its composition, consisting of approximately 50% cellulose, 30% lignin, and 20% silica. Through a controlled thermal decomposition process, the husk is burned, transforming it into ash that predominantly comprises amorphous silica, ranging between 89-95%. During controlled thermal decomposition, the ash undergoes a transformation, turning into a highly pozzolanic material with an exceptionally large external surface relative to its weight.

Key Stakeholders

  • Raw material manufacturers
  • Technology support providers
  • Manufacturers of Rice Husk Ash market
  • Traders, distributors, and suppliers
  • Regulatory Bodies and Government Agencies
  • Research & Development (R&D) Institutions
  • End-use Industries
  • Consulting Firms, Trade Associations, and Industry Bodies
  • Investment Banks and Private Equity Firms

Report Objectives

  • To analyze and forecast the market size of Rice Husk Ash market in terms of value and volume
  • To provide detailed information regarding the major factors (drivers, restraints, challenges, and opportunities) influencing the regional market
  • To analyze and forecast the global Rice Husk Ash market on the basis of Product, Silica Content, Application, Process and Region
  • To analyze the opportunities in the market for stakeholders and provide details of a competitive landscape for market leaders
  • To forecast the size of various market segments based on five major regions: Asia Pacific, Europe, Middle East and Africa, South America and North America along with their respective key countries
  • To track and analyze the competitive developments, such as acquisitions, partnerships, collaborations, agreements and expansions in the market
  • To strategically profile the key players and comprehensively analyze their market shares and core competencies

Available Customizations

With the given market data, MarketsandMarkets offers customizations according to the client-specific needs.

The following customization options are available for the report:

  • Additional country-level analysis of the rice husk ash market
  • Profiling of additional market players (up to 5)

Product Analysis

  • Product matrix, which gives a detailed comparison of the product portfolio of each company.
Custom Market Research Services

We will customize the research for you, in case the report listed above does not meet with your exact requirements. Our custom research will comprehensively cover the business information you require to help you arrive at strategic and profitable business decisions.

Request Customization
Report Code
CH 4145
Published ON
Mar, 2024
Choose License Type
BUY NOW
  • SHARE
X
Request Customization
Speak to Analyst
Speak to Analyst
OR FACE-TO-FACE MEETING
PERSONALIZE THIS RESEARCH
  • Triangulate with your Own Data
  • Get Data as per your Format and Definition
  • Gain a Deeper Dive on a Specific Application, Geography, Customer or Competitor
  • Any level of Personalization
REQUEST A FREE CUSTOMIZATION
LET US HELP YOU!
  • What are the Known and Unknown Adjacencies Impacting the Rice Husk Ash Market
  • What will your New Revenue Sources be?
  • Who will be your Top Customer; what will make them switch?
  • Defend your Market Share or Win Competitors
  • Get a Scorecard for Target Partners
CUSTOMIZED WORKSHOP REQUEST
+1-888-600-6441
  • Call Us
  • +1-888-600-6441 (Corporate office hours)
  • +1-888-600-6441 (US/Can toll free)
  • +44-800-368-9399 (UK office hours)
CONNECT WITH US
ABOUT TRUST ONLINE
©2024 MarketsandMarkets Research Private Ltd. All rights reserved
DMCA.com Protection Status Website Feedback