Shredder Blades Market

Shredder Blades Market by Shaft Count (Single shaft, Double shaft), Blade Design (Hook, Square), End User Industry (Waste Management & Recycling, Food Industry), Application (Plastic, Rubber, Metal, Wood, E-waste) & Region - Global Forecast to 2028

Report Code: EP 8875 Dec, 2023, by marketsandmarkets.com

[178 Pages Report] The Shredder Blades market is expected to grow from an estimated USD 431 million in 2023 to USD 557 million by 2028, at a CAGR of 5.3% during the forecast period. The Shredder Blades market is expanding as a result of rising need for proper waste disposal and growing initiatives for recycling globally. Shredder Blades aid in shredding the waste form various end-uers industries and breaks down the material for further recycling.

Shredder Blades Market

To know about the assumptions considered for the study, Request for Free Sample Report

Shredder Blades Market Opportunities

To know about the assumptions considered for the study, download the pdf brochure

Shredder Blades Market Dynamics

Driver: Increasing recycling activities and rise in scrap industries

The scrap industry is a major contributor to the global economy, and recycling scrap is crucial for building nations and preserving natural resources. With the growth of urban populations, more countries invest in recycling, resulting in millions of tons of plastic, rubber, biomass, glass, metals, and wood being recycled worldwide. This presents a significant opportunity for the expansion of shredder blades and machines, which are used to shred old automobiles, appliances, and tires. Shredder machines are crucial for transforming scrap into valuable raw materials, and shredder blades play a pivotal role in this process. They enable efficient processing of scrap metal, plastics, and other materials, making them easier to transport, store, and reuse. The scrap industry's need for efficient and powerful shredder machines has increased the demand for advanced and efficient shredder blades, which help reduce trash volume. This not only conserves valuable resources but also reduces landfill waste.

Restraints: High costs associated with maintenance

The efficiency of a shredder depends heavily on the quality of its blades. Factors such as the angle of the knife edge, the material of the blade, the material being shredded, and maintenance all play crucial roles in determining the lifespan of shredder blades. High wear and tear, high temperatures, obstructions, and design defects can all decrease the life of shredder blades. Therefore, material, geometry, and manufacturing procedures should all be carefully considered during the production of shredder blades to ensure their quality and performance. Two common types of shredder blades include solid steel round blades and inlaid steel blades. The quality of the blade material is directly proportional to its hardness, wear resistance, and service life.

However, high-quality steel is only produced in a few countries, often resulting in a shortage of supplies and increased costs for manufacturing shredder blades. Moreover, shredder blades can be quite expensive to maintain. They are exposed to a significant amount of stress and regular maintenance is necessary to keep them functioning efficiently. Under typical usage, cutters, hammers, and blades will eventually wear out and require adjustments, sharpening, or replacement.

Opportunity: Growing demand to shred E-waste to destroy confidential data

The rising volume of electronic waste (E-waste) necessitates effective recycling solutions, driving the demand for shredder blades in the market. The application of dual shaft shredders for size reduction of WEEE (Waste Electrical and Electronic Equipment) contributes to the beginning stages of E-waste recycling systems, creating opportunities for tailored solutions. There is a growing demand to shred E-waste to destroy confidential data. Providing tailored and customized shredder blades according to the clients' needs will create newer opportunities for the shredder blade market. There are many governmental initiatives for e-waste collection. In India, the e-waste management rules mandated collection targets and transferred responsibilities to the producers of e-waste . In the United States, 25 states and the District of Columbia have enacted legislation establishing a statewide electronic waste recycling program. The Environmental Protection Agency (EPA) in the US has established the Federal Electronics Challenge to encourage federal agencies to participate in the national recycling infrastructure and procure electronic products that meet or exceed minimum performance criteria. Governments are increasingly focusing on e-waste management, with some enacting strong environmental protection laws and promoting extended producer responsibility (EPR) policies.

Protection of confidential information is of utmost importance for businesses. Shredding documents is a cost-effective way to ensure this protection. There are two ways in which cost advantages in shredding can be achieved: purchasing a shredder or hiring a third party to perform the shredding activities. When a company purchases a shredding machine, it provides cost advantages and boosts the market for shredder blades, as it will help increase volumes and frequency. Moreover, environmental regulations greatly influence the current practices and future opportunities for the pulp and paper industry.

Challenges: Requirement of precision engineering and high-quality materials

The manufacturing process of shredder blades involves precision engineering and the use of high-quality materials, which in turn leads to high initial investment costs. These blades are a crucial component of any shredding operation. Although the production process may vary, the production of high-quality shredder blades requires a significant investment upfront. This is due to the need for specific materials, precision engineering, and advanced production processes. The design and geometry of shredder blades are also crucial for optimal performance and efficiency. Developing blades that can handle various materials and shredding requirements requires extensive research and development, which further adds to the cost.

In order to ensure the longevity and efficiency of shredder blades, manufacturers may also need to invest in quality control procedures. Investing in well-made shredder blades can pay off in the long run by improving operational effectiveness and lowering maintenance costs, even after the initial investment.

Shredder Blades Market Ecosystem

Notable players in this industry comprise long-standing, financially robust manufacturers of shredder blades Market and related components. These companies have a significant track record in the market, offering a wide range of products, employing cutting-edge technologies, and maintaining robust global sales and marketing networks. Prominent companies in this market include SATURN MACHINE KNIVES LTD (UK), Miheu d.o.o. (Slovenia), KAMADUR industrial knives B.V (Netherlands), Fordura China (China), and WANROOE MACHINERY CO., LTD.  (China).

Shredder Blades Market Ecosystem

E-waste, is expected to be the second-largest market, based on type

E-waste is the fasyest growing segment of the shredder blades market for numerous reasons. As per EUROSTAT, E-waste stands out as one of the most rapidly expanding waste categories. Its volume surges by more than 5% annually, emerging as a primary reservoir of raw materials. This waste encompasses not just plastics and ferrous metals but also valuable elements like gold, silver, platinum, and rare earths, such as lanthanum and neodymium, facing substantial economic demand globally. with oil on a regular basis, they require less maintenance than liquid-filled transformers. Stringent regulations regarding the proper disposal and recycling of electronic waste have led to an increased adoption of e-waste shredders by organizations to comply with legal requirements.

Software solutions, by component, to hold the fastest growing market share during the forecast period

The software solutions segment is the fastest growing segment of the Shredder Bladesmarket because it offers various advantages over hardware solutions. Software solutions are more adaptable and scalable, and they can be tailored to each utility's unique requirements. Furthermore, software solutions are less expensive to deploy and maintain than hardware ones. Furthermore, software solutions offer more functionality than hardware solutions, such as real-time data visualisation, analytics, and reporting. These characteristics assist utilities better understand the health and performance of their transformers, allowing them to identify and rectify problems before they create outages.

Asia Pacific is expected to be the fastest market during the forecast period.

The region's rapid urbanization and industrialization, coupled with massive technological advancements is making Asia Pacific the fastest growing region for shredder blades. China is Asia Pacific’s largest market, owing to the strong presence of shredder blades manufacturers and country’s focus on waste management and recycling. With a substantial industrial presence, particularly in countries like China and India, there is a surging demand for shredder blades. This demand is fueled by rapid industrialization and urbanization, contributing to the effective management of escalating volumes of waste and recyclable materials.

Asia Pacific Shredder Blades Market Size, and Share

Key Market Players

The Shredder blades market is dominated by a few major players that have a wide regional presence. The major players in the Shredder blades market are SATURN MACHINE KNIVES LTD (UK), Miheu d.o.o. (Slovenia), KAMADUR industrial knives B.V (Netherlands), Fordura China (China), and WANROOE MACHINERY CO., LTD.  (China).

Get online access to the report on the World's First Market Intelligence Cloud

  • Easy to Download Historical Data & Forecast Numbers
  • Company Analysis Dashboard for high growth potential opportunities
  • Research Analyst Access for customization & queries
  • Competitor Analysis with Interactive dashboard
  • Latest News, Updates & Trend analysis
Request Sample

Scope of the Report

Report Metric

Details

Market size available for years

2021–2028

Base year considered

2022

Forecast period

2023–2028

Forecast units

Value (USD)

Segments covered

Blade material, Blade design, shaft count, applications, end-user industries, and region

Geographies covered

Asia Pacific, North America, Europe, Middle East & Africa, and South America

Companies covered

SATURN MACHINE KNIVES LTD (UK), Miheu d.o.o. (Slovenia), KAMADUR industrial knives B.V (Netherlands), Fordura China (China), and WANROOE MACHINERY CO., LTD.  (China), Povelato srl (Italy), BKS Knives (Belgium), Servo International (India), Anhui Yafei Machine Tool Co. Ltd (China), Fernite Of Sheffield Ltd. (UK), and Nanjing Huaxin Machinery Tool Manufacturing Co., Ltd. (China) among others.

This research report categorizes the Shredder blades market by component, type, services, voltage, application, and region

On the basis of Blade material, the Shredder blades market has been segmented as follows:
  • Carburizing Steel
  • Tool Steel
  • Case Hardened
  • Chromium Low Alloy Steel
On the basis of blade design, the Shredder blades market has been segmented as follows:
  • Hook
  • Square
On the basis of shaft count, the Shredder blades market has been segmented as follows:
  • Single Shaft
  • Double Shaft
  • Other Shafts
On the basis of by application, the Shredder blades market has been segmented as follows:
  • Plastic
  • Rubber
  • Metals
  • Wood
  • E-waste
  • Paper & Cardboard
  • Other Applications
On the basis of by end-user industries, the Shredder blades market has been segmented as follows:
  • Waste Management & Recycling
  • Food
  • Pharmaceuticals
  • Other End-use Industries
On the basis of region, the Shredder blades market has been segmented as follows:
  • Asia Pacific
  • Europe
  • North America
  • Middle East & Africa
  • South America

Frequently Asked Questions (FAQ):

To speak to our analyst for a discussion on the above findings, click Speak to Analyst

TABLE OF CONTENTS
 
1 INTRODUCTION (Page No. - 24)
    1.1 STUDY OBJECTIVES 
    1.2 MARKET DEFINITION 
           1.2.1 INCLUSIONS AND EXCLUSIONS
    1.3 STUDY SCOPE 
           1.3.1 MARKETS COVERED
                    FIGURE 1 SHREDDER BLADES MARKET: SEGMENTATION
           1.3.2 REGIONAL SCOPE
           1.3.3 YEARS CONSIDERED
    1.4 CURRENCY CONSIDERED 
    1.5 UNIT CONSIDERED 
    1.6 LIMITATIONS 
    1.7 STAKEHOLDERS 
    1.8 IMPACT OF RECESSION 
 
2 RESEARCH METHODOLOGY (Page No. - 29)
    2.1 RESEARCH APPROACH 
           FIGURE 2 SHREDDER BLADES MARKET: RESEARCH DESIGN
    2.2 DATA TRIANGULATION 
           FIGURE 3 DATA TRIANGULATION
           2.2.1 SECONDARY DATA
                    2.2.1.1 List of major secondary sources
                    2.2.1.2 Key data from secondary sources
           2.2.2 PRIMARY DATA
                    2.2.2.1 List of key interview participants
                    2.2.2.2 Key data from primary sources
                    2.2.2.3 Key industry insights
                    2.2.2.4 Breakdown of primaries
    2.3 MARKET SIZE ESTIMATION 
           2.3.1 BOTTOM-UP APPROACH
                    FIGURE 4 MARKET SIZE ESTIMATION METHODOLOGY: BOTTOM-UP APPROACH
           2.3.2 TOP-DOWN APPROACH
                    FIGURE 5 SHREDDER BLADES MARKET: TOP-DOWN APPROACH
           2.3.3 DEMAND-SIDE ANALYSIS
                    FIGURE 6 MAIN METRICS CONSIDERED TO ANALYZE DEMAND FOR SHREDDER BLADES
                    2.3.3.1 Demand-side metrics
                               FIGURE 7 DEMAND-SIDE ANALYSIS
                               2.3.3.1.1 Demand-side assumptions
                               2.3.3.1.2 Demand-side calculations
           2.3.4 SUPPLY-SIDE ANALYSIS
                    FIGURE 8 KEY METRICS CONSIDERED TO ASSESS SUPPLY OF SHREDDER BLADES
                    FIGURE 9 SHREDDER BLADES MARKET SUPPLY-SIDE ANALYSIS
                    2.3.4.1 Supply-side assumptions
                    2.3.4.2 Supply-side calculations
           2.3.5 FORECAST
                    2.3.5.1 Risk assessment
                    2.3.5.2 Recession impact
 
3 EXECUTIVE SUMMARY (Page No. - 40)
    TABLE 1 SHREDDER BLADES MARKET SNAPSHOT 
    FIGURE 10 HOOK SEGMENT TO DISPLAY HIGHEST CAGR DURING FORECAST PERIOD 
    FIGURE 11 DOUBLE SHAFT SEGMENT TO DOMINATE MARKET FROM 2023 TO 2028 
    FIGURE 12 PLASTIC SEGMENT TO LEAD MARKET DURING FORECAST PERIOD 
    FIGURE 13 WASTE MANAGEMENT & RECYCLING SEGMENT TO COMMAND MARKET THROUGHOUT FORECAST PERIOD 
    FIGURE 14 EUROPE DOMINATED GLOBAL SHREDDER BLADES MARKET IN 2022 
 
4 PREMIUM INSIGHTS (Page No. - 44)
    4.1 ATTRACTIVE OPPORTUNITIES FOR PLAYERS IN SHREDDER BLADES MARKET 
           FIGURE 15 TECHNOLOGICAL DEVELOPMENTS AND STRINGENT GOVERNMENT REGULATIONS FOR SHREDDER BLADES TO DRIVE MARKET
    4.2 SHREDDER BLADES MARKET, BY BLADE DESIGN 
           FIGURE 16 HOOK SEGMENT DOMINATED MARKET IN 2022
    4.3 SHREDDER BLADES MARKET, BY END-USER INDUSTRY 
           FIGURE 17 WASTE MANAGEMENT & RECYCLING INDUSTRY LED MARKET IN 2022
    4.4 SHREDDER BLADES MARKET, BY SHAFT TYPE 
           FIGURE 18 DOUBLE SHAFT SEGMENT SECURED LARGEST MARKET SHARE IN 2022
    4.5 SHREDDER BLADES MARKET, BY APPLICATION 
           FIGURE 19 PLASTIC SEGMENT CLAIMED LARGEST MARKET SHARE IN 2022
           FIGURE 20 ASIA PACIFIC TO REGISTER HIGHEST CAGR DURING FORECAST PERIOD
    4.6 SHREDDER BLADES MARKET IN EUROPE,  BY SHAFT TYPE AND COUNTRY 
           FIGURE 21 DOUBLE SHAFT SEGMENT & GERMANY TO DOMINATE EUROPEAN SHREDDER BLADES MARKET IN 2022
 
5 MARKET OVERVIEW (Page No. - 48)
    5.1 INTRODUCTION 
    5.2 MARKET DYNAMICS 
           FIGURE 22 SHREDDER BLADES MARKET: DRIVERS, RESTRAINTS, OPPORTUNITIES,  AND CHALLENGES
           5.2.1 DRIVERS
                    5.2.1.1 Growing demand from manufacturing, paper, and automotive industries
                    5.2.1.2 Booming scrap recycling industry
           5.2.2 RESTRAINTS
                    5.2.2.1 High maintenance costs of shredding solutions
           5.2.3 OPPORTUNITIES
                    5.2.3.1 Growing demand for E-waste shredding to destroy confidential data
                    5.2.3.2 Increasing focus on green entrepreneurship
           5.2.4 CHALLENGES
                    5.2.4.1 Need for ultra-precision engineering and high-quality materials
                    5.2.4.2 Noise pollution during shredding operations
    5.3 TRENDS/DISRUPTIONS IMPACTING CUSTOMERS’ BUSINESSES 
           FIGURE 23 TRENDS/DISRUPTIONS IMPACTING CUSTOMERS’ BUSINESSES
    5.4 ECOSYSTEM/MARKET MAP 
    5.5 SUPPLY CHAIN ANALYSIS 
           FIGURE 24 SUPPLY CHAIN ANALYSIS: SHREDDER BLADES MARKET
    5.6 ECOSYSTEM ANALYSIS 
           TABLE 2 COMPANIES AND THEIR ROLES IN SHREDDER BLADES ECOSYSTEM
    5.7 REGULATORY LANDSCAPE AND STANDARDS 
           5.7.1 STANDARDS
           5.7.2 REGULATORY BODIES, GOVERNMENT AGENCIES, AND OTHER ORGANIZATIONS
                    TABLE 3 NORTH AMERICA: LIST OF REGULATORY BODIES, GOVERNMENT AGENCIES, AND OTHER ORGANIZATIONS
                    TABLE 4 EUROPE: LIST OF REGULATORY BODIES, GOVERNMENT AGENCIES, AND OTHER ORGANIZATIONS
                    TABLE 5 ASIA PACIFIC: LIST OF REGULATORY BODIES, GOVERNMENT AGENCIES, AND OTHER ORGANIZATIONS
                    TABLE 6 MIDDLE EAST & AFRICA: LIST OF REGULATORY BODIES, GOVERNMENT AGENCIES,  AND OTHER ORGANIZATIONS
                    TABLE 7 SOUTH AMERICA: LIST OF REGULATORY BODIES, GOVERNMENT AGENCIES, AND OTHER ORGANIZATIONS
    5.8 TRADE ANALYSIS 
           5.8.1 HS CODE 8208
           5.8.2 EXPORT SCENARIO
                    TABLE 8 EXPORT DATA FOR HS CODE 8208–COMPLIANT PRODUCTS, BY COUNTRY,  2020–2022 (USD THOUSAND)
                    FIGURE 25 EXPORT DATA FOR TOP FIVE COUNTRIES, 2020–2022 (USD THOUSAND)
           5.8.3 IMPORT SCENARIO
                    TABLE 9 IMPORT SCENARIO FOR HS CODE 8208-COMPLIANT PRODUCTS, BY COUNTRY,  2020–2022 (USD THOUSAND)
                    FIGURE 26 IMPORT DATA FOR TOP FIVE COUNTRIES, 2020–2022 (USD THOUSAND)
    5.9 PORTER’S FIVE FORCES ANALYSIS 
           FIGURE 27 SHREDDER BLADES MARKET: PORTER’S FIVE FORCES ANALYSIS
           TABLE 10 SHREDDER BLADES MARKET: PORTER’S FIVE FORCES ANALYSIS
           5.9.1 THREAT OF SUBSTITUTES
           5.9.2 BARGAINING POWER OF SUPPLIERS
           5.9.3 BARGAINING POWER OF BUYERS
           5.9.4 THREAT OF NEW ENTRANTS
           5.9.5 INTENSITY OF COMPETITIVE RIVALRY
    5.10 PATENT ANALYSIS, 2018–2022 
           FIGURE 28 PATENT ANALYSIS IN SHREDDER BLADES MARKET, 2013–2022
           TABLE 11 SHREDDER BLADES MARKET: LIST OF PATENTS, 2018–2022
    5.11 CASE STUDY ANALYSIS 
           5.11.1 SSI SHREDDING SYSTEMS (US) PROVIDES PITBULL BLADE DEMOLITION WITH DUAL-SHEAR M120 SHREDDER TO RECYCLE WIND TURBINE BLADES
           5.11.2 GAS AUTOMAZIONI S.R.L. (ITALY) LOWERS ENERGY COSTS BY USING OPTIDRIVE P2 VARIABLE FREQUENCY DRIVE (VFD) INTO SHREDDING PROCESS
           5.11.3 WELDING ALLOYS (THAILAND) INTEGRATES COPPER-COATED TUBULAR WIRE FROM ROBODUR RANGE OF CONSUMABLES TO BOOST OPERATIONAL EFFICIENCY
    5.12 TECHNOLOGY ANALYSIS 
           5.12.1 AI-POWERED SHREDDERS
    5.13 PRICING ANALYSIS 
           5.13.1 AVERAGE SELLING PRICE (ASP) TREND OF SHREDDER BLADES,  BY REGION
                    FIGURE 29 AVERAGE SELLING PRICE (ASP) TREND OF SHREDDER BLADES, BY REGION
           5.13.2 AVERAGE SELLING PRICE (ASP) TREND OF SHREDDER BLADES,  BY APPLICATION, 2022
                    TABLE 12 AVERAGE SELLING PRICE (ASP) TREND OF SHREDDER BLADES, BY APPLICATION, 2022
    5.14 KEY STAKEHOLDERS AND BUYING CRITERIA 
           5.14.1 KEY STAKEHOLDERS IN BUYING PROCESS
                    FIGURE 30 KEY STAKEHOLDERS IN BUYING PROCESS FOR TOP THREE END-USER INDUSTRIES
                    TABLE 13 INFLUENCE OF STAKEHOLDERS ON BUYING PROCESS FOR TOP THREE END-USER INDUSTRIES
           5.14.2 BUYING CRITERIA
                    FIGURE 31 KEY BUYING CRITERIA FOR TOP THREE END-USER INDUSTRIES
                    TABLE 14 KEY BUYING CRITERIA FOR TOP THREE END-USER INDUSTRIES
    5.15 KEY CONFERENCES AND EVENTS, 2023–2024 
                    TABLE 15 SHREDDER BLADES MARKET: LIST OF CONFERENCES AND EVENTS, 2023–2024
 
6 SHREDDER BLADES MARKET, BY BLADE MATERIAL (Page No. - 68)
    6.1 INTRODUCTION 
    6.2 CARBURIZING STEEL 
           6.2.1 INCREASED MANUFACTURING OF SINGLE-AND DOUBLE-SHAFT SHREDDER BLADES TO BOOST DEMAND
    6.3 TOOL STEEL 
           6.3.1 EXPANDING RECYCLING INDUSTRY TO FACILITATE DEMAND
    6.4 CASE HARDENED 
           6.4.1 IMPROVED EFFICIENCY AND COST-EFFECTIVENESS FEATURES TO BOOST ADOPTION IN VARIOUS APPLICATIONS
    6.5 CHROMIUM LOW ALLOY STEEL 
           6.5.1 ABILITY TO PROVIDE CORROSION RESISTANCE AND HARDNESS FOR KNIFE BLADES TO DRIVE MARKET
 
7 SHREDDER BLADES MARKET, BY BLADE DESIGN (Page No. - 70)
    7.1 INTRODUCTION 
           FIGURE 32 SHREDDER BLADES MARKET SHARE, BY BLADE DESIGN, 2022
           TABLE 16 SHREDDER BLADES MARKET, BY BLADE DESIGN, 2021–2028 (USD MILLION)
    7.2 SQUARE 
           7.2.1 ABILITY TO SHRED DENSE AND SOLID MATERIALS EFFECTIVELY TO BOOST DEMAND
                    TABLE 17 SQUARE: SHREDDER BLADES MARKET, BY REGION, 2021–2028 (USD MILLION)
    7.3 HOOK 
           7.3.1 VERSATILITY IN PROCESSING METAL AND PLASTIC, E-WASTE TO FOSTER SEGMENTAL GROWTH
                    TABLE 18 HOOK: SHREDDER BLADES MARKET, BY REGION, 2021–2028 (USD MILLION)
 
8 SHREDDER BLADES MARKET, BY SHAFT COUNT (Page No. - 74)
    8.1 INTRODUCTION 
           FIGURE 33 SHREDDER BLADES MARKET SHARE, BY SHAFT COUNT, 2022
           TABLE 19 SHREDDER BLADES MARKET, BY SHAFT COUNT, 2021–2028 (USD MILLION)
    8.2 SINGLE SHAFT 
           8.2.1 MINIMAL ENERGY CONSUMPTION TO BOOST DEMAND
                    TABLE 20 SINGLE SHAFT: SHREDDER BLADES MARKET, BY REGION, 2021–2028 (USD MILLION)
    8.3 DOUBLE SHAFT 
           8.3.1 LESS DUST AND HEAT GENERATION BY DOUBLE-SHAFT SHREDDERS TO ACCELERATE DEMAND
                    TABLE 21 DOUBLE SHAFT: SHREDDER BLADES MARKET, BY REGION, 2021–2028 (USD MILLION)
    8.4 OTHER SHAFTS 
           TABLE 22 OTHER SHAFTS: SHREDDER BLADES MARKET, BY REGION, 2021–2028 (USD MILLION)
 
9 SHREDDER BLADES MARKET, BY APPLICATION (Page No. - 78)
    9.1 INTRODUCTION 
           FIGURE 34 SHREDDER BLADES MARKET, BY APPLICATION, 2023–2028
           TABLE 23 SHREDDER BLADES MARKET, BY APPLICATION, 2021–2028 (USD MILLION)
    9.2 PLASTIC 
           9.2.1 INCREASING DEMAND FROM TEXTILES AND AUTOMOTIVE MANUFACTURING INDUSTRIES TO DRIVE MARKET
                    TABLE 24 PLASTIC: SHREDDER BLADES MARKET, BY REGION, 2021–2028 (USD MILLION)
    9.3 RUBBER 
           9.3.1 GROWING AWARENESS OF RUBBER RECYCLING TO OFFER GROWTH OPPORTUNITIES FOR PLAYERS
                    TABLE 25 RUBBER: SHREDDER BLADES MARKET, BY REGION, 2021–2028 (USD MILLION)
    9.4 METALS 
           9.4.1 BOOMING STEEL SCRAP INDUSTRY TO PROPEL DEMAND
                    TABLE 26 METAL: SHREDDER BLADES MARKET, BY REGION, 2021–2028 (USD MILLION)
    9.5 WOOD 
           9.5.1 INCREASING RECYCLING OF WOOD TO DRIVE MARKET
                    TABLE 27 WOOD: SHREDDER BLADES MARKET, BY REGION, 2021–2028 (USD MILLION)
    9.6 E-WASTE 
           9.6.1 STRINGENT REGULATIONS FOR DISPOSAL AND RECYCLING OF E-WASTE TO FUEL MARKET GROWTH
                    TABLE 28 E-WASTE: SHREDDER BLADES MARKET, BY REGION, 2021–2028 (USD MILLION)
    9.7 PAPER & CARDBOARD 
           9.7.1 NEED TO DISPOSE CONFIDENTIAL DOCUMENTS SECURELY TO DRIVE MARKET
                    TABLE 29 PAPER & CARDBOARD: SHREDDER BLADES MARKET, BY REGION,  2021–2028 (USD MILLION)
    9.8 OTHER APPLICATIONS 
           TABLE 30 OTHER APPLICATIONS: SHREDDER BLADES MARKET, BY REGION,  2021–2028 (USD MILLION)
 
10 SHREDDER BLADES MARKET, BY END-USER INDUSTRY (Page No. - 87)
     10.1 INTRODUCTION 
               FIGURE 35 SHREDDER BLADES MARKET SHARE, BY END-USER INDUSTRY, 2022
               TABLE 31 SHREDDER BLADES MARKET, BY END-USER INDUSTRY, 2021–2028 (USD MILLION)
     10.2 WASTE MANAGEMENT & RECYCLING 
             10.2.1 INTEGRATION OF MODERN RECYCLING SOLUTIONS TO IMPROVE OPERATIONAL EFFICIENCY TO DRIVE MARKET
                       10.2.1.1 Municipal solid waste
                       10.2.1.2 Hazardous waste
                       10.2.1.3 Scrap & recycle
                                   TABLE 32 WASTE MANAGEMENT & RECYCLING: SHREDDER BLADES MARKET, BY REGION,  2021–2028 (USD MILLION)
     10.3 FOOD 
             10.3.1 DECREASED TRANSPORTATION AND DISPOSAL COSTS TO BOOST DEMAND
                       TABLE 33 FOOD: SHREDDER BLADES MARKET, BY REGION, 2021–2028 (USD MILLION)
     10.4 PHARMACEUTICALS 
             10.4.1 SAFE HANDLING AND DISPOSAL OF HAZARDOUS PHARMACEUTICAL WASTE TO DRIVE MARKET
                       TABLE 34 PHARMACEUTICALS: SHREDDER BLADES MARKET, BY REGION,  2021–2028 (USD MILLION)
     10.5 OTHER END-USER INDUSTRIES 
               TABLE 35 OTHER END-USER INDUSTRIES: SHREDDER BLADES MARKET, BY REGION,  2021–2028 (USD MILLION)
 
11 SHREDDER BLADES MARKET, BY REGION (Page No. - 93)
     11.1 INTRODUCTION 
               FIGURE 36 ASIA PACIFIC TO REGISTER HIGHEST CAGR DURING FORECAST PERIOD
               FIGURE 37 SHREDDER BLADES MARKET, BY REGION
               TABLE 36 SHREDDER BLADES MARKET, BY REGION, 2021–2028 (USD MILLION)
               TABLE 37 SHREDDER BLADES MARKET, BY REGION, 2021–2028 (THOUSAND UNIT)
     11.2 ASIA PACIFIC 
             11.2.1 RECESSION IMPACT ON MARKET IN ASIA PACIFIC
                       FIGURE 38 ASIA PACIFIC: SHREDDER BLADES MARKET SNAPSHOT
                       TABLE 38 ASIA PACIFIC: SHREDDER BLADES MARKET, BY COUNTRY, 2021–2028 (USD MILLION)
                       TABLE 39 ASIA PACIFIC: SHREDDER BLADES MARKET, BY BLADE DESIGN,  2021–2028 (USD MILLION)
                       TABLE 40 ASIA PACIFIC: SHREDDER BLADES MARKET, BY SHAFT COUNT,  2021–2028 (USD MILLION)
                       TABLE 41 ASIA PACIFIC: SHREDDER BLADES MARKET, BY APPLICATION,  2021–2028 (USD MILLION)
                       TABLE 42 ASIA PACIFIC: SHREDDER BLADES MARKET, BY END-USER INDUSTRY,  2021–2028 (USD MILLION)
                       11.2.1.1 China
                                   11.2.1.1.1 Legal prohibition of plastic imports in country to boost market
                                   TABLE 43 CHINA: SHREDDER BLADES MARKET, BY END-USER INDUSTRY,  2021–2028 (USD MILLION)
                       11.2.1.2 India
                                   11.2.1.2.1 Pressing need to dispose e-waste safely to fuel market growth
                                   TABLE 44 INDIA: SHREDDER BLADES MARKET, BY END-USER INDUSTRY,  2021–2028 (USD MILLION)
                       11.2.1.3 Japan
                                   11.2.1.3.1 Strict waste separation and recycling laws to boost market
                                   TABLE 45 JAPAN: SHREDDER BLADES MARKET, BY END-USER INDUSTRY,  2021–2028 (USD MILLION)
                       11.2.1.4 South Korea
                                   11.2.1.4.1 Technological advancements to manage waste efficiently to fuel market growth
                                   TABLE 46 SOUTH KOREA: SHREDDER BLADES MARKET, BY END-USER INDUSTRY,  2021–2028 (USD MILLION)
                       11.2.1.5 Rest of Asia Pacific
                                   TABLE 47 REST OF ASIA PACIFIC: SHREDDER BLADES MARKET, BY END-USER INDUSTRY,  2021–2028 (USD MILLION)
     11.3 EUROPE 
             11.3.1 RECESSION IMPACT ON MARKET IN EUROPE
                       FIGURE 39 EUROPE: SHREDDER BLADES MARKET SNAPSHOT
                       TABLE 48 EUROPE: SHREDDER BLADES MARKET, BY COUNTRY, 2021–2028 (USD MILLION)
                       TABLE 49 EUROPE: SHREDDER BLADES MARKET, BY BLADE DESIGN, 2021–2028 (USD MILLION)
                       TABLE 50 EUROPE: SHREDDER BLADES MARKET, BY SHAFT COUNT, 2021–2028 (USD MILLION)
                       TABLE 51 EUROPE: SHREDDER BLADES MARKET, BY APPLICATION, 2021–2028 (USD MILLION)
                       TABLE 52 EUROPE: SHREDDER BLADES MARKET, BY END-USER INDUSTRY,  2021–2028 (USD MILLION)
                       11.3.1.1 Germany
                                   11.3.1.1.1 Established automobile recycling industry to drive market
                                   TABLE 53 GERMANY: SHREDDER BLADES MARKET, BY END-USER INDUSTRY,  2021–2028 (USD MILLION)
                       11.3.1.2 Italy
                                   11.3.1.2.1 Growing waste management and recycling initiatives to contribute to market growth
                                   TABLE 54 ITALY: SHREDDER BLADES MARKET, BY END-USER INDUSTRY,  2021–2028 (USD MILLION)
                       11.3.1.3 France
                                   11.3.1.3.1 Strong emphasis on reducing landfill waste and achieving circular economy to fuel market growth
                                   TABLE 55 FRANCE: SHREDDER BLADES MARKET, BY END-USER INDUSTRY,  2021–2028 (USD MILLION)
                       11.3.1.4 UK
                                   11.3.1.4.1 Growing demand for recycled metal across industries to accelerate demand
                                   TABLE 56 UK: SHREDDER BLADES MARKET, BY END-USER INDUSTRY, 2021–2028 (USD MILLION)
                       11.3.1.5 Rest of Europe
                                   TABLE 57 REST OF EUROPE: SHREDDER BLADES MARKET, BY END-USER INDUSTRY,  2021–2028 (USD MILLION)
     11.4 NORTH AMERICA 
             11.4.1 RECESSION IMPACT ON MARKET IN NORTH AMERICA
                       TABLE 58 NORTH AMERICA: SHREDDER BLADES MARKET, BY COUNTRY,  2021–2028 (USD MILLION)
                       TABLE 59 NORTH AMERICA: SHREDDER BLADES MARKET, BY BLADE DESIGN,  2021–2028 (USD MILLION)
                       TABLE 60 NORTH AMERICA: SHREDDER BLADES MARKET, BY SHAFT COUNT,  2021–2028 (USD MILLION)
                       TABLE 61 NORTH AMERICA: SHREDDER BLADES MARKET, BY APPLICATION,  2021–2028 (USD MILLION)
                       TABLE 62 NORTH AMERICA: SHREDDER BLADES MARKET, BY END-USER INDUSTRY,  2021–2028 (USD MILLION)
                       11.4.1.1 US
                                   11.4.1.1.1 Increasing demand for effective waste management solutions to support market growth
                                   TABLE 63 US: SHREDDER BLADES MARKET, BY END-USER INDUSTRY, 2021–2028 (USD MILLION)
                       11.4.1.2 Canada
                                   11.4.1.2.1 Government-led initiatives supporting recycling industry to drive market
                                   TABLE 64 CANADA: SHREDDER BLADES MARKET, BY END-USER INDUSTRY,  2021–2028 (USD MILLION)
                       11.4.1.3 Mexico
                                   11.4.1.3.1 Waste production by manufacturing firms and healthcare organizations to boost demand
                                   TABLE 65 MEXICO: SHREDDER BLADES MARKET, BY END-USER INDUSTRY,  2021–2028 (USD MILLION)
     11.5 SOUTH AMERICA 
             11.5.1 RECESSION IMPACT ON MARKET IN SOUTH AMERICA
                       TABLE 66 SOUTH AMERICA: SHREDDER BLADES MARKET, BY COUNTRY,  2021–2028 (USD MILLION)
                       TABLE 67 SOUTH AMERICA: SHREDDER BLADES MARKET, BY BLADE DESIGN,  2021–2028 (USD MILLION)
                       TABLE 68 SOUTH AMERICA: SHREDDER BLADES MARKET, BY SHAFT COUNT,  2021–2028 (USD MILLION)
                       TABLE 69 SOUTH AMERICA: SHREDDER BLADES MARKET, BY APPLICATION,  2021–2028 (USD MILLION)
                       TABLE 70 SOUTH AMERICA: SHREDDER BLADES MARKET, BY END-USER INDUSTRY,  2021–2028 (USD MILLION)
                       11.5.1.1 Brazil
                                   11.5.1.1.1 Government-led initiatives to encourage recycling to drive market
                                   TABLE 71 BRAZIL: SHREDDER BLADES MARKET, BY END-USER INDUSTRY,  2021–2028 (USD MILLION)
                       11.5.1.2 Argentina
                                   11.5.1.2.1 Rising environmental awareness among people to drive market
                                   TABLE 72 ARGENTINA: SHREDDER BLADES MARKET, BY END-USER INDUSTRY,  2021–2028 (USD MILLION)
             11.5.2 REST OF SOUTH AMERICA
                       TABLE 73 REST OF SOUTH AMERICA: SHREDDER BLADES MARKET, BY END-USER INDUSTRY, 2021–2028 (USD MILLION)
     11.6 MIDDLE EAST & AFRICA 
             11.6.1 RECESSION IMPACT ON MARKET IN MIDDLE EAST & AFRICA
                       TABLE 74 MIDDLE EAST & AFRICA: SHREDDER BLADES MARKET, BY COUNTRY,  2021–2028 (USD MILLION)
                       TABLE 75 MIDDLE EAST & AFRICA: SHREDDER BLADES MARKET, BY BLADE DESIGN,  2021–2028 (USD MILLION)
                       TABLE 76 MIDDLE EAST & AFRICA: SHREDDER BLADES MARKET, BY SHAFT COUNT,  2021–2028 (USD MILLION)
                       TABLE 77 MIDDLE EAST & AFRICA: SHREDDER BLADES MARKET, BY APPLICATION,  2021–2028 (USD MILLION)
                       TABLE 78 MIDDLE EAST & AFRICA: SHREDDER BLADES MARKET, BY END-USER INDUSTRY,  2021–2028 (USD MILLION)
                       11.6.1.1 Saudi Arabia
                                   11.6.1.1.1 Widespread use of single-use plastics to boost demand for efficient waste management
                                   TABLE 79 SAUDI ARABIA: SHREDDER BLADES MARKET, BY END-USER INDUSTRY,  2021–2028 (USD MILLION)
                       11.6.1.2 UAE
                                   11.6.1.2.1 Increased international investments due to strategic location and advanced infrastructure to fuel market growth
                                   TABLE 80 UAE: SHREDDER BLADES MARKET, BY END-USER INDUSTRY, 2021–2028 (USD MILLION)
                       11.6.1.3 Kuwait
                                   11.6.1.3.1 Government-led initiatives to encourage establishment of waste recycling factories to drive market
                                   TABLE 81 KUWAIT: SHREDDER BLADES MARKET, BY END-USER INDUSTRY,  2021–2028 (USD MILLION)
                       11.6.1.4 Qatar
                                   11.6.1.4.1 Integration of AI into sorting and recycling processes to offer lucrative growth opportunities to players
                                   TABLE 82 QATAR: SHREDDER BLADES MARKET, BY END-USER INDUSTRY,  2021–2028 (USD MILLION)
                       11.6.1.5 Rest of GCC countries
                                   TABLE 83 REST OF GCC COUNTRIES: SHREDDER BLADES MARKET, BY END-USER INDUSTRY,  2021–2028 (USD MILLION)
                       11.6.1.6 South Africa
                                   11.6.1.6.1 Growing demand for scrap metals from private sector to drive market
                                   TABLE 84 SOUTH AFRICA: SHREDDER BLADES MARKET, BY END-USER INDUSTRY,  2021–2028 (USD MILLION)
                       11.6.1.7 Rest of Middle East & Africa
                                   TABLE 85 REST OF MIDDLE EAST & AFRICA: SHREDDER BLADES MARKET, BY END-USER INDUSTRY, 2021–2028 (USD MILLION)
 
12 COMPETITIVE LANDSCAPE (Page No. - 131)
     12.1 OVERVIEW 
     12.2 MARKET SHARE ANALYSIS (BY INDUSTRIAL CONCENTRATION), 2022 
               FIGURE 40 INDUSTRY CONCENTRATION OF KEY PLAYERS
               TABLE 86 SHREDDER BLADES MARKET SHARE ANALYSIS, 2022
     12.3 COMPANY EVALUATION MATRIX, 2022 
             12.3.1 STARS
             12.3.2 EMERGING LEADERS
             12.3.3 PERVASIVE PLAYERS
             12.3.4 PARTICIPANTS
                       FIGURE 41 SHREDDER BLADES MARKET: COMPANY EVALUATION MATRIX, 2022
             12.3.5 COMPANY FOOTPRINT
                       TABLE 87 OVERALL COMPANY FOOTPRINT
                       TABLE 88 SHAFT COUNT: COMPANY FOOTPRINT
                       TABLE 89 BLADE MATERIAL: COMPANY FOOTPRINT
                       TABLE 90 BLADE DESIGN: COMPANY FOOTPRINT
                       TABLE 91 APPLICATION: COMPANY FOOTPRINT
                       TABLE 92 END-USER INDUSTRY: COMPANY FOOTPRINT
                       TABLE 93 REGION: COMPANY FOOTPRINT
     12.4 START-UPS/SMALL AND MEDIUM-SIZED ENTERPRISES (SMES) EVALUATION MATRIX, 2022 
             12.4.1 PROGRESSIVE COMPANIES
             12.4.2 RESPONSIVE COMPANIES
             12.4.3 DYNAMIC COMPANIES
             12.4.4 STARTING BLOCKS
                       FIGURE 42 SHREDDER BLADES MARKET: START-UPS/SMES EVALUATION MATRIX, 2022
             12.4.5 COMPETITIVE BENCHMARKING
                       TABLE 94 LIST OF KEY START-UPS/SMES
                       TABLE 95 SHAFT COUNT: START-UPS/SMES: FOOTPRINT
                       TABLE 96 BLADE MATERIAL: START-UPS/SMES FOOTPRINT
                       TABLE 97 BLADE DESIGN :START-UPS/SMES FOOTPRINT
                       TABLE 98 APPLICATION: START-UPS/SMES FOOTPRINT
                       TABLE 99 END-USER INDUSTRY: START-UPS/SMES FOOTPRINT
                       TABLE 100 REGION: START-UPS/SMES FOOTPRINT
 
13 COMPANY PROFILES (Page No. - 143)
     13.1 KEY PLAYERS 
(Business overview, Products/Solutions/Services offered, Recent developments, MnM view, Key strengths, Strategic choices, and Weaknesses and Competitive threats)*
             13.1.1 SATURN MACHINE KNIVES LTD.
                       TABLE 101 SATURN MACHINE KNIVES LTD.: COMPANY OVERVIEW
                       TABLE 102 SATURN MACHINE KNIVES LTD.: PRODUCTS/SOLUTIONS/SERVICES OFFERED
             13.1.2 MIHEU D.O.O.
                       TABLE 103 MIHEU D.O.O.: COMPANY OVERVIEW
                       TABLE 104 MIHEU D.O.O.: PRODUCTS/SOLUTIONS/SERVICES OFFERED
             13.1.3 KAMADUR INDUSTRIAL KNIVES B.V.
                       TABLE 105 KAMADUR INDUSTRIAL KNIVES B.V.: COMPANY OVERVIEW
                       TABLE 106 KAMADUR INDUSTRIAL KNIVES B.V.: PRODUCTS/SOLUTIONS/SERVICES OFFERED
             13.1.4 FORDURA CHINA
                       TABLE 107 FORDURA CHINA: COMPANY OVERVIEW
                       TABLE 108 FORDURA CHINA: PRODUCTS/SOLUTIONS/SERVICES OFFERED
             13.1.5 BKS KNIVES
                       TABLE 109 BKS KNIVES: COMPANY OVERVIEW
                       TABLE 110 BKS KNIVES: PRODUCTS/SOLUTIONS/SERVICES OFFERED
             13.1.6 POVELATO SRL
            TABLE 111 POVELATO SRL: COMPANY OVERVIEW
            TABLE 112 POVELATO SRL: PRODUCTS/SOLUTIONS/SERVICES OFFERED
             13.1.7 WANROOE MACHINERY CO., LTD.
                       TABLE 113 WANROOE MACHINERY CO., LTD.: COMPANY OVERVIEW
                       TABLE 114 WANROOE MACHINERY CO., LTD.: PRODUCTS/SOLUTIONS/SERVICES OFFERED
             13.1.8 ACCU GRIND.
                       TABLE 115 ACCU GRIND: COMPANY OVERVIEW
                       TABLE 116 ACCU GRIND: PRODUCTS/SOLUTIONS/SERVICES OFFERED
             13.1.9 MULTECH MACHINERY CORP.
                       TABLE 117 MULTECH MACHINERY CORP.: COMPANY OVERVIEW
                       TABLE 118 MULTECH MACHINERY CORP.: PRODUCTS/SOLUTIONS/SERVICES OFFERED
             13.1.10 SERVO INTERNATIONAL
                       TABLE 119 SERVO INTERNATIONAL: COMPANY OVERVIEW
                       TABLE 120 SERVO INTERNATIONAL: PRODUCTS/SOLUTIONS/SERVICES OFFERED
             13.1.11 MAANSHAN HENGLONG MECHANICAL TECHNOLOGY CO., LTD
                       TABLE 121 MAANSHAN HENGLONG MECHANICAL TECHNOLOGY CO., LTD.: COMPANY OVERVIEW
                       TABLE 122 MAANSHAN HENGLONG MECHANICAL TECHNOLOGY CO., LTD.: PRODUCTS/SOLUTIONS/SERVICES OFFERED
             13.1.12 NANJING JINGFENG KNIFE MANUFACTURING CO., LTD.
                       TABLE 123 NANJING JINGFENG KNIFE MANUFACTURING CO., LTD.: COMPANY OVERVIEW
                       TABLE 124 NANJING JINGFENG KNIFE MANUFACTURING CO., LTD.: PRODUCTS/SOLUTIONS/SERVICES OFFERED
             13.1.13 NANJING HUAXIN MACHINERY TOOL MANUFACTURING CO., LTD.
                       TABLE 125 NANJING HUAXIN MACHINERY TOOL MANUFACTURING CO., LTD.: COMPANY OVERVIEW
                       TABLE 126 NANJING HUAXIN MACHINERY TOOL MANUFACTURING CO., LTD.: PRODUCTS/SOLUTIONS/SERVICES OFFERED
             13.1.14 ANHUI YAFEI MACHINE TOOL CO., LTD.
                       TABLE 127 ANHUI YAFEI MACHINE TOOL CO., LTD.: COMPANY OVERVIEW
                       TABLE 128 ANHUI YAFEI MACHINE TOOL CO., LTD.: PRODUCTS/SOLUTIONS/SERVICES OFFERED
             13.1.15 FERNITE OF SHEFFIELD LTD
                       TABLE 129 FERNITE OF SHEFFIELD LTD.: COMPANY OVERVIEW
                       TABLE 130 FERNITE OF SHEFFIELD LTD.: PRODUCTS/SOLUTIONS/SERVICES OFFERED
     13.2 OTHER PLAYERS 
             13.2.1 SHRED TOOLS INDIA
             13.2.2 AMERICAN CUTTING EDGE
             13.2.3 AKER TOOLS & COMPONENTS
             13.2.4 HARSONS VENTURES PVT. LTD.
             13.2.5 SHREE VISHWAKARMA INDUSTRIES
             13.2.6 WISCON ENVIROTECH INC.
*Details on Business overview, Products/Solutions/Services offered, Recent developments, MnM view, Key strengths, Strategic choices, and Weaknesses and Competitive threats might not be captured in case of unlisted companies.
 
14 APPENDIX (Page No. - 170)
     14.1 INSIGHTS FROM INDUSTRY EXPERTS 
     14.2 DISCUSSION GUIDE 
     14.3 KNOWLEDGESTORE: MARKETSANDMARKETS’  SUBSCRIPTION PORTAL 
     14.4 CUSTOMIZATION OPTIONS 
     14.5 RELATED REPORTS 
     14.6 AUTHOR DETAILS 

The study involved major activities in estimating the current size of the shredder blades market. Exhaustive secondary research was done to collect information on the peer and parent markets. The next step was to validate these findings, assumptions, and sizing with industry experts across the value chain through primary research. Both top-down and bottom-up approaches were employed to estimate the complete market size. Thereafter, market breakdown and data triangulation were used to estimate the market size of the segments and subsegments.

Secondary Research

This research study on the Shredder blades market involved the use of extensive secondary sources, directories, and databases, such as Plastic Recyclers Europe (Brussels), Environmental Protection Agency (US) and International Solid Waste Association (Netherlands) to identify and collect information useful for a technical, market-oriented, and commercial study of the global Shredder blades market. The other secondary sources included annual reports, press releases & investor presentations of companies, white papers, certified publications, articles by recognized authors, manufacturer associations, trade directories, and databases.

Primary Research

The shredder blades market comprises several stakeholders such as shredder blades manufacturers, manufacturers of subcomponents of transformer monitoring, manufacturing technology providers, and technology support providers in the supply chain. The demand side of this market is characterized by the rising demand for waste management and recycling companies that utilize shredder machines to meet their sustainability requirements are categorized as end users.
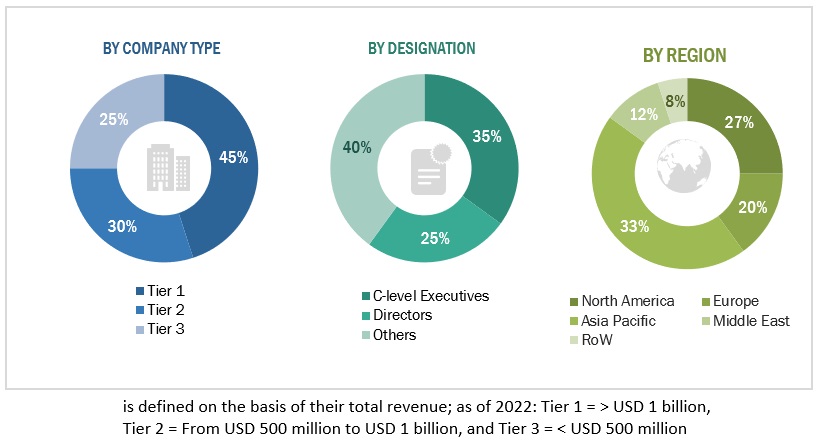
Shredder Blades  Market Size, and Share

To know about the assumptions considered for the study, download the pdf brochure

Market Size Estimation

Both top-down and bottom-up approaches were used to estimate and validate the total size of the Shredder blades market. These methods were also used extensively to estimate the size of various subsegments in the market. The research methodology used to estimate the market size includes the following:

  • The key players in the industry and market have been identified through extensive secondary research, and their market share in the respective regions have been determined through both primary and secondary research.
  • The industry’s value chain and market size, in terms of value, have been determined through primary and secondary research processes.
  • All percentage shares, splits, and breakdowns have been determined using secondary sources and verified through primary sources.

Global Shredder blades Market Size: Top-down Approach
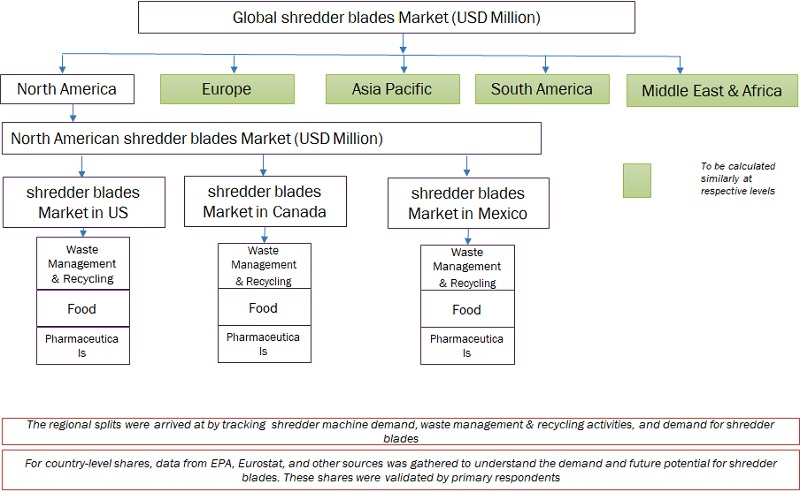
Shredder Blades  Market Top Down Approach

To know about the assumptions considered for the study, Request for Free Sample Report

Global Shredder blades Market Size: Bottom-Up Approach
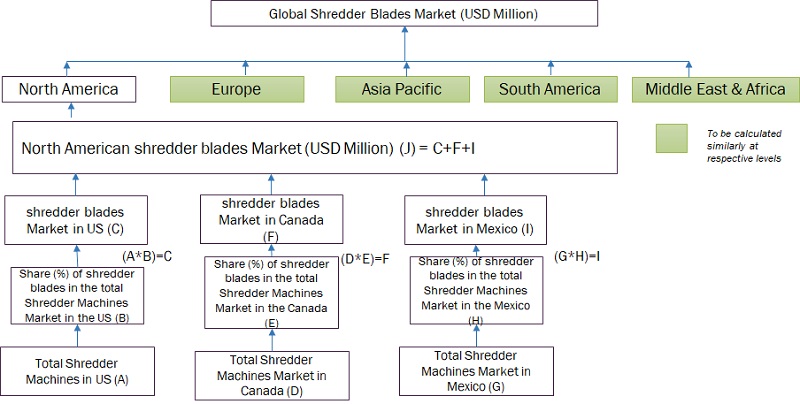
Shredder Blades  Market Bottom Up Approach

Data Triangulation

After arriving at the overall market size from the estimation process explained above, the total market has been split into several segments and subsegments. To complete the overall market engineering process and arrive at the exact statistics for all the segments and subsegments, the data triangulation and market breakdown processes have been employed, wherever applicable. The data has been triangulated by studying various factors and trends from both the demand- and supply sides. Along with this, the market has been validated using both the top-down and bottom-up approaches.

Market Definition

Shredder blades are essential components in industrial machinery known as shredders. These blades are designed to shred and reduce various materials, such as paper, plastic, metal, and wood among others, into smaller pieces or particles. The blades rotate at at high speed and shred material by shearing it between them. Shredder blades are a vital part of the shredding process, and they come in different types and configurations to suit specific shredding needs.

Shredder blades are typically made of durable materials to withstand the rigorous demands of shredding operations.

Key Stakeholders

  • Manufacturers of shredder blades
  • Manufacturers of shredding machines
  • Waste management and recycling companies
  • Government and research organizations
  • Raw material suppliers
  • Maintenance and service providers
  • Trade associations
  • Institutional investors
  • Environmental organizations
  • Original equipment manufacturers (OEMs)

Objectives of the Study

  • To define, describe, segment, and forecast the Shredder blades market, in terms of value,  material, design, shaft count, applications, end-user industries, and region
  • To forecast the market size for five key regions: North America, South America, Europe, Asia Pacific, and Middle East & Africa, along with their key countries
  • To provide detailed information about the key drivers, restraints, opportunities, and challenges influencing the growth of the market
  • To strategically analyze the subsegments with respect to individual growth trends, prospects, and contributions of each segment to the overall market size
  • To analyze market opportunities for stakeholders and the competitive landscape of the market
  • To strategically profile the key players and comprehensively analyze their market shares and core competencies
  • To analyze competitive developments, such as deals and agreements in the market

Available Customizations:

With the given market data, MarketsandMarkets offers customizations as per the client’s specific needs. The following customization options are available for this report:

Geographic Analysis

  • Further breakdown of region or country-specific analysis

Company Information

  • Detailed analyses and profiling of additional market players (up to 5)
Custom Market Research Services

We will customize the research for you, in case the report listed above does not meet with your exact requirements. Our custom research will comprehensively cover the business information you require to help you arrive at strategic and profitable business decisions.

Request Customization
Report Code
EP 8875
Published ON
Dec, 2023
Choose License Type
BUY NOW
  • SHARE
X
Request Customization
Speak to Analyst
Speak to Analyst
OR FACE-TO-FACE MEETING
PERSONALIZE THIS RESEARCH
  • Triangulate with your Own Data
  • Get Data as per your Format and Definition
  • Gain a Deeper Dive on a Specific Application, Geography, Customer or Competitor
  • Any level of Personalization
REQUEST A FREE CUSTOMIZATION
LET US HELP YOU!
  • What are the Known and Unknown Adjacencies Impacting the Shredder Blades Market
  • What will your New Revenue Sources be?
  • Who will be your Top Customer; what will make them switch?
  • Defend your Market Share or Win Competitors
  • Get a Scorecard for Target Partners
CUSTOMIZED WORKSHOP REQUEST
+1-888-600-6441
  • Call Us
  • +1-888-600-6441 (Corporate office hours)
  • +1-888-600-6441 (US/Can toll free)
  • +44-800-368-9399 (UK office hours)
CONNECT WITH US
ABOUT TRUST ONLINE
©2024 MarketsandMarkets Research Private Ltd. All rights reserved
DMCA.com Protection Status Website Feedback