Solvents Market

Solvents Market by Type (Alcohols, Ketones, Esters, Glycol Ethers, Aromatic, Aliphatic), Application (Paints & Coatings, Polymer Manufacturing, Printing Inks), and Region - Global Forecast to 2025

Report Code: CH 2218 Sep, 2020, by marketsandmarkets.com

Solvents Market Analysis

The global solvents market was valued at USD 21.8 billion in 2020 and is projected to reach USD 30.0 billion by 2025, growing at a cagr 6.6% from 2020 to 2025. High demand for solvents from home care and personal care products as well as from agricultural chemicals application is estimated to drive its market during the forecast period.

Solvent Market

To know about the assumptions considered for the study, Request for Free Sample Report

Impact of COVID-19 on solvents market.

The solvents market is expected to get negatively affected due to the disturbance in the global supply chain. The market is highly dependent on the growth in construction, automotive, shipbuilding, aircraft manufacturing as solvents are used in paints & coatings applications in these sectors. China is the major market for manufacturing and construction in the world. Strict lockdown in the country’s major provinces has affected construction activities in China. The demand for paints & coatings has declined in the first quarter of this year, mainly due to the outbreak of COVID-19, thereby hitting the demand for solvents.

China is among the largest producers and consumers of solvents. The lack of supply of raw materials has weakened the production of solvents in the country. North America and Europe are also badly affected by COVID-19; hence the economic recession in countries such as the US, Canada, Italy, and Spain, is expected in the next two-three years. The demand for solvents has contracted in the first two quarters of 2020 due to the COVID-19 pandemic.

Stringent environmental regulations regarding the use of certain solvents

Montreal Protocol of 1987 and its succession amendments regulate the usage of Ozone Depleting Substances (ODS). These are implemented into European Legislation by the regulation EC 1005/2009 on substances that deplete the ozone layer. Under this regulation, carbon tetrachloride and methyl chloride are regulated. Carbon tetrachloride shows a stratospheric Ozone Depleting Potential (ODP), and therefore its use is regulated. Therefore, only a small fraction of carbon tetrachloride is used as an industrial and laboratory solvent. Methyl chloride has very low stratospheric ODP, and it is listed as a “new substance” under the ODS regulation. Each participant in the supply chain is required to report annually relevant statistical data of these substances to European and national authorities. Thus, their usage is regulated.

In addition, the implementation of the EU’s solvents emission directive, which came into force in various countries between 2005 and 2007, has led to a decline in the sales of Perchloroethylene (PERC) in Europe and the US. In the EU and the US, efforts are underway to remove PERC from the dry cleaning industry.

Technological advancements leading to innovation

Technological advancements create an opportunity for the growth of the solvents market. Europe and North America are characterized by extensive experience and knowledge in the solvents market. The market is experiencing rapid growth in emerging economies. Advanced technologies and latest equipment, coupled with the application of new systems, are driving the demand for improved products in both developed and developing countries. The introduction of Gas-to-Liquids (GTL) technology was developed by Shell in 2014 have helped the solvents market to develop. Some of the major players investing in R&D are Royal Dutch Shell PLC. (Netherlands), and BASF SE (Germany).

Solvent Market by Region

To know about the assumptions considered for the study, download the pdf brochure

APAC to account for the largest share of the global solvents market during the forecast period

APAC is expected to account for the largest market share in solvents during the forecast period, in terms of value and volume. This is owing to the increasing demand for solvents in agricultural chemicals, personal care & cosmetics, and home care segments in in the region. Moreover, rapid urbanization and changing lifestyle are other factors driving the growth of solvents in the region.

Solvent Market Ecosystem

Key Players in Solvents Market

The key market players profiled in the report include Royal Dutch Shell Plc (Netherlands), Eastman Chemical Company (US), LyondellBasell Industries Holdings B.V. (Netherlands), Ashland Global Holdings Inc. (US), BASF SE (Germany), Huntsman Corporation (US), ExxonMobil Corporation (US), Celanese Corporation (US), Honeywell International Inc. (US), and INEOS AG (Switzerland), among others.

Royal Dutch Shell Plc. is one of the leading manufacturers of solvents globally. It is vertically integrated and is active in both upstream and downstream activities in the oil & gas industry. Its well-established distribution network and brand value serve as important factors for its future growth. The company is mainly focused on its downstream business segment as it has a strong revenue-generating segment with high return-on-investment. It is focusing on expansion as the key growth strategy. The company has been focusing on the expansions and new product launches strategies to maintain its leading position in the market.

BASF SE is another major player in the solvents market, globally. . It engages in the manufacturing and selling a wide range of chemicals and intermediate solutions. The various products which the company offers include chemicals, plastics, functional solutions, performance products, agricultural solutions, and crude oil. The company has been focusing new product launches, expansions, and agreements in order to remain competitive in the solvents market.

Solvents Market Report Scope

Report Metric

Details

Years considered for the study

2018-2025

Base year considered

2019

Forecast period

2020–2025

Units considered

Value (USD Million), Volume (Kiloton)

Segments covered

Solvents Type, Appliction, and Region

Regions covered

APAC, North America, Europe, Middle East & Africa, and South America

Companies profiled

Royal Dutch Shell Plc (Netherlands), Eastman Chemical Company (US), LyondellBasell Industries Holdings B.V. (Netherlands), Ashland Global Holdings Inc. (US), BASF SE (Germany), Huntsman Corporation (US), ExxonMobil Corporation (US), Celanese Corporation (US), Honeywell International Inc. (US), and INEOS Group AG (UK) among others.
Top 23 major players covered

The research report categorizes the solvents market into the following segments:

Solvents Market, by Product Type

  • Oxygenated Solvents
    • Alcohols
      • Methanol
      • Ethanol
      • Propanol
      • Butanol
    • Glycols
      • Ethylene Glycols 
      • Propylene Glycols 
    • Glycol Ethers
      • E-series Glycol Ethers
      • P-series Glycol Ethers
      • Butyl Glycol Ethers
    • Ketones
      • Acetone
      • MEK
      • MIBK
    • Esters
      • Ethyl Acetate
      • Butyl Acetate 
  • Hydrocarbon Solvents
    • Aliphatic Solvents
    • Aromatic Solvents
      • Toluene
      • Xylene
      • Ethyl Benzene
    • Halogenated Solvents
      • Methylene Chloride 
      • Trichloroethylene
      • Perchloroethylene
    • Acetic Acid

Solvents Market, by Application

  • Paints & Coatings
  • Pharmaceuticals
  • Adhesives
  • Printing Inks
  • Metal Cleaning
  • Personal Care
  • Polymer Manufacturing
  • Agricultural Chemicals
  • Others

Solvents Market, by Region:

  • North America
  • Europe
  • Asia Pacific
  • South America
  • Middle East & Africa

Recent Developments:

  • In May 2018, Royal Dutch Shell PLC, started the operation of the second ethylene cracker at Nanhai Petrochemicals Complex in Huizhou, Guangdong Province, China. The company started the production through a joint venture of China National Offshore Oil Corporation (CNOOC) and Shell Nanhai B.V. (Shell). The expansion helped the company manufacture ethylene oxide, ethylene glycol, propylene oxide, polyols, polyolefins, phenol and oxo-alcohols through OMEGA, SMPO, and polyols technologies.
  • In May 2018, BASF SE (Germany) and ExxonMobil (US) signed an agreement to jointly develop new gas treating solvents and process technologies to be used for natural gas processing and petroleum refining.
  • In August 2017, ExxonMobil Corporation's Singapore affiliate completed the acquisition of one of the world’s largest aromatics facilities on Jurong Island in Singapore, owned by Jurong Aromatics Corporation (Singapore).
  • In December 2016, the wholly-owned subsidiary of Eastman Chemical Company (US), Taminco BVBA, acquired 50 percent shares of Te An Ling Tian Fine Chemical Co., Ltd. (China). Te An Ling Tian Fine Chemical Co., Ltd. is a manufacturer of amines and specialty derivatives, including solvents and alklylalkanolamines.

To speak to our analyst for a discussion on the above findings, click Speak to Analyst


TABLE OF CONTENTS

1 INTRODUCTION (Page No. - 32)
    1.1 OBJECTIVES OF THE STUDY
    1.2 MARKET DEFINITION
           1.2.1 SOLVENTS: MARKET DEFINITION
    1.3 MARKET SCOPE
        FIGURE 1 SOLVENTS MARKET SEGMENTATION
           1.3.1 YEARS CONSIDERED FOR THE STUDY
    1.4 CURRENCY
    1.5 UNIT CONSIDERED
    1.6 STAKEHOLDERS

2 RESEARCH METHODOLOGY (Page No. - 35)
    2.1 RESEARCH DATA
           2.1.1 SOLVENTS MARKET: RESEARCH APPROACH
           2.1.2 STUDY APPROACH OF SOLVENTS MARKET
           2.1.3 SECONDARY DATA
                    2.1.3.1 Key data from secondary sources
                    2.1.3.2 Key sources for secondary research
           2.1.4 PRIMARY DATA
                    2.1.4.1 Key data from primary sources
                    2.1.4.2 Primary interviews – demand and supply side
                    2.1.4.3 Breakdown of primary interviews
    2.2 BASE NUMBER CALCULATION
           2.2.1 SUPPLY-SIDE APPROACH
                 FIGURE 2 MARKET SIZE ESTIMATION METHODOLOGY FROM SUPPLY SIDE
           2.2.2 DEMAND SIDE APPROACH
                 FIGURE 3 MARKET SIZE ESTIMATION METHODOLOGY FROM DEMAND SIDE
    2.3 FORECAST NUMBER CALCULATION
           2.3.1 SUPPLY SIDE
           2.3.2 DEMAND SIDE
    2.4 MARKET SIZE ESTIMATION
           2.4.1 BOTTOM-UP APPROACH
           2.4.2 TOP-DOWN APPROACH
    2.5 DATA TRIANGULATION
        FIGURE 4 SOLVENTS MARKET: DATA TRIANGULATION
    2.6 ASSUMPTIONS
    2.7 FACTORS ANALYSIS
           2.7.1 SOLVENTS MARKET: FACTORS IMPACTING THE MARKET
    2.8 LIMITATIONS & RISKS ASSOCIATED WITH SOLVENTS MARKET

3 EXECUTIVE SUMMARY (Page No. - 48)
    3.1 SOLVENTS MARKET: REALISTIC, PESSIMISTIC, OPTIMISTIC, AND PRE-COVID-19 SCENARIO
           3.1.1 NON-COVID-19 SCENARIO
           3.1.2 OPTIMISTIC SCENARIO
           3.1.3 PESSIMISTIC SCENARIO
           3.1.4 REALISTIC SCENARIO
                 FIGURE 5 RISING DEMAND FOR OXYGENATED SOLVENTS TO AUGMENT MARKET GROWTH
                 FIGURE 6 PAINTS & COATINGS TO BE THE LARGEST APPLICATION IN SOLVENTS MARKET
                 FIGURE 7 APAC WAS THE LARGEST SOLVENTS MARKET IN 2019

4 PREMIUM INSIGHTS (Page No. - 52)
    4.1 ATTRACTIVE OPPORTUNITIES IN THE SOLVENTS MARKET
        FIGURE 8 EXPECTED INCREASE IN DEMAND FOR PERSONAL CARE AND PRINTING INK APPLICATION TO DRIVE THE SOLVENTS MARKET BETWEEN 2020 AND 2025
    4.2 SOLVENTS MARKET, BY REGION, 2020–2025
        FIGURE 9 APAC TO BE THE LARGEST SOLVENTS MARKET DURING FORECAST PERIOD
    4.3 SOLVENTS MARKET IN APAC, BY APPLICATION AND COUNTRY
        FIGURE 10 CHINA WAS THE LARGEST SOLVENTS MARKET IN APAC IN 2019
    4.4 SOLVENTS MARKET, BY APPLICATION
        FIGURE 11 PAINTS & COATINGS WAS THE LARGEST APPLICATION OF SOLVENTS

5 MARKET OVERVIEW (Page No. - 54)
    5.1 INTRODUCTION
    5.2 HISTORY OF SOLVENTS
        FIGURE 12 EVOLUTION OF SOLVENTS
    5.3 MARKET DYNAMICS OF CONVENTIONAL SOLVENTS
        FIGURE 13 DRIVERS, RESTRAINTS, OPPORTUNITIES, AND CHALLENGES IN THE CONVENTIONAL SOLVENTS MARKET
           5.3.1 DRIVERS
                    5.3.1.1 High demand for conventional solvents from personal care, home care, and pharmaceutical applications amid COVID-19
           5.3.2 RESTRAINTS
                    5.3.2.1 Industries shifting focus to green solvents
                    5.3.2.2 Stringent regulatory environment regarding use of certain conventional solvents
           5.3.3 OPPORTUNITIES
                    5.3.3.1 Increase in demand for solvents from paints & coatings sector
                    5.3.3.2 Emerging trends in bio-derived organic solvents
           5.3.4 CHALLENGES
                    5.3.4.1 Harmful effects of conventional solvents
                    5.3.4.2 Handling issues of flammable solvents
    5.4 MARKET DYNAMICS OF BIO & GREEN SOLVENTS
        FIGURE 14 DRIVERS, RESTRAINTS, OPPORTUNITIES, AND CHALLENGES IN THE BIO & GREEN SOLVENTS MARKET
           5.4.1 DRIVERS
                    5.4.1.1 Increasing market penetration
                    5.4.1.2 Environmental regulations to reduce VOC emissions
           5.4.2 RESTRAINTS
                    5.4.2.1 High production cost and performance issues
           5.4.3 OPPORTUNITIES
                    5.4.3.1 Focus of federal government on bio-based products
                    5.4.3.2 Regions with strict regulations to offer high growth potential
                    5.4.3.3 Extensive R&D on bio & green solvents
           5.4.4 CHALLENGES
                    5.4.4.1 Limitations of ionic solvents, deep eutectic solvents (DESs), and supercritical fluids
    5.5 PORTER’S FIVE FORCES ANALYSIS: CONVENTIONAL SOLVENTS MARKET
        FIGURE 15 PORTER’S FIVE FORCES ANALYSIS: SOLVENTS MARKET
           5.5.1 THREAT 0F NEW ENTRANTS
           5.5.2 THREAT OF SUBSTITUTES
           5.5.3 BARGAINING POWER OF BUYERS
           5.5.4 BARGAINING POWER OF SUPPLIERS
           5.5.5 INTENSITY OF COMPETITIVE RIVALRY
    5.6 AVERAGE SELLING PRICE
        TABLE 1 AVERAGE SELLING PRICE OF SOLVENTS, BY TYPE, 2019 (USD/KG)
    5.7 MACROECONOMIC INDICATORS
           5.7.1 GDP TRENDS AND FORECAST OF MAJOR ECONOMIES
                 TABLE 2 REAL GDP GROWTH RATE, BY MAJOR ECONOMY, 2018–2025
           5.7.2 TRENDS AND FORECAST OF AUTOMOTIVE SECTOR AND ITS IMPACT ON SOLVENTS MARKET
                 FIGURE 16 GLOBAL MOTOR VEHICLE PRODUCTION, 2018-2019
           5.7.3 IMPACT OF COVID-19 ON AUTOMOTIVE INDUSTRY
                    5.7.3.1 Customer’s most impacted regions
           5.7.4 IMPACT OF COVID-19 ON CONSTRUCTION INDUSTRY AND ITS IMPACT OF SOLVENTS MARKET
                 FIGURE 17 GDP GROWTH RATE, BY KEY COUNTRIES, 2020
    5.8 VALUE CHAIN ANALYSIS
        FIGURE 18 VALUE CHAIN ANALYSIS OF SOLVENTS
           5.8.1 RAW MATERIALS/SOURCE OF RAW MATERIALS
           5.8.2 MANUFACTURING
           5.8.3 FINAL PRODUCT
           5.8.4 DISTRIBUTION
           5.8.5 APPLICATION
    5.9 SHIFT IN REVENUE STREAMS DUE TO MEGATRENDS IN END-USE INDUSTRIES
        FIGURE 19 SOLVENTS MARKET: CHANGING REVENUE MIX
    5.10 CONNECTED MARKET: ECOSYSTEM
         FIGURE 20 SOLVENTS MARKET: ECOSYSTEM
    5.11 CASE STUDIES
         FIGURE 21 MARKET ASSESSMENT OF TOLUENE SOLVENT FOR APAC
         FIGURE 22 MARKET ASSESSMENT OF AROMATIC SOLVENTS FOR EUROPE
    5.12 PATENTS ANALYSIS
         TABLE 3 SOME OF THE PATENTS IN THE SOLVENTS MARKET
    5.13 TECHNOLOGY ANALYSIS

6 SOLVENTS MARKET, BY TYPE (Page No. - 75)
    6.1 INTRODUCTION
        TABLE 4 SOME POLAR AND NON-POLAR SOLVENTS
        FIGURE 23 OXYGENATED SOLVENTS TO DOMINATE THE MARKET DURING THE FORECAST PERIOD
        TABLE 5 SOLVENTS MARKET SIZE, BY TYPE, 2018–2025 (KILOTON)
        TABLE 6 SOLVENTS MARKET SIZE, BY TYPE, 2018–2025 (USD MILLION)
    6.2 OXYGENATED SOLVENTS
           6.2.1 LOW-VOC CONTENT OF OXYGENATED SOLVENTS TO DRIVE THE MARKET
                 FIGURE 24 APAC TO BE THE LARGEST MARKET FOR OXYGENATED SOLVENTS DURING THE FORECAST PERIOD
                 TABLE 7 OXYGENATED SOLVENTS MARKET SIZE, BY REGION, 2018–2025 (KILOTON)
                 TABLE 8 OXYGENATED SOLVENTS MARKET SIZE, BY REGION, 2018–2025 (USD MILLION)
                 TABLE 9 OXYGENATED SOLVENTS MARKET SIZE, BY APPLICATION, 2018–2025 (KILOTON)
                 TABLE 10 OXYGENATED SOLVENTS MARKET SIZE, BY APPLICATION, 2018–2025 (USD MILLION)
                 TABLE 11 OXYGENATED SOLVENTS MARKET SIZE, BY TYPE, 2018–2025 (KILOTON)
                 TABLE 12 OXYGENATED SOLVENTS MARKET SIZE, BY TYPE, 2018–2025 (USD MILLION)
           6.2.2 ALCOHOLS
                 TABLE 13 ALCOHOL SOLVENTS MARKET SIZE, BY REGION, 2018–2025 (KILOTON)
                 TABLE 14 ALCOHOL SOLVENTS MARKET SIZE, BY REGION, 2018–2025 (USD MILLION)
                 TABLE 15 ALCOHOL SOLVENTS MARKET SIZE, BY TYPE, 2018–2025 (KILOTON)
                 TABLE 16 ALCOHOL SOLVENTS MARKET SIZE, BY TYPE, 2018–2025 (USD MILLION)
                    6.2.2.1 Methanol
                               6.2.2.1.1 Rising use in chemical manufacturing
                                         TABLE 17 METHANOL: GENERAL PROPERTIES
                                         TABLE 18 METHANOL SOLVENTS MARKET SIZE, BY REGION, 2018–2025 (KILOTON)
                                         TABLE 19 METHANOL SOLVENTS MARKET SIZE, BY REGION, 2018–2025 (USD MILLION)
                    6.2.2.2 Propanol
                            TABLE 20 PROPANOL SOLVENTS MARKET SIZE, BY REGION, 2018–2025 (KILOTON)
                            TABLE 21 PROPANOL SOLVENTS MARKET SIZE, BY REGION, 2018–2025 (USD MILLION)
                               6.2.2.2.1 Isopropanol
                                             6.2.2.2.1.1 Used as household cleaners apart from pharmaceutical uses
                                                         TABLE 22 IPA: GENERAL PROPERTIES
                               6.2.2.2.2 N-propanol
                                             6.2.2.2.2.1 Used as a solvent in printing inks, cosmetics, and other applications
                                                         TABLE 23 N-PROPANOL: GENERAL PROPERTIES
                    6.2.2.3 Ethanol
                               6.2.2.3.1 Most widely used bio & green solvent
                                         TABLE 24 ETHANOL: GENERAL PROPERTIES
                                         TABLE 25 ETHANOL SOLVENTS MARKET SIZE, BY REGION, 2018–2025 (KILOTON)
                                         TABLE 26 ETHANOL SOLVENTS MARKET SIZE, BY REGION, 2018–2025 (USD MILLION)
                    6.2.2.4 Butanol
                            TABLE 27 BUTANOL SOLVENTS MARKET SIZE, BY REGION, 2018–2025 (KILOTON)
                            TABLE 28 BUTANOL SOLVENTS MARKET SIZE, BY REGION, 2018–2025 (USD MILLION)
                               6.2.2.4.1 Isobutanol
                                         TABLE 29 ISO-BUTANOL: GENERAL PROPERTIES
                               6.2.2.4.2 N-butanol
                                         TABLE 30 N-BUTANOL: GENERAL PROPERTIES
           6.2.3 ESTERS
                    6.2.3.1 Extensive use in fragrances, cosmetics, and personal care, and as processing solvents
                            TABLE 31 ESTER SOLVENTS MARKET SIZE, BY REGION, 2018–2025 (KILOTON)
                            TABLE 32 ESTER SOLVENTS MARKET SIZE, BY REGION, 2018–2025 (USD MILLION)
                            TABLE 33 ESTER SOLVENTS MARKET SIZE, BY TYPE, 2018–2025 (KILOTON)
                            TABLE 34 ESTERS SOLVENTS MARKET SIZE, BY TYPE, 2018–2025 (USD MILLION)
                    6.2.3.2 Ethyl acetate
                               6.2.3.2.1 Low toxicity, low cost, and pleasant odor likely to drive the market
                                         TABLE 35 ETHYL ACETATE: GENERAL PROPERTIES
                                         TABLE 36 ETHYL ACETATE SOLVENTS MARKET SIZE, BY REGION, 2018–2025 (KILOTON)
                                         TABLE 37 ETHYL ACETATE SOLVENTS MARKET SIZE, BY REGION, 2018–2025 (USD MILLION)
                    6.2.3.3 Butyl acetate
                               6.2.3.3.1 Applications in chemical, pharmaceuticals, and various other industries
                                         TABLE 38 BUTYL ACETATE: GENERAL PROPERTIES
                                         TABLE 39 BUTYL ACETATE SOLVENTS MARKET SIZE, BY REGION, 2018–2025 (KILOTON)
                                         TABLE 40 BUTYL ACETATE SOLVENTS MARKET SIZE, BY REGION, 2018–2025 (USD MILLION)
           6.2.4 KETONES
                 TABLE 41 KETONE SOLVENTS MARKET SIZE, BY REGION, 2018–2025 (KILOTON)
                 TABLE 42 KETONE SOLVENTS MARKET SIZE, BY REGION, 2018–2025 (USD MILLION)
                 TABLE 43 KETONE SOLVENTS MARKET SIZE, BY TYPE, 2018–2025 (KILOTON)
                 TABLE 44 KETONE SOLVENTS MARKET SIZE, BY TYPE, 2018–2025 (USD MILLION)
                    6.2.4.1 Acetone
                               6.2.4.1.1 Growing demand from paper and pharmaceutical applications to drive the market
                                         TABLE 45 ACETONE: GENERAL PROPERTIES
                                         TABLE 46 ACETONE SOLVENTS MARKET SIZE, BY REGION, 2018–2025 (KILOTON)
                                         TABLE 47 ACETONE SOLVENTS MARKET SIZE, BY REGION, 2018–2025 (USD MILLION)
                    6.2.4.2 MEK
                               6.2.4.2.1 Use in adhesives, printing inks, magnetic tapes, and as lube oil dewaxing agents
                                         TABLE 48 MEK: GENERAL PROPERTIES
                                         TABLE 49 MEK SOLVENTS MARKET SIZE, BY REGION, 2018–2025 (KILOTON)
                                         TABLE 50 MEK SOLVENTS MARKET SIZE, BY REGION, 2018–2025 (USD MILLION)
                    6.2.4.3 MIBK
                               6.2.4.3.1 MIBK as industrial cleaners and hard surface cleaners to spur demand
                                         TABLE 51 MIBK: GENERAL PROPERTIES
                                         TABLE 52 MIBK SOLVENTS MARKET SIZE, BY REGION, 2018–2025 (KILOTON)
                                         TABLE 53 MIBK SOLVENTS MARKET SIZE, BY REGION, 2018–2025 (USD MILLION)
           6.2.5 GLYCOL ETHERS
                 TABLE 54 GLYCOL ETHER SOLVENTS MARKET SIZE, BY REGION, 2018–2025 (KILOTON)
                 TABLE 55 GLYCOL ETHER SOLVENTS MARKET SIZE, BY REGION, 2018–2025 (USD MILLION)
                 TABLE 56 GLYCOL ETHER SOLVENTS MARKET SIZE, BY TYPE, 2018–2025 (KILOTON)
                 TABLE 57 GLYCOL ETHER SOLVENTS MARKET SIZE, BY TYPE, 2018–2025 (USD MILLION)
                    6.2.5.1 E-Series glycol ethers
                               6.2.5.1.1 Excellent solvency, chemical stability, and compatibility with water to boost the market
                                         TABLE 58 E-SERIES GLYCOL ETHER SOLVENTS MARKET SIZE, BY REGION, 2018–2025 (KILOTON)
                                         TABLE 59 E-SERIES GLYCOL ETHER SOLVENTS MARKET SIZE, BY REGION, 2018–2025 (USD MILLION)
                    6.2.5.2 P-series glycol ethers
                               6.2.5.2.1 Requirement of p-series glycol ethers in various applications
                                         TABLE 60 P-SERIES GLYCOL ETHER SOLVENTS MARKET SIZE, BY REGION, 2018–2025 (KILOTON)
                                         TABLE 61 P-SERIES GLYCOL ETHER SOLVENTS MARKET SIZE, BY REGION, 2018–2025 (USD MILLION)
                    6.2.5.3 Butyl glycol ethers
                               6.2.5.3.1 Mainly used in cosmetics, agricultural chemicals, and paints & coatings
                                         TABLE 62 BUTYL GLYCOL ETHER SOLVENTS MARKET SIZE, BY REGION, 2018–2025 (KILOTON)
                                         TABLE 63 BUTYL GLYCOL ETHER SOLVENTS MARKET SIZE, BY REGION, 2018–2025 (USD MILLION)
           6.2.6 GLYCOLS
                 TABLE 64 GLYCOL SOLVENTS MARKET SIZE, BY REGION, 2018–2025 (KILOTON)
                 TABLE 65 GLYCOL SOLVENTS MARKET SIZE, BY REGION, 2018–2025 (USD MILLION)
                 TABLE 66 GLYCOL SOLVENTS MARKET SIZE, BY TYPE, 2018–2025 (KILOTON)
                 TABLE 67 GLYCOL SOLVENTS MARKET SIZE, BY TYPE, 2018–2025 (USD MILLION)
                    6.2.6.1 Propylene glycol
                               6.2.6.1.1 Non-toxic nature of propylene glycol to drive its demand
                                         TABLE 68 PROPYLENE GLYCOL: GENERAL PROPERTIES
                                         TABLE 69 PROPYLENE GLYCOL SOLVENTS MARKET SIZE, BY REGION, 2018–2025 (KILOTON)
                                         TABLE 70 PROPYLENE GLYCOL SOLVENTS MARKET SIZE, BY REGION, 2018–2025(USD MILLION)
                    6.2.6.2 Ethylene glycol
                               6.2.6.2.1 MEG is the widely used ethylene glycol solvent
                                         TABLE 71 ETHYLENE GLYCOL SOLVENTS MARKET SIZE, BY REGION, 2018–2025 (KILOTON)
                                         TABLE 72 ETHYLENE GLYCOL SOLVENTS MARKET SIZE, BY REGION, 2018–2025 (USD MILLION)
                               6.2.6.2.2 MEG
                                         TABLE 73 MONOETHYLENE GLYCOL: GENERAL PROPERTIES
                               6.2.6.2.3 DEG
                                         TABLE 74 DIETHYLENE GLYCOL: GENERAL PROPERTIES
                               6.2.6.2.4 TEG
                                         TABLE 75 TRIETHYLENE GLYCOL: GENERAL PROPERTIES
    6.3 HYDROCARBON SOLVENTS
        FIGURE 25 APAC TO BE THE LARGEST MARKET FOR HYDROCARBON SOLVENTS
        TABLE 76 HYDROCARBON SOLVENTS MARKET SIZE, BY REGION, 2018–2025 (KILOTON)
        TABLE 77 HYDROCARBON SOLVENTS MARKET SIZE, BY REGION, 2018–2025 (USD MILLION)
        TABLE 78 HYDROCARBON SOLVENTS MARKET SIZE, BY APPLICATION, 2018–2025 (KILOTON)
        TABLE 79 HYDROCARBON SOLVENTS MARKET SIZE, BY APPLICATION, 2018–2025 (USD MILLION)
        TABLE 80 HYDROCARBON SOLVENTS MARKET SIZE, BY TYPE, 2018–2025 (KILOTON)
        TABLE 81 HYDROCARBON SOLVENTS MARKET SIZE, BY TYPE, 2018–2025 (USD MILLION)
           6.3.1 ALIPHATIC SOLVENTS
                    6.3.1.1 Extensive use of pentane, isopentane, hexane, cyclohexane, octane in various applications
                            TABLE 82 ALIPHATIC SOLVENTS MARKET SIZE, BY REGION, 2018–2025 (KILOTON)
                            TABLE 83 ALIPHATIC SOLVENTS MARKET SIZE, BY REGION, 2018–2025 (USD MILLION)
           6.3.2 AROMATIC SOLVENTS
                 TABLE 84 AROMATIC SOLVENTS MARKET SIZE, BY REGION, 2018–2025 (KILOTON)
                 TABLE 85 AROMATIC SOLVENTS MARKET SIZE, BY REGION, 2018–2025 (USD MILLION)
                 TABLE 86 AROMATIC SOLVENTS MARKET SIZE, BY TYPE, 2018–2025 (KILOTON)
                 TABLE 87 AROMATIC SOLVENTS MARKET SIZE, BY TYPE, 2018–2025 (USD MILLION)
                    6.3.2.1 Toluene
                               6.3.2.1.1 Rising vehicle sales likely to drive the market
                                         TABLE 88 TOLUENE: GENERAL PROPERTIES
                                         TABLE 89 TOLUENE SOLVENTS MARKET SIZE, BY REGION, 2018–2025 (KILOTON)
                                         TABLE 90 TOLUENE SOLVENTS MARKET SIZE, BY REGION, 2018–2025 (USD MILLION)
                    6.3.2.2 Xylene
                               6.3.2.2.1 Increasing uses of xylene as an industrial solvent
                                         TABLE 91 XYLENE SOLVENTS MARKET SIZE, BY REGION, 2018–2025 (KILOTON)
                                         TABLE 92 XYLENE SOLVENTS MARKET SIZE, BY REGION, 2018–2025 (USD MILLION)
                               6.3.2.2.2 Para-xylene
                                         TABLE 93 PARA-XYLENE: GENERAL PROPERTIES
                               6.3.2.2.3 Mixed-xylene
                                         TABLE 94 MIXED-XYLENE: GENERAL PROPERTIES
                    6.3.2.3 Ethylbenzene
                               6.3.2.3.1 Use of ethylbenzene in various industries to boost its demand
                                         TABLE 95 ETHYLBENZENE: GENERAL PROPERTIES
                                         TABLE 96 ETHYLBENZENE SOLVENTS MARKET SIZE, BY REGION, 2018–2025 (KILOTON)
                                         TABLE 97 ETHYLBENZENE SOLVENTS MARKET SIZE, BY REGION, 2018–2025 (USD MILLION)
    6.4 HALOGENATED SOLVENTS
        FIGURE 26 APAC TO BE THE LARGEST MARKET FOR HALOGENATED SOLVENTS DURING THE FORECAST PERIOD
        TABLE 98 HALOGENATED SOLVENTS MARKET SIZE, BY REGION, 2018–2025 (KILOTON)
        TABLE 99 HALOGENATED SOLVENTS MARKET SIZE, BY REGION, 2018–2025 (USD MILLION)
        TABLE 100 HALOGENATED SOLVENTS MARKET SIZE, BY APPLICATION, 2018–2025 (KILOTON)
        TABLE 101 HALOGENATED SOLVENTS MARKET SIZE, BY APPLICATION, 2018–2025 (USD MILLION)
        TABLE 102 HALOGENATED SOLVENTS MARKET SIZE, BY TYPE, 2018–2025 (KILOTON)
        TABLE 103 HALOGENATED SOLVENTS MARKET SIZE, BY TYPE, 2018–2025 (USD MILLION)
           6.4.1 METHYLENE CHLORIDE
                    6.4.1.1 Use of methylene chloride in the production of pharmaceuticals, chemicals, polymers, and as an extraction solvent to drive the market
                            TABLE 104 METHYLENE CHLORIDE: GENERAL PROPERTIES
                            TABLE 105 METHYLENE CHLORIDE SOLVENTS MARKET SIZE, BY REGION, 2018–2025 (KILOTON)
                            TABLE 106 METHYLENE CHLORIDE SOLVENTS MARKET SIZE, BY REGION, 2018–2025 (USD MILLION)
           6.4.2 TRICHLOROETHYLENE
                    6.4.2.1 Restriction on the usage of trichloroethylene in Europe and North America leading to its less demand
                            TABLE 107 TRICHLOROETHYLENE: GENERAL PROPERTIES
                            TABLE 108 TRICHLOROETHYLENE SOLVENTS MARKET SIZE, BY REGION, 2018–2025 (KILOTON)
                            TABLE 109 TRICHLOROETHYLENE SOLVENTS MARKET SIZE, BY REGION, 2018–2025 (USD MILLION)
           6.4.3 PERCHLOROETHYLENE
                    6.4.3.1 Restrictions on the usage of perchloroethylene in dry cleaning sector and its high toxicity to impact the market in Europe and North America
                            TABLE 110 PERCHLOROETHYLENE: GENERAL PROPERTIES
                            TABLE 111 PERCHLOROETHYLENE SOLVENTS MARKET SIZE, BY REGION, 2018–2025 (KILOTON)
                            TABLE 112 PERCHLOROETHYLENE SOLVENTS MARKET SIZE, BY REGION, 2018–2025 (USD MILLION)

7 SOLVENTS MARKET, BY APPLICATION (Page No. - 126)
    7.1 INTRODUCTION
        FIGURE 27 PAINTS & COATINGS TO BE THE LARGEST APPLICATION OF SOLVENTS DURING FORECAST PERIOD
        TABLE 113 SOLVENTS MARKET SIZE, BY APPLICATION, 2018–2025 (KILOTON)
        TABLE 114 SOLVENTS MARKET SIZE, BY APPLICATION, 2018–2025 (USD MILLION)
    7.2 PAINTS & COATINGS
           7.2.1 LARGEST APPLICATION OF SOLVENTS
                 FIGURE 28 APAC TO BE THE LARGEST SOLVENTS MARKET IN PAINTS & COATINGS APPLICATION
                 TABLE 115 SOLVENTS MARKET SIZE IN PAINTS & COATINGS APPLICATION, BY REGION, 2018–2025 (KILOTON)
                 TABLE 116 SOLVENTS MARKET SIZE IN PAINTS & COATINGS APPLICATION, BY REGION, 2018–2025 (USD MILLION)
    7.3 PHARMACEUTICALS
           7.3.1 SOLVENTS HELP IN CONVENIENT APPLICATION OF DRUGS
                 FIGURE 29 NORTH AMERICA TO BE THE LARGEST SOLVENTS MARKET IN PHARMACEUTICALS APPLICATION
                 TABLE 117 SOLVENTS MARKET SIZE IN PHARMACEUTICALS APPLICATION, BY REGION, 2018–2025 (KILOTON)
                 TABLE 118 SOLVENTS MARKET SIZE IN PHARMACEUTICALS APPLICATION, BY REGION, 2018–2025 (USD MILLION)
    7.4 RUBBER & POLYMER
           7.4.1 USE OF SOLVENTS IN RUBBER & POLYMER MANUFACTURING TO DRIVE THE MARKET
                 FIGURE 30 APAC TO BE THE LARGEST SOLVENTS MARKET IN RUBBER & POLYMER APPLICATION
                 TABLE 119 SOLVENTS MARKET SIZE IN RUBBER & POLYMER APPLICATION, BY REGION, 2018–2025 (KILOTON)
                 TABLE 120 SOLVENTS MARKET SIZE IN RUBBER & POLYMER APPLICATION, BY REGION, 2018–2025 (USD MILLION)
    7.5 ADHESIVES
           7.5.1 SOLVENTS INCREASE VISCOSITY OF APPLIED ADHESIVE FILMS
                 FIGURE 31 APAC TO BE THE LARGEST SOLVENTS MARKET IN ADHESIVES APPLICATION
                 TABLE 121 SOLVENTS MARKET SIZE IN ADHESIVES APPLICATION, BY REGION, 2018–2025 (KILOTON)
                 TABLE 122 SOLVENTS MARKET SIZE IN ADHESIVES APPLICATION, BY REGION, 2018–2025 (USD MILLION)
    7.6 PRINTING INKS
           7.6.1 SOLVENTS PROVIDE WETTABILITY AND PENETRATION IN INKS
                 FIGURE 32 APAC TO BE THE LARGEST SOLVENTS MARKET IN PRINTING INKS APPLICATION
                 TABLE 123 SOLVENTS MARKET SIZE IN PRINTING INKS APPLICATION, BY REGION, 2018–2025 (KILOTON)
                 TABLE 124 SOLVENTS MARKET SIZE IN PRINTING INKS APPLICATION, BY REGION, 2018–2025 (USD MILLION)
    7.7 METAL CLEANING
           7.7.1 BOTH ORGANIC AND AQUEOUS SOLVENTS TO DRIVE THE MARKET IN METAL CLEANING APPLICATION
                 FIGURE 33 APAC TO BE THE LARGEST SOLVENTS MARKET IN METAL CLEANING APPLICATION
                 TABLE 125 SOLVENTS MARKET SIZE IN METAL CLEANING APPLICATION, BY REGION, 2018–2025 (KILOTON)
                 TABLE 126 SOLVENTS MARKET SIZE IN METAL CLEANING APPLICATION, BY REGION, 2018–2025 (USD MILLION)
    7.8 PERSONAL CARE
           7.8.1 WIDELY USED IN PERFUMES AND DEODORANTS
                 FIGURE 34 APAC TO BE THE LARGEST SOLVENTS MARKET IN PERSONAL CARE APPLICATION
                 TABLE 127 SOLVENTS MARKET SIZE IN PERSONAL CARE APPLICATION, BY REGION, 2018–2025 (KILOTON)
                 TABLE 128 SOLVENTS MARKET SIZE IN PERSONAL CARE APPLICATION, BY REGION, 2018–2025 (USD MILLION)
    7.9 AGRICULTURAL CHEMICALS
           7.9.1 USE OF SOLVENTS IN AGRICULTURAL CHEMICALS FOR HIGH SPRAYING EFFICIENCY
                 FIGURE 35 APAC TO BE THE LARGEST SOLVENTS MARKET IN AGRICULTURAL CHEMICALS APPLICATION
                 TABLE 129 SOLVENTS MARKET SIZE IN AGRICULTURAL CHEMICALS APPLICATION, BY REGION, 2018–2025 (KILOTON)
                 TABLE 130 SOLVENTS MARKET SIZE IN AGRICULTURAL CHEMICALS APPLICATION, BY REGION, 2018–2025 (USD MILLION)
    7.10 OTHER APPLICATIONS
         FIGURE 36 APAC TO BE THE LARGEST SOLVENTS MARKET IN OTHER APPLICATIONS
         TABLE 131 SOLVENTS MARKET SIZE IN OTHER APPLICATIONS, BY REGION, 2018–2025 (KILOTON)
         TABLE 132 SOLVENTS MARKET SIZE IN OTHER APPLICATIONS, BY REGION, 2018–2025 (USD MILLION)

8 SOLVENTS MARKET, BY REGION (Page No. - 143)
    8.1 INTRODUCTION
        FIGURE 37 INDIA TO BE THE FASTEST-GROWING SOLVENTS MARKET DURING THE FORECAST PERIOD
        TABLE 133 SOLVENTS MARKET SIZE, BY REGION, 2018–2025 (KILOTON)
        TABLE 134 SOLVENTS MARKET SIZE, BY REGION, 2018–2025 (USD MILLION)
    8.2 APAC
           8.2.1 IMPACT OF COVID-19 ON SOLVENTS MARKET IN APAC
                 FIGURE 38 APAC: SOLVENTS MARKET SNAPSHOT
                 TABLE 135 APAC: SOLVENTS MARKET SIZE, BY COUNTRY, 2018–2025 (KILOTON)
                 TABLE 136 APAC: SOLVENTS MARKET SIZE, BY COUNTRY, 2018–2025 (USD MILLION)
                 TABLE 137 APAC: SOLVENTS MARKET SIZE, BY APPLICATION, 2018–2025 (KILOTON)
                 TABLE 138 APAC: SOLVENTS MARKET SIZE, BY APPLICATION, 2018–2025 (USD MILLION)
           8.2.2 CHINA
                    8.2.2.1 China to be the largest market for solvents in APAC
                            TABLE 139 CHINA: SOLVENTS MARKET SIZE, BY APPLICATION, 2018–2025 (KILOTON)
                            TABLE 140 CHINA: SOLVENTS MARKET SIZE, BY APPLICATION, 2018–2025 (USD MILLION)
           8.2.3 JAPAN
                    8.2.3.1 Large construction sector of Japan to be one of the major consumers of solvents
                            TABLE 141 JAPAN: SOLVENTS MARKET SIZE, BY APPLICATION, 2018–2025 (KILOTON)
                            TABLE 142 JAPAN: SOLVENTS MARKET SIZE, BY APPLICATION, 2018–2025 (USD MILLION)
           8.2.4 INDIA
                    8.2.4.1 One of the promising markets for solvents
                            TABLE 143 INDIA: SOLVENTS MARKET SIZE, 2018–2025
           8.2.5 SOUTH KOREA
                    8.2.5.1 Use of solvents in shipbuilding, electronics, and manufacturing sectors
                            TABLE 144 SOUTH KOREA: SOLVENTS MARKET SIZE, 2018–2025
           8.2.6 INDONESIA
                    8.2.6.1 Lack of centralized and adequate government response to COVID-19 to impact the market
                            TABLE 145 INDONESIA: SOLVENTS MARKET SIZE, 2018–2025
           8.2.7 REST OF APAC
                 TABLE 146 REST OF APAC: SOLVENTS MARKET SIZE, 2018–2025
    8.3 EUROPE
           8.3.1 IMPACT OF COVID-19 ON SOLVENTS MARKET IN EUROPE
                 FIGURE 39 EUROPE: SOLVENTS MARKET SNAPSHOT
                 TABLE 147 EUROPE: SOLVENTS MARKET SIZE, BY COUNTRY, 2018–2025 (KILOTON)
                 TABLE 148 EUROPE: SOLVENTS MARKET SIZE, BY COUNTRY, 2018–2025 (USD MILLION)
                 TABLE 149 EUROPE: SOLVENTS MARKET SIZE, BY APPLICATION, 2018–2025 (KILOTON)
                 TABLE 150 EUROPE: SOLVENTS MARKET SIZE, BY APPLICATION, 2018–2025 (USD MILLION)
           8.3.2 GERMANY
                    8.3.2.1 Germany to be the largest market during the forecast period
                            TABLE 151 GERMANY: SOLVENTS MARKET SIZE, BY APPLICATION, 2018–2025 (KILOTON)
                            TABLE 152 GERMANY: SOLVENTS MARKET SIZE, BY APPLICATION, 2018–2025 (USD MILLION)
           8.3.3 FRANCE
                    8.3.3.1 The growth in the automotive and aircraft industries drove the market in 2019
                            TABLE 153 FRANCE: SOLVENTS MARKET SIZE, BY APPLICATION, 2018–2025 (KILOTON)
                            TABLE 154 FRANCE: SOLVENTS MARKET SIZE, BY APPLICATION, 2018–2025 (USD MILLION)
           8.3.4 ITALY
                    8.3.4.1 Italy to be the third-largest market for solvents in Europe
                            TABLE 155 ITALY: SOLVENTS MARKET SIZE, 2018–2025
           8.3.5 UK
                    8.3.5.1 Strong manufacturing base in the UK to drive the market
                            TABLE 156 UK: CONVENTIONAL SOLVENTS MARKET SIZE, 2018–2025
           8.3.6 RUSSIA
                    8.3.6.1 Contraction of the economy in 2020 due to COVID-19 to impact the market
                            TABLE 157 RUSSIA: SOLVENTS MARKET SIZE, 2018–2025
           8.3.7 BELGIUM
                    8.3.7.1 Diversified economy to increase demand for solvents
                            TABLE 158 BELGIUM: SOLVENTS MARKET SIZE, 2018–2025
           8.3.8 SPAIN
                    8.3.8.1 Growth in the pharmaceutical sector to drive the market
                            TABLE 159 SPAIN: SOLVENTS MARKET SIZE, 2018–2025
           8.3.9 REST OF EUROPE
                 TABLE 160 REST OF EUROPE: SOLVENTS MARKET SIZE, 2018–2025
    8.4 NORTH AMERICA
           8.4.1 IMPACT OF COVID-19 ON SOLVENTS MARKET IN NORTH AMERICA
                 FIGURE 40 NORTH AMERICA: SOLVENTS MARKET SNAPSHOT
                 TABLE 161 NORTH AMERICA: SOLVENTS MARKET SIZE, BY COUNTRY, 2018–2025 (KILOTON)
                 TABLE 162 NORTH AMERICA: SOLVENTS MARKET SIZE, BY COUNTRY, 2018–2025 (USD MILLION)
                 TABLE 163 NORTH AMERICA: SOLVENTS MARKET SIZE, BY APPLICATION, 2018–2025 (KILOTON)
                 TABLE 164 NORTH AMERICA: SOLVENTS MARKET SIZE, BY APPLICATION, 2018–2025 (USD MILLION)
           8.4.2 US
                    8.4.2.1 Presence of key players in the country to drive the market
                            TABLE 165 US: SOLVENTS MARKET SIZE, BY APPLICATION, 2018–2025 (KILOTON)
                            TABLE 166 US: SOLVENTS MARKET SIZE, BY APPLICATION, 2018–2025 (USD MILLION)
           8.4.3 MEXICO
                    8.4.3.1 Cheap cost of production and availability of labor to drive the market
                            TABLE 167 MEXICO: SOLVENTS MARKET SIZE, 2018–2025
           8.4.4 CANADA
                    8.4.4.1 The strong oil & gas base in the country to drive the market
                            TABLE 168 CANADA: SOLVENTS MARKET SIZE, 2018–2025
    8.5 MIDDLE EAST & AFRICA
           8.5.1 IMPACT OF COVID-19 ON THE SOLVENTS MARKET IN THE MIDDLE EAST & AFRICA
                 TABLE 169 MIDDLE EAST & AFRICA: SOLVENTS MARKET SIZE, BY COUNTRY, 2018–2025 (KILOTON)
                 TABLE 170 MIDDLE EAST & AFRICA: SOLVENTS MARKET SIZE, BY COUNTRY, 2018–2025 (USD MILLION)
                 TABLE 171 MIDDLE EAST & AFRICA: SOLVENTS MARKET SIZE, BY APPLICATION, 2018–2025 (KILOTON)
                 TABLE 172 MIDDLE EAST & AFRICA: SOLVENTS MARKET SIZE, BY APPLICATION, 2018–2025 (USD MILLION)
           8.5.2 TURKEY
                    8.5.2.1 Favorable geographical location and well-targeted economic policies to support the market
                            TABLE 173 TURKEY: SOLVENTS MARKET SIZE, BY APPLICATION, 2018–2025 (KILOTON)
                            TABLE 174 TURKEY: SOLVENTS MARKET SIZE, BY APPLICATION, 2018–2025 (USD MILLION)
           8.5.3 IRAN
                    8.5.3.1 The increased vehicle production in the country drove the market
                            TABLE 175 IRAN: SOLVENTS MARKET SIZE, 2018–2025
           8.5.4 SAUDI ARABIA
                    8.5.4.1 Industrial production and economic stimulus package to drive the demand
                            TABLE 176 SAUDI ARABIA: SOLVENTS MARKET SIZE, 2018–2025
           8.5.5 SOUTH AFRICA
                    8.5.5.1 South Africa is the worst-hit country in Africa due to COVID-19, and this is likely to impact the market
                            TABLE 177 SOUTH AFRICA: SOLVENTS MARKET SIZE, 2018–2025
           8.5.6 QATAR
                    8.5.6.1 The proven oil & gas reserve to drive the market
                            TABLE 178 QATAR: SOLVENTS MARKET SIZE, 2018–2025
           8.5.7 REST OF MIDDLE EAST & AFRICA
                 TABLE 179 REST OF MIDDLE EAST & AFRICA: SOLVENTS MARKET SIZE, 2018–2025
    8.6 SOUTH AMERICA
           8.6.1 IMPACT OF COVID-19 ON THE SOLVENTS MARKET IN SOUTH AMERICA
                 TABLE 180 SOUTH AMERICA: SOLVENTS MARKET SIZE, BY COUNTRY, 2018–2025 (KILOTON)
                 TABLE 181 SOUTH AMERICA: SOLVENTS MARKET SIZE, BY COUNTRY, 2018–2025 (USD MILLION)
                 TABLE 182 SOUTH AMERICA: SOLVENTS MARKET SIZE, BY APPLICATION, 2018–2025 (KILOTON)
                 TABLE 183 SOUTH AMERICA: SOLVENTS MARKET SIZE, BY APPLICATION, 2018–2025 (USD MILLION)
           8.6.2 BRAZIL
                    8.6.2.1 Growing urbanization and steps taken by the government to contain COVID-19 likely to drive the market
                            TABLE 184 BRAZIL: SOLVENTS MARKET SIZE, BY APPLICATION, 2018–2025 (KILOTON)
                            TABLE 185 BRAZIL: SOLVENTS MARKET SIZE, BY APPLICATION, 2018–2025 (USD MILLION)
           8.6.3 ARGENTINA
                    8.6.3.1 Increased inflation, overwhelming debt, and difficulty accessing credit to impact the market
                            TABLE 186 ARGENTINA: SOLVENTS MARKET SIZE, 2018–2025
           8.6.4 REST OF SOUTH AMERICA
                 TABLE 187 REST OF SOUTH AMERICA: SOLVENTS MARKET SIZE, 2018–2025

9 COMPETITIVE LANDSCAPE (Page No. - 180)
    9.1 OVERVIEW
    9.2 COMPETITIVE LEADERSHIP MAPPING, TIER 1 COMPANIES
           9.2.1 STAR
           9.2.2 EMERGING LEADERS
           9.2.3 PERVASIVE
           9.2.4 PARTICIPANT
                 FIGURE 41 SOLVENTS MARKET: COMPETITIVE LEADERSHIP MAPPING, 2019
    9.3 STRENGTH OF PRODUCT PORTFOLIO
        FIGURE 42 PRODUCT PORTFOLIO ANALYSIS OF TOP PLAYERS IN SOLVENTS MARKET
    9.4 BUSINESS STRATEGY EXCELLENCE
        FIGURE 43 BUSINESS STRATEGY EXCELLENCE OF TOP PLAYERS IN SOLVENTS MARKET
        FIGURE 44 EXPANSIONS WAS THE KEY GROWTH STRATEGY ADOPTED BY MARKET PLAYERS BETWEEN 2012 AND 2020
    9.5 COMPETITIVE LEADERSHIP MAPPING, 2019 (SMALL AND MEDIUM-SIZED ENTERPRISES)
           9.5.1 PROGRESSIVE COMPANIES
           9.5.2 RESPONSIVE COMPANIES
           9.5.3 DYNAMIC COMPANIES
           9.5.4 STARTING BLOCKS
                 FIGURE 45 SOLVENTS MARKET (OTHER MAJOR PLAYERS): COMPETITIVE LEADERSHIP MAPPING, 2019
    9.6 STRENGTH OF PRODUCT PORTFOLIO
        FIGURE 46 PRODUCT PORTFOLIO ANALYSIS OF OTHER MAJOR PLAYERS IN SOLVENTS MARKET
    9.7 BUSINESS STRATEGY EXCELLENCE
        FIGURE 47 BUSINESS STRATEGY EXCELLENCE OF OTHER MAJOR PLAYERS IN SOLVENTS MARKET
    9.8 MARKET SHARE ANALYSIS
        FIGURE 48 MARKET SHARE ANALYSIS OF SOLVENTS MANUFACTURERS, 2019
    9.9 COMPETITIVE SITUATION & TRENDS
           9.9.1 EXPANSION
                 TABLE 188 EXPANSION
           9.9.2 NEW PRODUCT LAUNCH
                 TABLE 189 NEW PRODUCT LAUNCH
           9.9.3 ACQUISITION
                 TABLE 190 ACQUISITION
           9.9.4 AGREEMENT
                 TABLE 191 AGREEMENT
           9.9.5 JOINT VENTURE
                 TABLE 192 JOINT VENTURE

10 COMPANY PROFILES (Page No. - 196)
(Business Overview, Products Offered, Recent Developments, SWOT Analysis, MnM View)*
     10.1 ROYAL DUTCH SHELL PLC
           FIGURE 49 ROYAL DUTCH SHELL PLC: COMPANY SNAPSHOT
     10.2 BASF SE
           FIGURE 50 BASF SE: COMPANY SNAPSHOT
     10.3 EXXONMOBIL CORPORATION
           FIGURE 51 EXXONMOBIL CORPORATION: COMPANY SNAPSHOT
     10.4 LYONDELLBASELL INDUSTRIES HOLDINGS B.V.
           FIGURE 52 LYONDELLBASELL INDUSTRIES HOLDINGS B.V.: COMPANY SNAPSHOT
     10.5 EASTMAN CHEMICAL COMPANY
           FIGURE 53 EASTMAN CHEMICAL COMPANY: COMPANY SNAPSHOT
     10.6 ASHLAND GLOBAL HOLDINGS INC.
           FIGURE 54 ASHLAND GLOBAL HOLDINGS INC.: COMPANY SNAPSHOT
     10.7 CELANESE CORPORATION
           FIGURE 55 CELANESE CORPORATION: COMPANY SNAPSHOT
     10.8 HUNTSMAN CORPORATION
           FIGURE 56 HUNTSMAN CORPORATION: COMPANY SNAPSHOT
     10.9 SOLVAY SA
           FIGURE 57 SOLVAY SA: COMPANY SNAPSHOT
     10.10 HONEYWELL INTERNATIONAL INC.
           FIGURE 58 HONEYWELL INTERNATIONAL INC.: COMPANY SNAPSHOT
     10.11 INEOS AG
           FIGURE 59 INEOS AG: COMPANY SNAPSHOT
     10.12 OTHER MARKET PLAYERS
             10.12.1 ARKEMA SA
             10.12.2 BHARAT PETROLEUM CORPORATION LIMITED
             10.12.3 BP PLC
             10.12.4 CARGILL INCORPORATED
             10.12.5 CHEVRON PHILLIPS CHEMICAL CO.
             10.12.6 THE DOW CHEMICAL COMPANY
             10.12.7 FLOTEK INDUSTRIES INC.
             10.12.8 INVISTA SARL
             10.12.9 MONUMENT CHEMICAL INC.
             10.12.10 OLIN CORPORATION
             10.12.11 RELIANCE INDUSTRIES LTD. (RIL)
             10.12.12 TOP SOLVENT CO., LTD.

*Details on Business Overview, Products Offered, Recent Developments, SWOT Analysis, MnM View might not be captured in case of unlisted companies.

11 ADJACENT & RELATED MARKETS (Page No. - 244)
     11.1 INTRODUCTION
     11.2 LIMITATIONS
     11.3 METAL CLEANING CHEMICALS MARKET
             11.3.1 MARKET DEFINITION
             11.3.2 MARKET OVERVIEW
             11.3.3 METAL CLEANING CHEMICALS MARKET, BY INGREDIENT TYPE
                    TABLE 193 METAL CLEANING CHEMICALS MARKET SIZE, BY INGREDIENT TYPE, 2018–2025 (KILOTON)
                    TABLE 194 METAL CLEANING CHEMICALS MARKET SIZE, BY INGREDIENT TYPE, 2018–2025 (USD MILLION)
             11.3.4 METAL CLEANING CHEMICALS MARKET, BY METAL
                    TABLE 195 METAL CLEANING CHEMICALS MARKET SIZE, BY METAL, 2018–2025 (KILOTON)
                    TABLE 196 METAL CLEANING CHEMICALS MARKET SIZE, BY METAL, 2018–2025 (USD MILLION)
             11.3.5 METAL CLEANING CHEMICALS MARKET, BY REGION
                    TABLE 197 METAL CLEANING CHEMICALS MARKET SIZE, BY REGION, 2018–2025 (KILOTON)
                    TABLE 198 METAL CLEANING CHEMICALS MARKET SIZE, BY REGION, 2018–2025 (USD MILLION)
     11.4 PAINTS & COATINGS MARKET
             11.4.1 MARKET DEFINITION
             11.4.2 MARKET OVERVIEW
             11.4.3 PAINTS & COATINGS MARKET, BY RESIN TYPE
                    TABLE 199 ARCHITECTURAL PAINTS & COATINGS MARKET SIZE, BY RESIN TYPE, 2016–2019 (KILOTON)
                    TABLE 200 ARCHITECTURAL PAINTS & COATINGS MARKET SIZE, BY RESIN TYPE, 2020–2025 (KILOTON)
                    TABLE 201 ARCHITECTURAL PAINTS & COATINGS MARKET SIZE, BY RESIN TYPE, 2016–2019 (USD MILLION)
                    TABLE 202 ARCHITECTURAL PAINTS & COATINGS MARKET SIZE, BY RESIN TYPE, 2020–2025 (USD MILLION)
                    TABLE 203 INDUSTRIAL PAINTS & COATINGS MARKET SIZE, BY RESIN TYPE, 2016–2019 (KILOTON)
                    TABLE 204 INDUSTRIAL PAINTS & COATINGS MARKET SIZE, BY RESIN TYPE, 2020–2025 (KILOTON)
                    TABLE 205 INDUSTRIAL PAINTS & COATINGS MARKET SIZE, BY RESIN TYPE, 2016–2019 (USD MILLION)
                    TABLE 206 INDUSTRIAL PAINTS & COATINGS MARKET SIZE, BY RESIN TYPE, 2020–2025 (USD MILLION)
             11.4.4 PAINTS & COATINGS MARKET, BY END-USE INDUSTRY
                        11.4.4.1 Architectural
                                     11.4.4.1.1 BETTER ECONOMIC GROWTH AND HIGHER INCOMES ARE BOOSTING THE DEMAND FOR ARCHITECTURAL COATINGS
                                                TABLE 207 ARCHITECTURAL PAINTS & COATINGS MARKET SIZE, BY END-USE INDUSTRY, 2016–2019 (KILOTON)
                                                TABLE 208 ARCHITECTURAL PAINTS & COATINGS MARKET SIZE, BY END-USE INDUSTRY, 2020–2025 (KILOTON)
                                                TABLE 209 ARCHITECTURAL PAINTS & COATINGS MARKET SIZE, BY END-USE INDUSTRY, 2016–2019 (USD MILLION)
                                                TABLE 210 ARCHITECTURAL PAINTS & COATINGS MARKET SIZE, BY END-USE INDUSTRY, 2020–2025 (USD MILLION)
                        11.4.4.2 Industrial
                                     11.4.4.2.1 GROWING DEMAND FROM APAC TO BOOST THE INDUSTRIAL COATINGS MARKET
                                                TABLE 211 INDUSTRIAL PAINTS & COATINGS MARKET SIZE, BY END-USE INDUSTRY, 2016–2019 (KILOTON)
                                                TABLE 212 INDUSTRIAL PAINTS & COATINGS MARKET SIZE, BY END-USE INDUSTRY, 2020–2025 (KILOTON)
                                                TABLE 213 INDUSTRIAL PAINTS & COATINGS MARKET SIZE, BY END-USE INDUSTRY, 2016–2019 (USD MILLION)
                                                TABLE 214 INDUSTRIAL PAINTS & COATINGS MARKET SIZE, BY END-USE INDUSTRY, 2020–2025 (USD MILLION)

12 APPENDIX (Page No. - 256)
     12.1 INSIGHTS FROM INDUSTRY EXPERTS
     12.2 DISCUSSION GUIDE
     12.3 KNOWLEDGE STORE: MARKETSANDMARKETS’ SUBSCRIPTION PORTAL
     12.4 AVAILABLE CUSTOMIZATIONS
     12.5 RELATED REPORTS
     12.6 AUTHOR DETAILS

The study involved four major activities in estimating the market size for solvents market. Exhaustive secondary research was done to collect information on the market, the peer market, and the parent market. The next step was to validate these findings, assumptions, and sizing with industry experts across the value chain through primary research. Both top-down and bottom-up approaches were employed to estimate the complete market size. Post that, the market breakdown and data triangulation procedures were used to estimate the market size of the segments and subsegments.

Secondary Research

Secondary sources used in this study included annual reports, press releases, and investor presentations of companies; white papers; certified publications; articles from recognized authors; and gold standard & silver standard websites such as Factiva, ICIS, Bloomberg, and others. Findings of this study were verified through primary research by conducting extensive interviews with key officials such as CEOs, VPs, directors, and other executives. The various sources of secondary research are websites of various associations, such as the European Environmental Protection Agency (EPA), European Solvents Industry Group (ESIG), European Chlorinated Solvents Association (ECSA), European Solvents Volatile Organic Compounds Coordination Group (ESVOC CG), European Renewable Ethanol (ePure), Registration, Evaluation, Authorization and Restriction of Chemicals (REACH), Turkish Chemical Manufacturers Association (TKSD), Gulf Petrochemicals & Chemicals Association (GPCA), American Institute of Chemical Engineers (AIChE), The European Chemical Industry Council (CEFIC), and International Organization of Motor Vehicle Manufacturers (OICA).

Primary Research

The solvents market comprises several stakeholders, such as raw material suppliers, end-product manufacturers, and regulatory organizations in the supply chain. The demand side of this market is characterized by the development of the cosmetics, food, and pharmaceuticals industries. The supply side is characterized by advancements in technology and diverse application industries. Various primary sources from both the supply and demand sides of the market were interviewed to obtain qualitative and quantitative information.
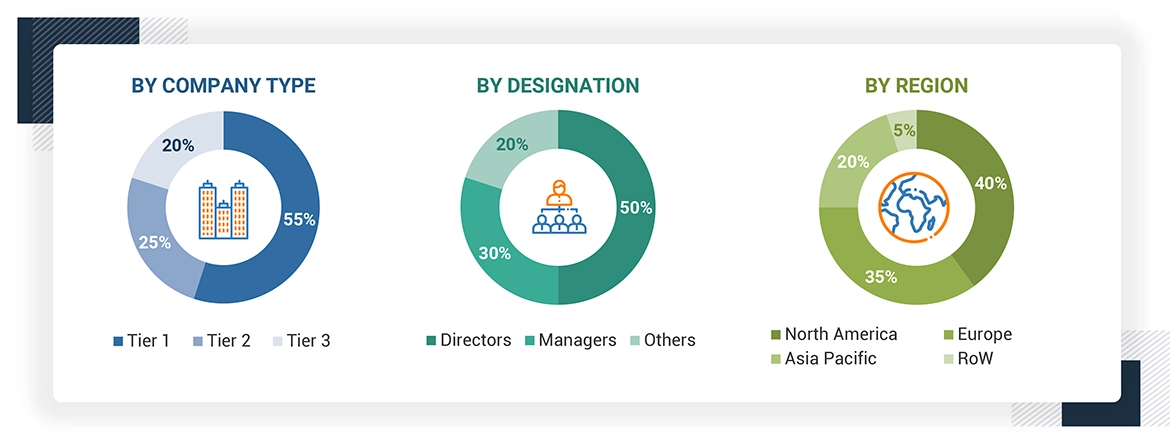
Solvent Market Size, and Share

To know about the assumptions considered for the study, download the pdf brochure

Market Size Estimation

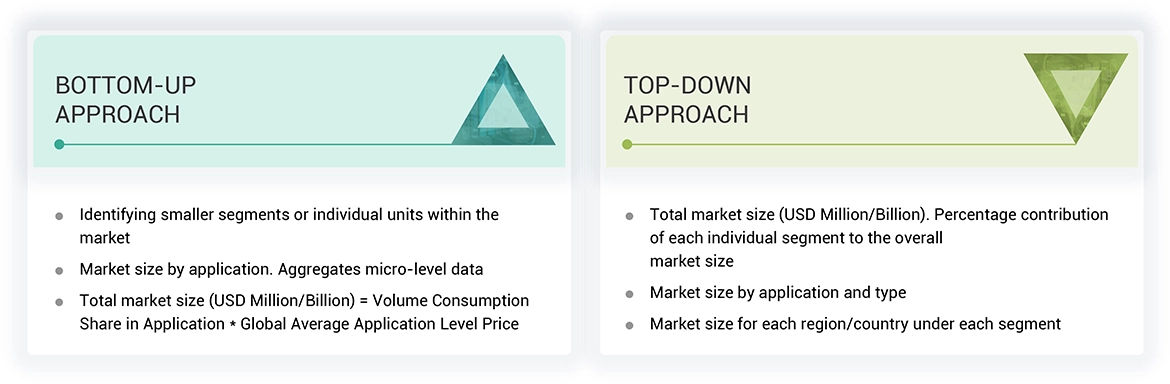
Both top-down and bottom-up approaches were used to estimate and validate the total size of the solvents market. These methods were also used extensively to estimate the size of various subsegments in the market. The research methodology used to estimate the market size includes the following:

The key players in the industry were identified through extensive secondary research.

  • The industry’s supply chain and market size, in terms of value, were determined through primary and secondary research processes.
  • All percentage shares, splits, and breakdowns were determined using secondary sources and verified through primary sources.

Data Triangulation

After arriving at the overall market size—using the market size estimation processes as explained above—the market was split into several segments and subsegments. To complete the overall market engineering process and arrive at the exact statistics of each market segment and subsegment, the data triangulation, and market breakdown procedures were employed, wherever applicable. The data was triangulated by studying various factors and trends from both the demand and supply sides in the personal care industry.

Report Objectives

  • To analyze and forecast the size of the grease market in terms of value and volume
  • To provide detailed information regarding key factors, such as drivers, restraints, challenges and opportunities influencing the growth of the market
  • To define, describe, and segment the solvents market based on product type, and application
  • To forecast the size of the market segments for regions such as APAC, North America, Europe, South America, and the Middle East & Africa
  • To strategically analyze the segmented markets with respect to individual growth trends, prospects, and contribution to the overall market
  • To identify and analyze opportunities for stakeholders in the market
  • To strategically profile key players and comprehensively analyze their core competencies

Available Customizations

With the given market data, MarketsandMarkets offers customizations according to client-specific needs.

  • Further breakdown of the Rest of Asia Pacific, Rest of Europe, Rest of South America, and Rest of the Middle East & Africa solvents market
  • Detailed analysis and profiles of additional market players (up to 5)
Custom Market Research Services

We will customize the research for you, in case the report listed above does not meet with your exact requirements. Our custom research will comprehensively cover the business information you require to help you arrive at strategic and profitable business decisions.

Request Customization
Report Code
CH 2218
Published ON
Sep, 2020
Choose License Type
BUY NOW
  • SHARE
X
Request Customization
Speak to Analyst
Speak to Analyst
OR FACE-TO-FACE MEETING
PERSONALIZE THIS RESEARCH
  • Triangulate with your Own Data
  • Get Data as per your Format and Definition
  • Gain a Deeper Dive on a Specific Application, Geography, Customer or Competitor
  • Any level of Personalization
REQUEST A FREE CUSTOMIZATION
LET US HELP YOU!
  • What are the Known and Unknown Adjacencies Impacting the Solvents Market
  • What will your New Revenue Sources be?
  • Who will be your Top Customer; what will make them switch?
  • Defend your Market Share or Win Competitors
  • Get a Scorecard for Target Partners
CUSTOMIZED WORKSHOP REQUEST
+1-888-600-6441
  • Call Us
  • +1-888-600-6441 (Corporate office hours)
  • +1-888-600-6441 (US/Can toll free)
  • +44-800-368-9399 (UK office hours)
CONNECT WITH US
ABOUT TRUST ONLINE
©2024 MarketsandMarkets Research Private Ltd. All rights reserved
DMCA.com Protection Status Website Feedback